Solana Price Analysis of March 12, 2025: SOL Faces Resistance at $128 – Can Bulls Push Higher?

0
0

Are you keeping an eye on the SOL price today and wondering what’s next? The Solana price analysis shows significant price swings, including an upward channel, a breakout, and a potential pullback in the past 24 hours. Bulls are trying to push the price higher, but resistance levels remain a challenge. Meanwhile, bearish signals hint at a possible decline. As traders assess key levels, the Solana price prediction focuses on crucial support and resistance zones that could determine its next move. Will Solana hold its gains, or is a downturn ahead? Let’s break down the latest price action.
Solana Faces Resistance at $125.81 – Fakeout or Trend Reversal?
The trading day of March 11th began with a death cross on the MACD line, triggering a sharp price drop. The RSI hit an oversold level at 00:40 UTC, leading the price to find support at $112.01. A golden cross on the MACD at 1:15 UTC initiated an upward trend, causing sharp price fluctuations, with overbought conditions at 2:20 UTC and 3:10 UTC. Another golden cross at 5:00 UTC fueled an upward channel, gaining momentum as the RSI showed overbought conditions at 5:10 UTC. An overbought RSI at 11:40 UTC led the price to test resistance at $125.81.
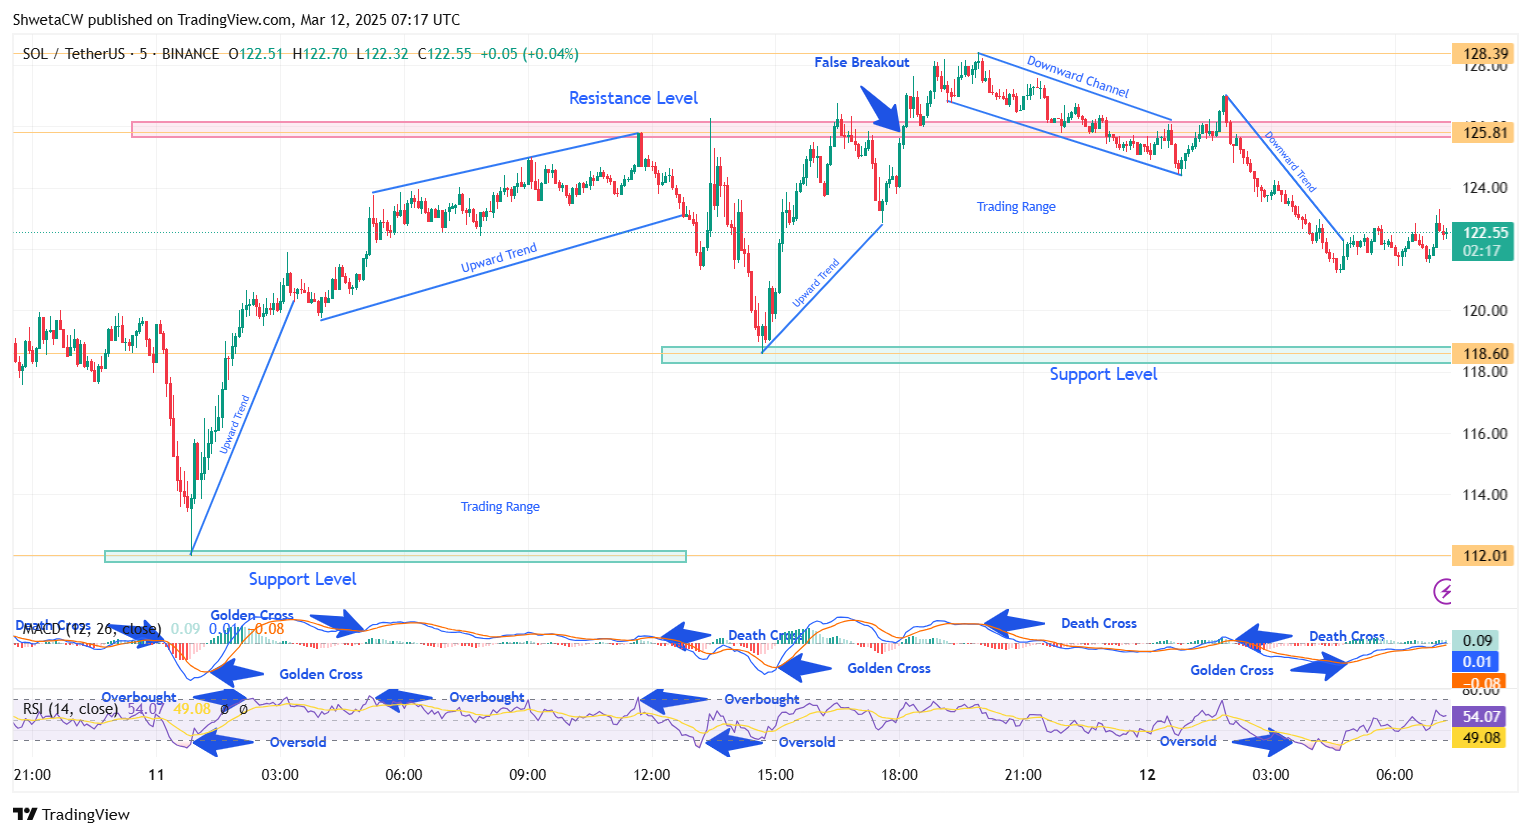
Chart 1, Analyzed by ShwetaCW, published on TradingView, March 12, 2025
However, based on Solana price analysis, a death cross on the MACD at 12:05 UTC weakened momentum, pushing the price downward. At 13:05 UTC, an oversold RSI signaled support at $118.60. The price rebounded as a golden cross at 15:00 UTC suggested another upward trend, but it failed to hold above and fell back into the trading range.
At 18:05 UTC, a golden cross on the MACD helped the price break resistance, suggesting a potential breakout. However, at 19:55 UTC, a death cross appeared, triggering a downward channel and bringing the price back toward resistance, confirming the breakout as a fakeout and keeping it within the trading range.
Solana Faces False Breakout as Downward Pressure Continues
The trading day of March 12th continued the downward channel. At 1:00 UTC, a golden cross appeared on the MACD line, signaling an upward move. The price briefly broke above the resistance, creating a false breakout. However, a death cross at 2:05 UTC initiated a downward trend, pulling the price back into the previous trading range. The price declined further, with oversold situations on the RSI at 3:55 UTC and 4:40 UTC. At 4:50 UTC, the MACD line formed a golden cross, suggesting an upward move, and the price rebounded within the trading range.
Solana Price Prediction
Solana price analysis shows the price has experienced an upward channel, a false breakout, and a downward trend. If the SOL price today continues its upward trend, it could break the $125.81 resistance. However, if selling pressure increases, the price could face a pullback, potentially testing the $118.60 support. A breakout above resistance could push it towards the $128-$130 range, while a breakdown below support could lead to further declines. Traders should watch key indicators closely in this Solana price prediction outlook.
The post Solana Price Analysis of March 12, 2025: SOL Faces Resistance at $128 – Can Bulls Push Higher? appeared first on Coinfomania.
0
0

 Manage all your crypto, NFT and DeFi from one place
Securely connect the portfolio you’re using to start.

0
0

0
0


0
0