Ethereum Momentum Cools After Pectra – What’s Next for ETH Price?

0
0

Ethereum (ETH) is up more than 58% in the last 30 days, with nearly 40% of that surge happening in just the past 10 days. Despite this sharp rally, several key indicators are starting to flash caution.
BBTrend has turned negative, whale accumulation is declining, and short-term EMA momentum is stalling. These signals suggest Ethereum may be approaching a critical point where renewed buying pressure is needed to sustain its uptrend—or risk a potential reversal.
Ethereum BBTrend Turns Negative After Month-Long Surge
Ethereum’s BBTrend has just dipped into negative territory, now sitting at -0.02 after maintaining a positive trend for about seven consecutive days.
This shift follows a strong peak of 28.39 on May 12, signaling the end of the bullish phase.
The move below zero comes after Ethereum surged 58.5% over the past month, raising questions about whether the asset is entering a consolidation period or facing early signs of a pullback.
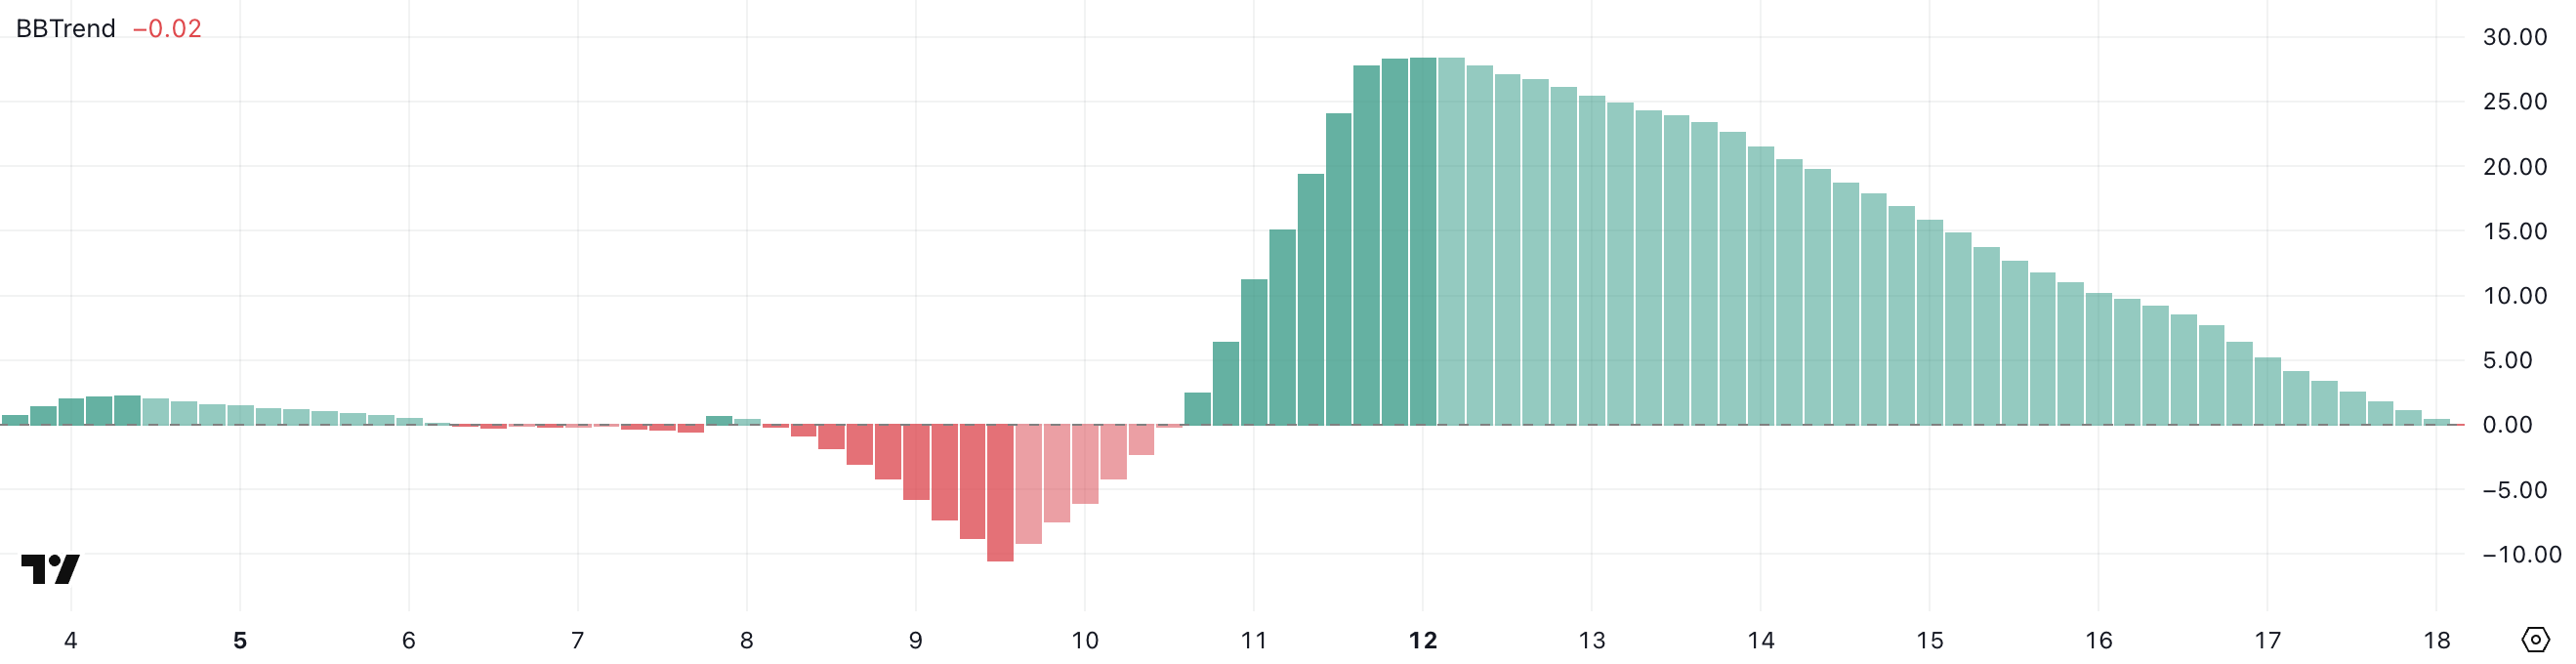 ETH BBTrend. Source: TradingView.
The BBTrend, or Bollinger Band Trend, measures price momentum relative to volatility by assessing how far price moves deviate from their average within the Bollinger Bands.
When BBTrend values are positive, it generally indicates bullish momentum, while negative values suggest the market may be losing strength or entering a bearish phase.
With ETH’s BBTrend now slightly below zero, it may signal waning buying pressure after the recent rally. If this trend continues downward, Ethereum’s price could stall or retrace as traders shift to a more cautious stance.
Ethereum Whale Count Falls Below Key Level for First Time Since April 9
Ethereum whale activity is showing signs of decline after weeks of stability. Addresses holding between 1,000 and 10,000 ETH—classified as Ethereum whales—had remained above 5,440 since mid-April, reaching 5,463 on May 8.
However, over the past 10 days, this number has been gradually falling, despite minor fluctuations.
As of now, it sits at 5,393, marking the first time it has dipped below 5,400 since April 9—an important psychological and historical support level for large holders.
 Ethereum Whales. Source: Santiment.
Tracking Ethereum whales is crucial because these addresses often act as market movers due to the size of their holdings. When whale numbers rise, it typically signals accumulation, reflecting confidence and long-term positioning.
Conversely, a decline may suggest distribution, profit-taking, or caution among major players.
The recent drop could imply reduced conviction from large investors following ETH’s strong rally, potentially leading to increased volatility or a cooling-off period in price momentum.
That comes at a time when some analysts are pointing out that ETH could overtake BTC and others are questioning whether ETH is still a good investment in 2025.
ETH Struggles Near $2,700—Can Bulls Reclaim $3,000?
Ethereum’s EMA (Exponential Moving Average) lines remain bullish, with short-term EMAs positioned above long-term ones.
However, momentum appears to be slowing, as the short-term lines have flattened and the gap between them is narrowing. This pattern often signals a potential shift in trend, especially if buyers fail to regain control.
While the overall structure is still positive, the loss of upward momentum introduces short-term uncertainty.
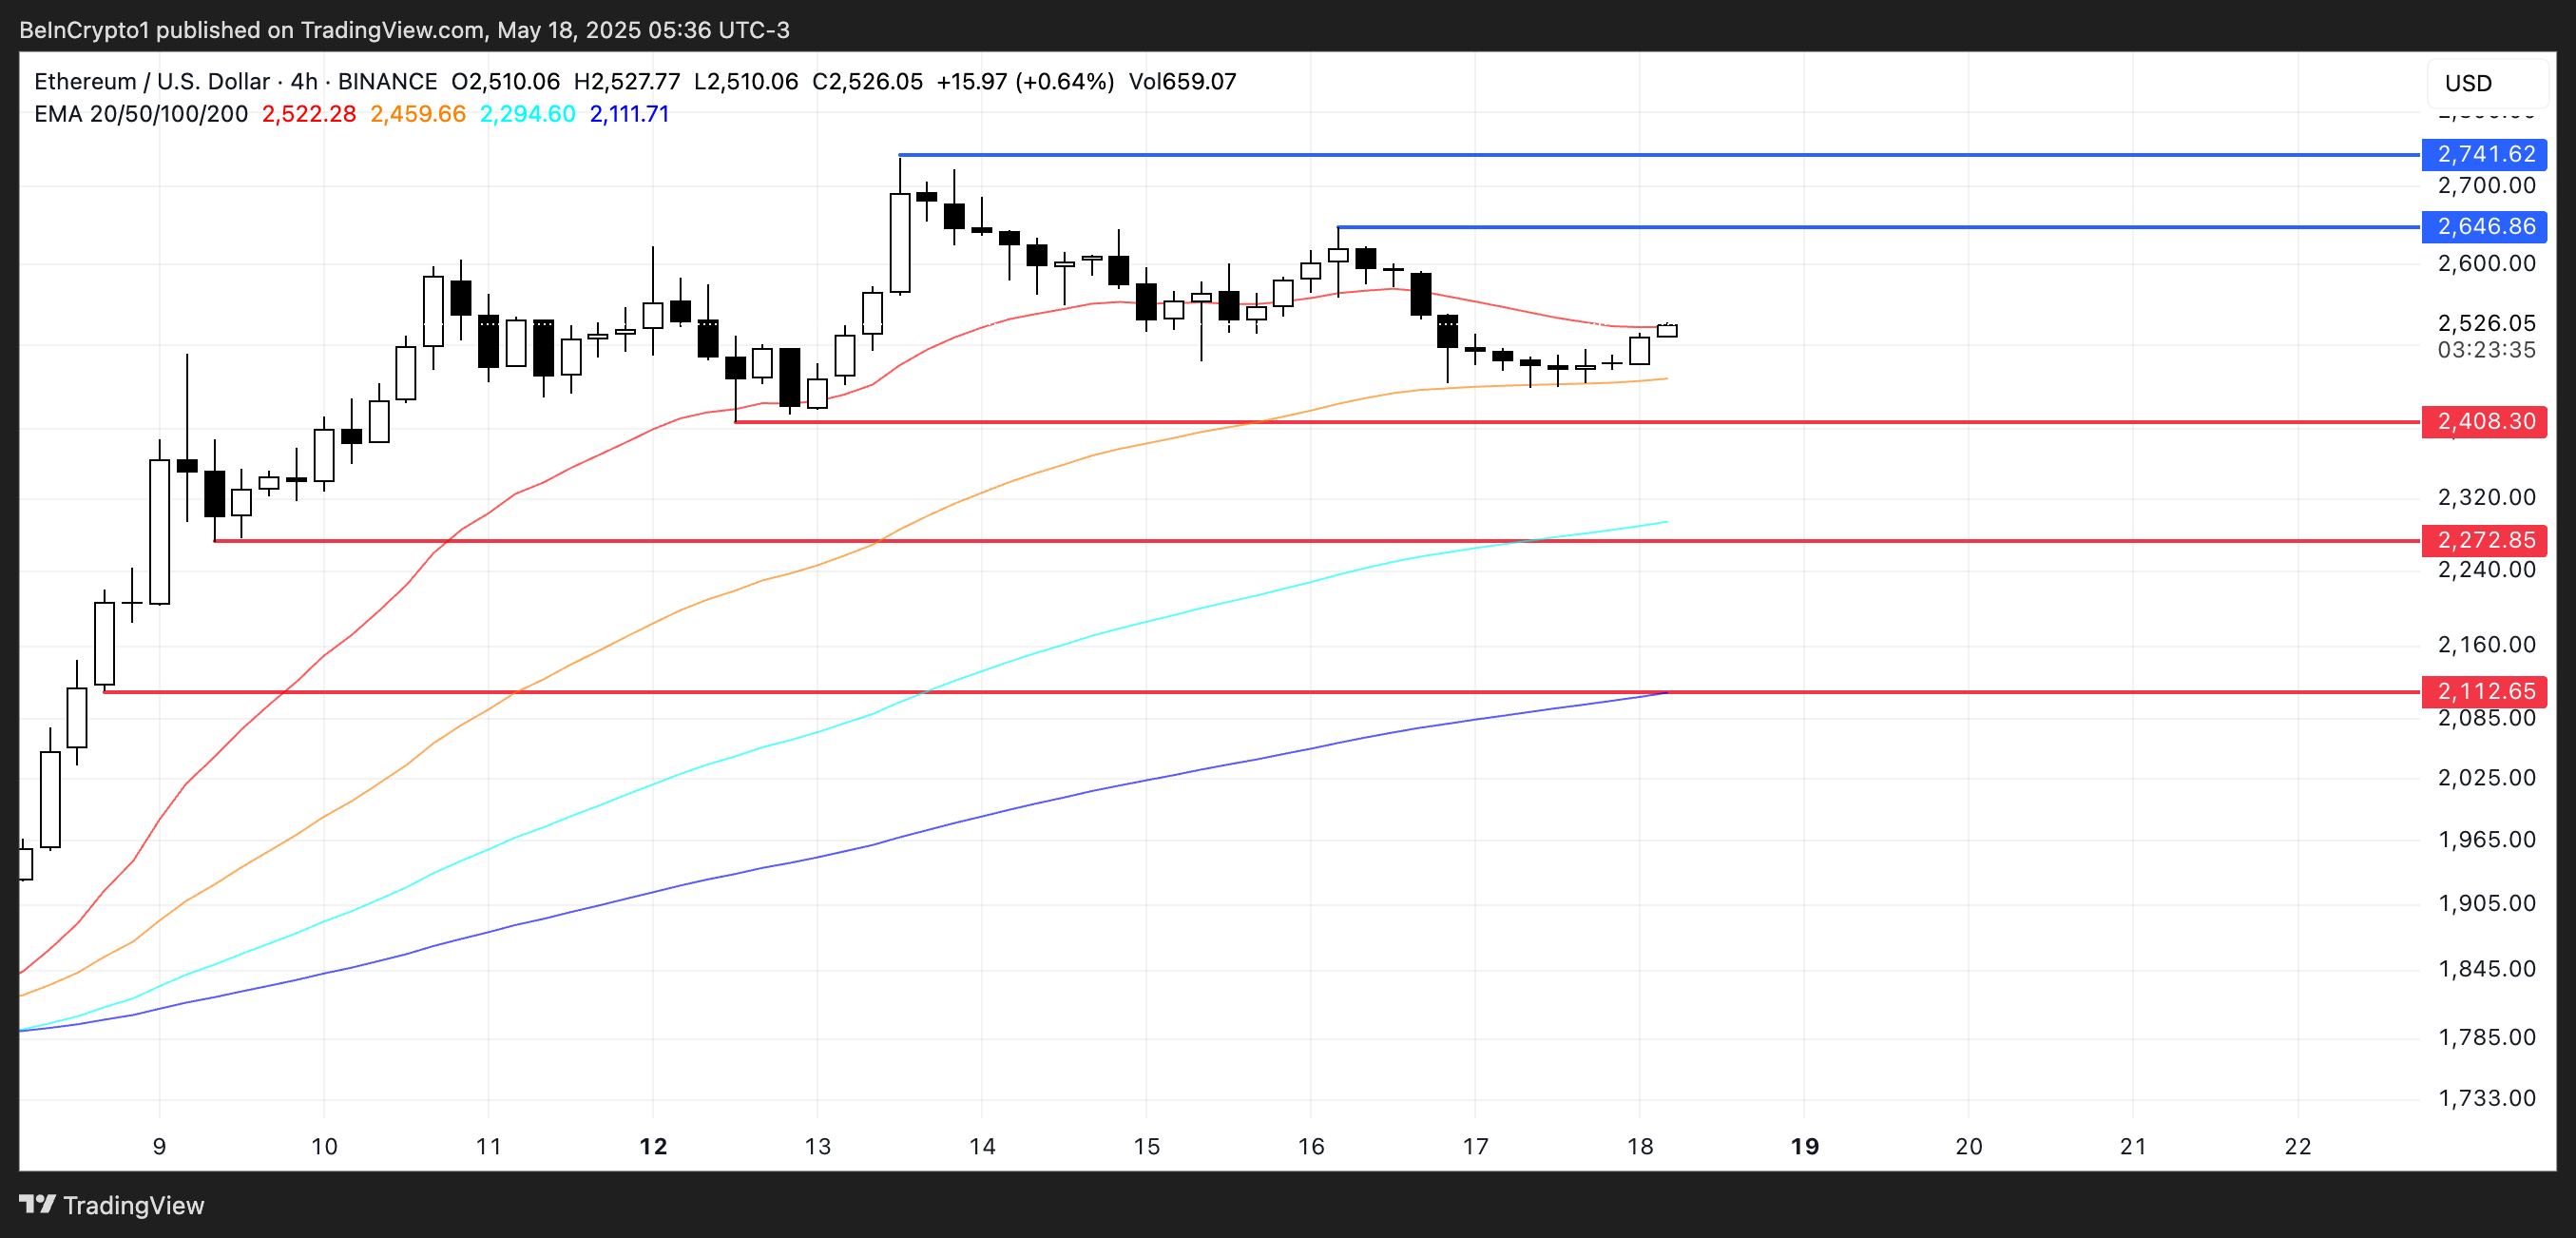 ETH Price Analysis. Source: TradingView.
ETH price has struggled to break key resistance levels at $2,741 and $2,646 over the past few days.
Without renewed buying pressure, the asset may fail to reclaim the psychological $3,000 mark—a level it hasn’t touched since February 1.
If selling pressure increases, Ethereum could revisit support at $2,408. A breakdown there might trigger further losses, with $2,272 and $2,112 acting as the next significant support zones.
0
0

 Manage all your crypto, NFT and DeFi from one place
Securely connect the portfolio you’re using to start.


0
0

