US Dollar Index (DXY) Slips Below Key Level That Preceded Bitcoin Rallies in 2017 and 2020

0
0

The US Dollar Index (DXY) fell below 96 for the first time since early 2022, losing a 15-year support line that anchored dollar strength since 2011.
This key breakdown comes amid President Donald Trump’s latest remarks and a combination of macroeconomic factors. Notably, the DXY’s latest drop has fueled optimism for a Bitcoin (BTC) rally.
US Dollar Index (DXY) Falls To 4 Year Low
Recent macroeconomic developments have put sustained pressure on the US Dollar Index. Speculation over possible Japanese yen intervention has boosted the JPY, while pulling the greenback lower.
At the same time, concerns over broader market stability are resurfacing. According to a report from Euractiv, IMF Managing Director Kristalina Georgieva said at an event hosted by the Brussels-based think tank Bruegel that the Fund is enhancing its capacity to model “unthinkable events” and prepare policy responses.
When asked whether this includes a potential run on dollar-denominated assets, she said the IMF is examining “all kinds of scenarios” as part of its ongoing analysis.
Lastly, President Trump’s recent remarks further weighed on the greenback. Speaking to reporters in Iowa, he played down the US dollar’s recent decline, saying the currency was “doing great.”
“No, I think it’s great…I think the value of the dollar, look at the business we’re doing. The dollar’s doing great,” he said.
The comments were followed by the DXY recording its largest one-day fall since the tariff-driven volatility seen in April. Market data showed the index fell to a low of 95.5, its weakest level since February 2022, before settling at a press time value of 96. It also dropped below a key long-term support level that had held since 2011.
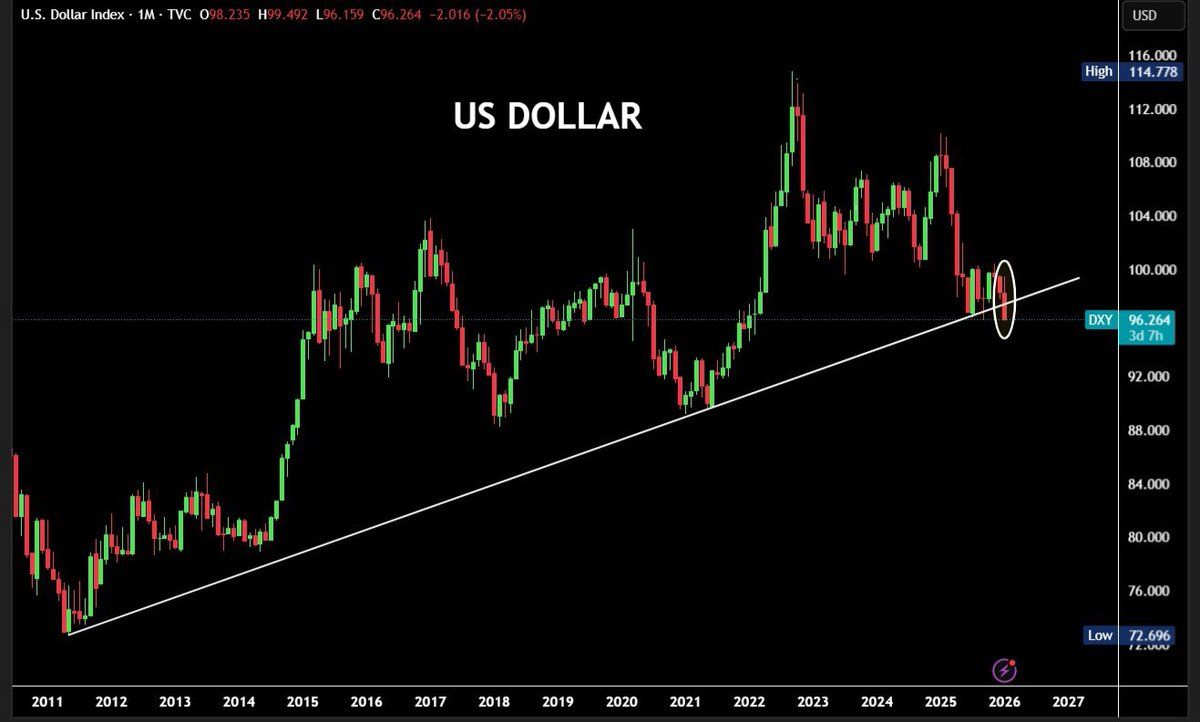 DXY Monthly Chart Illustrating 15-year Uptrend Break. Source: X/BullTheory
The next three days will be crucial. If the monthly candle closes below the 15-year trendline, analysts expect more dollar weakness.
What DXY’s Decline Means For Bitcoin
The inverse relationship between the US dollar and Bitcoin is well established. What stands out in the current move is that past declines of the DXY below the 96 level have historically preceded major Bitcoin rallies.
Analysts note that the last two such occurrences, in 2017 and 2020, were followed by substantial upside in Bitcoin.
In addition, recent technical analysis highlights bullish signals for Bitcoin. Bitcoin Vector pointed to a developing bullish divergence between Bitcoin’s price and the relative strength index (RSI), a technical pattern that can signal weakening selling pressure.
According to the post, similar setups over comparable timeframes have previously led to gains of around 10%, suggesting a move back toward the $95,000 level.
“The real signal lies in the confluence: if we see simultaneous growth in Network Fundamentals and Liquidity while BTC Dominance holds, we are likely at the genesis of a major bullish reversal,” the post read.
Nonetheless, other analysts project further downside for the largest cryptocurrency. Whether the current market setup translates into a new rally for Bitcoin will depend on confirmation from both currency markets and broader risk assets in the coming weeks.
0
0


 Manage all your crypto, NFT and DeFi from one place
Securely connect the portfolio you’re using to start.


