Whales Dump AAVE Amid Market Wipeout: Where is the Altcoin Rally?

0
0
The sudden sell-off has been fueled in part by large holders exiting their positions. According to data shared by LookonChain, two whales offloaded over $5.5 million worth of AAVE in recent hours.
As the market dropped, 2 whales dumped 24,936 $AAVE($5.51M).
0x1f4A deposited 15,646 $AAVE($3.45M) to #Binance 7 hours ago.
0x8d8B sold 9,290 $AAVE for 2.056M $USDC 14 hours ago.https://t.co/QxzcnexbSohttps://t.co/9zX56h9Rip pic.twitter.com/d8obx1m7a1
— Lookonchain (@lookonchain) June 23, 2025
Earlier today, whale address 0x1f4A deposited 15,646 AAVE (worth around $3.45 million) to Binance, while 0x8d8B sold 9,290 AAVE for 2.05 million USDC on Sunday night. These movements have shaken short-term investor confidence.
AAVE Price Outlook
On the daily AAVE price chart, the RSI is indicating that the 30th largest cryptocurrency is nearing the oversold territory. This could suggest a potential bounce if buying volume returns.
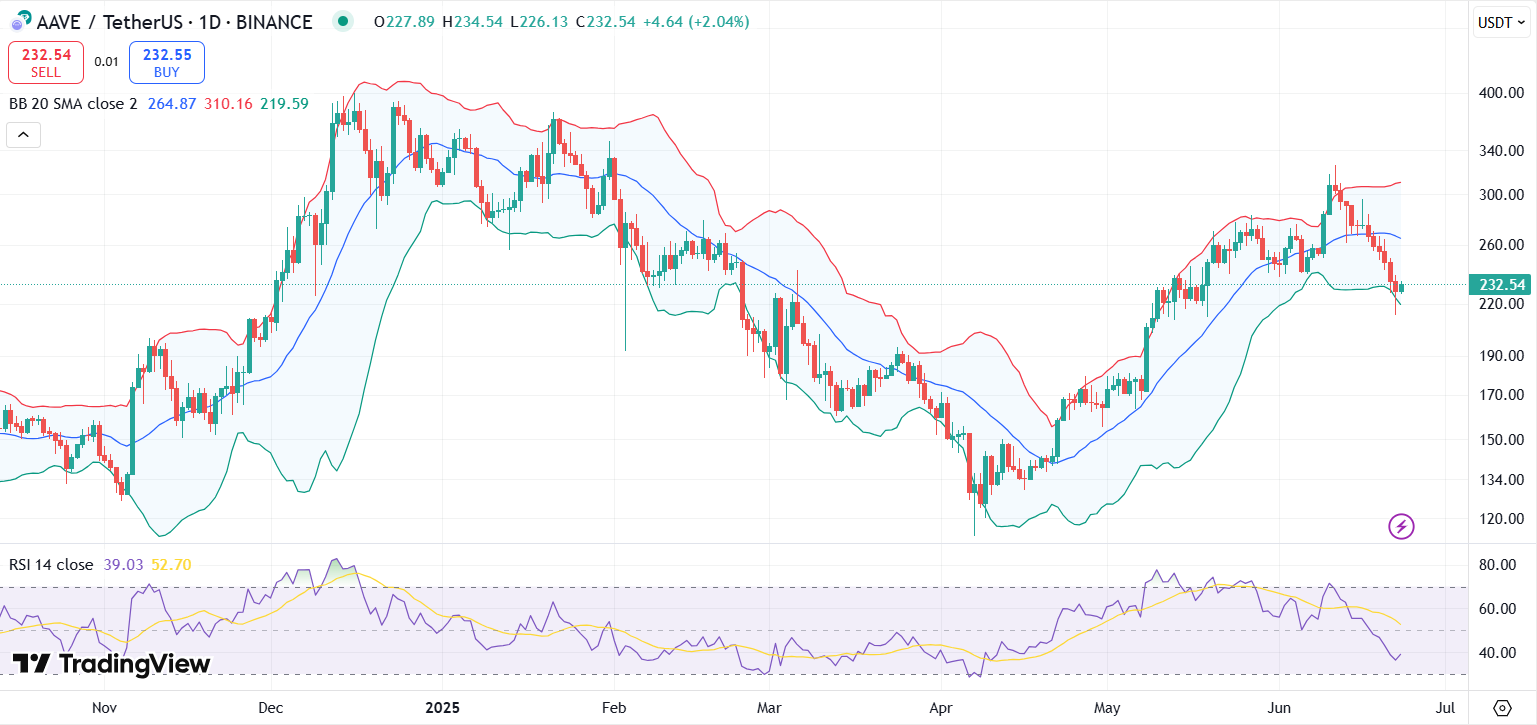
AAVE price chart with RSI and Bollinger Bands | Source: Trading View
The Bollinger Bands indicate that AAVE has touched the lower band and is currently trading below the midline (20-day Simple Moving Average), typically a bearish signal. However, this also suggests AAVE may be oversold.
If sentiment improves, a mean reversion move toward the midband (around $265) could occur in the short-term. After this level, the next immediate resistance lies at $310.
However, the MACD shows continued bearish momentum, with the MACD line sitting below the signal line. Histogram bars are also in the red, reinforcing short-term selling pressure. A break below the $219 support level could expose AAVE to deeper losses to $200.
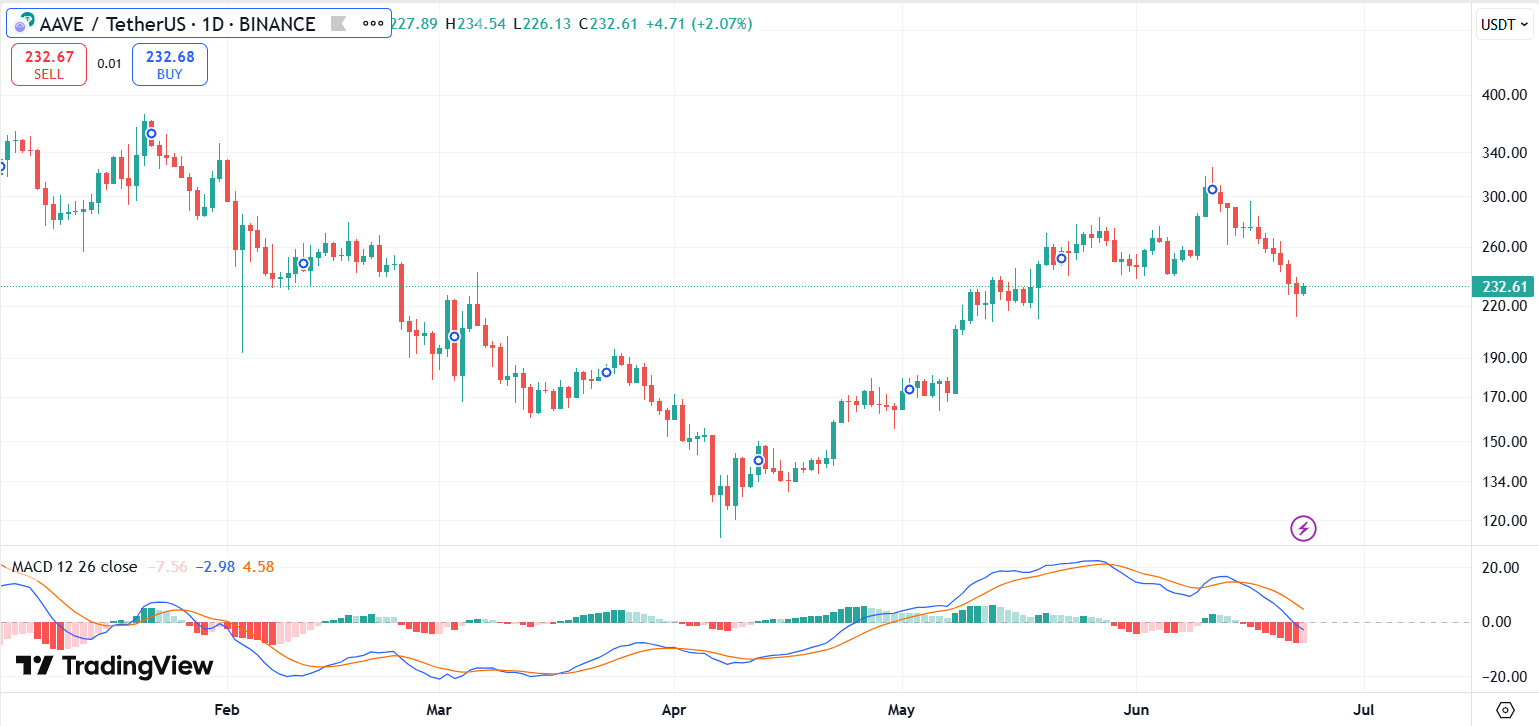
AAVE price chart with MACD | Source: Trading View
Crypto analyst Smith noted on X that AAVE has been trading within an ascending broadening wedge pattern on the daily chart over the past year. He predicted that if this long-term structure plays out, a possible +168% breakout to the $600 level is possible.
Last time it ran → +212%
Setup looks eerily familiar…
Now eyeing a potential +168% breakout toward $600+!
EMAs lining up, support respected — bulls warming up?#AAVE #DeFi #Altseason2025 pic.twitter.com/WfQIfKTcSv
— Smith (@CryptoSmith0x) June 22, 2025
Altcoin Rally Soon?
Meanwhile, the broader crypto market is also facing selling pressure. CoinMarketCap data indicate that the total market capitalization has decreased by 1% over the last 24 hours to $3.12 trillion. At the time of writing, major altcoins like Ether (ETH), XRP, and Solana (SOL) are all trading in the red.
Popular crypto analyst, Michael van de Poppe, noted on X that the altcoin season indicator has hit its lowest reading in two years, coinciding with historical data from 2019 to 2024. Traders are increasingly optimistic that a strong altcoin rally could occur soon.
#Altcoin season indicator hits the lowest number in 2 years.
Fun fact, the low of this indicator in the previous years was:
– June '19
– June '20
– July '21
– June '22
– June '23
– June '24And now: June '25.
There seems to be a pattern. pic.twitter.com/CZqfd9TqvT
— Michaël van de Poppe (@CryptoMichNL) June 22, 2025
The post Whales Dump AAVE Amid Market Wipeout: Where is the Altcoin Rally? appeared first on Coinspeaker.
0
0

 Manage all your crypto, NFT and DeFi from one place
Securely connect the portfolio you’re using to start.

0
0


0
0