Nervos Network (CKB) price outlook: what’s next after bearish flag formation?

0
0

Nervos Network (CKB) is at a critical juncture as it navigates a volatile cryptocurrency market. At press time, CKB traded at $0.007, reflecting a notable 14.96% surge over the past 24 hours.
Notably, Nervos Network is among the few cryptocurrencies that have been bullish today as the global crypto market cap dropped by 1.35% over the last day to $2.77 trillion.
Bitcoin (BTC) has dropped below $84k, while Ethereum (ETH) is hovering around $2.2k.
However, a bearish flag pattern has emerged on the CKB daily chart, raising questions about its next move.
The bearish flag technical pattern often signals a continuation of a downtrend, and traders are watching closely.
Its future price direction hinges on key price levels.
Key Nervos Network price levels to watch
Notably, the bearish flag pattern formed after a period of consolidation after a sharp decline from the December 2024 highs.
This pattern typically suggests that sellers might still be dominating.
The bearish flag’s outcome, however, depends on market forces and trader reactions, with the immediate key levels to watch lying at $0.006 and $0.0076.
If the support at $0.0060 fails, a breakdown could be imminent, seeing that it could trigger panic selling, which would amplify the downtrend.
This would, in turn, test the resolve of long-term holders.
Such a move might push CKB toward $0.0050 or even lower to the low of $0.003 hit on January 2024, aligning with its broader 54.0% decline over the past year.
It is important to note that the 24-hour trading range is between $0.005818 and $0.007825, showing intense volatility with the lower level already below $0.006.
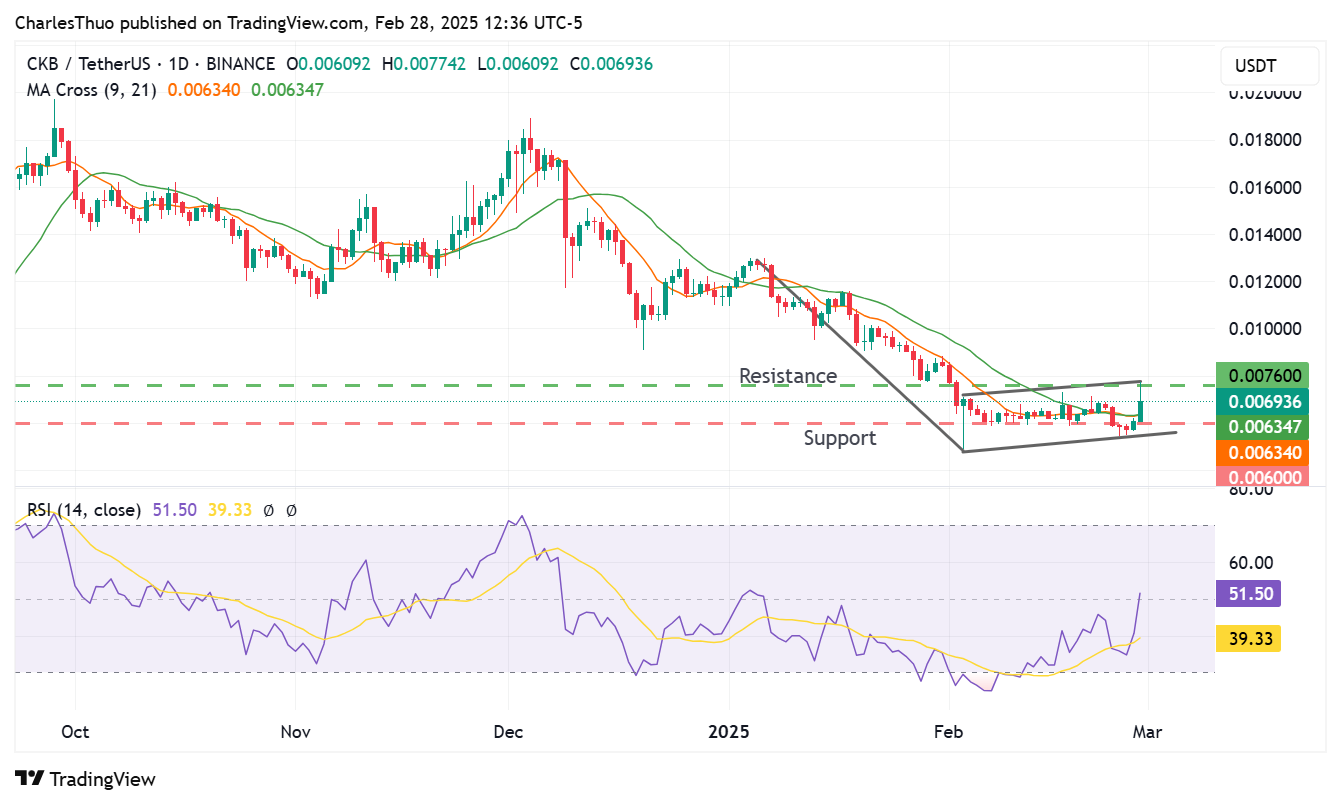
On the flip side, a bullish reversal remains possible for Nervos Network, with the immediate resistance level currently sitting at $0.0075.
The 14-day Relative Strength Index (RSI) is just above the middle level coming from an oversold region, which boosts the chances of a bullish reversal, although the current daily candlestick will have to close above the 9-day and 21-day moving averages for the bullish reversal to be confirmed.
A break above the $0.0075 resistance level might attract fresh capital bolstered by CKB’s active community and technical fundamentals, leading to renewed buyer momentum, potentially driving CKB toward $0.0080 or beyond.
For the bullish breakout to be confirmed, the price would have to break past the bearish flag’s upper boundary at around $0.0077 and soar above the resistance level at $0.008638.
Failure to do so would still keep a bearish breakout within reach, seeing that the price is currently oscillating between $0.0048 and $0.0077.
With a circulating supply of 46,036,414,597 and a total supply of 46,758,648,345, CKB’s market dynamics could shift quickly if volume supports an upward push.
Notably, Nervos Network’s broader performance offers clues on what to expect over the next few days.
The post Nervos Network (CKB) price outlook: what’s next after bearish flag formation? appeared first on Invezz
0
0
 Manage all your crypto, NFT and DeFi from one place
Securely connect the portfolio you’re using to start.