Cardano (ADA) Battles $0.926 Wall as Bear Pressure Mounts

0
0
Despite repeated breakout attempts, popular altcoin Cardano (ADA) has struggled to breach the $0.926 resistance level since mid-August.
Each rally toward the mark has been met with heavy selling pressure, keeping the token in a decline. The latest rejection came on September 14, when ADA tested the barrier again but failed to hold momentum. That setback triggered a new downward move, with the token falling by 5% since then.
ADA’s Bullish Structure Breaks Down
Readings from technical indicators observed on a one-day chart hint at the likelihood of an extended ADA price decline. For example, the coin’s Moving Average Convergence Divergence (MACD) is forming a bearish crossover, hinting at deeper losses in the near term.
For token TA and market updates: Want more token insights like this? Sign up for Editor Harsh Notariya’s Daily Crypto Newsletter here.
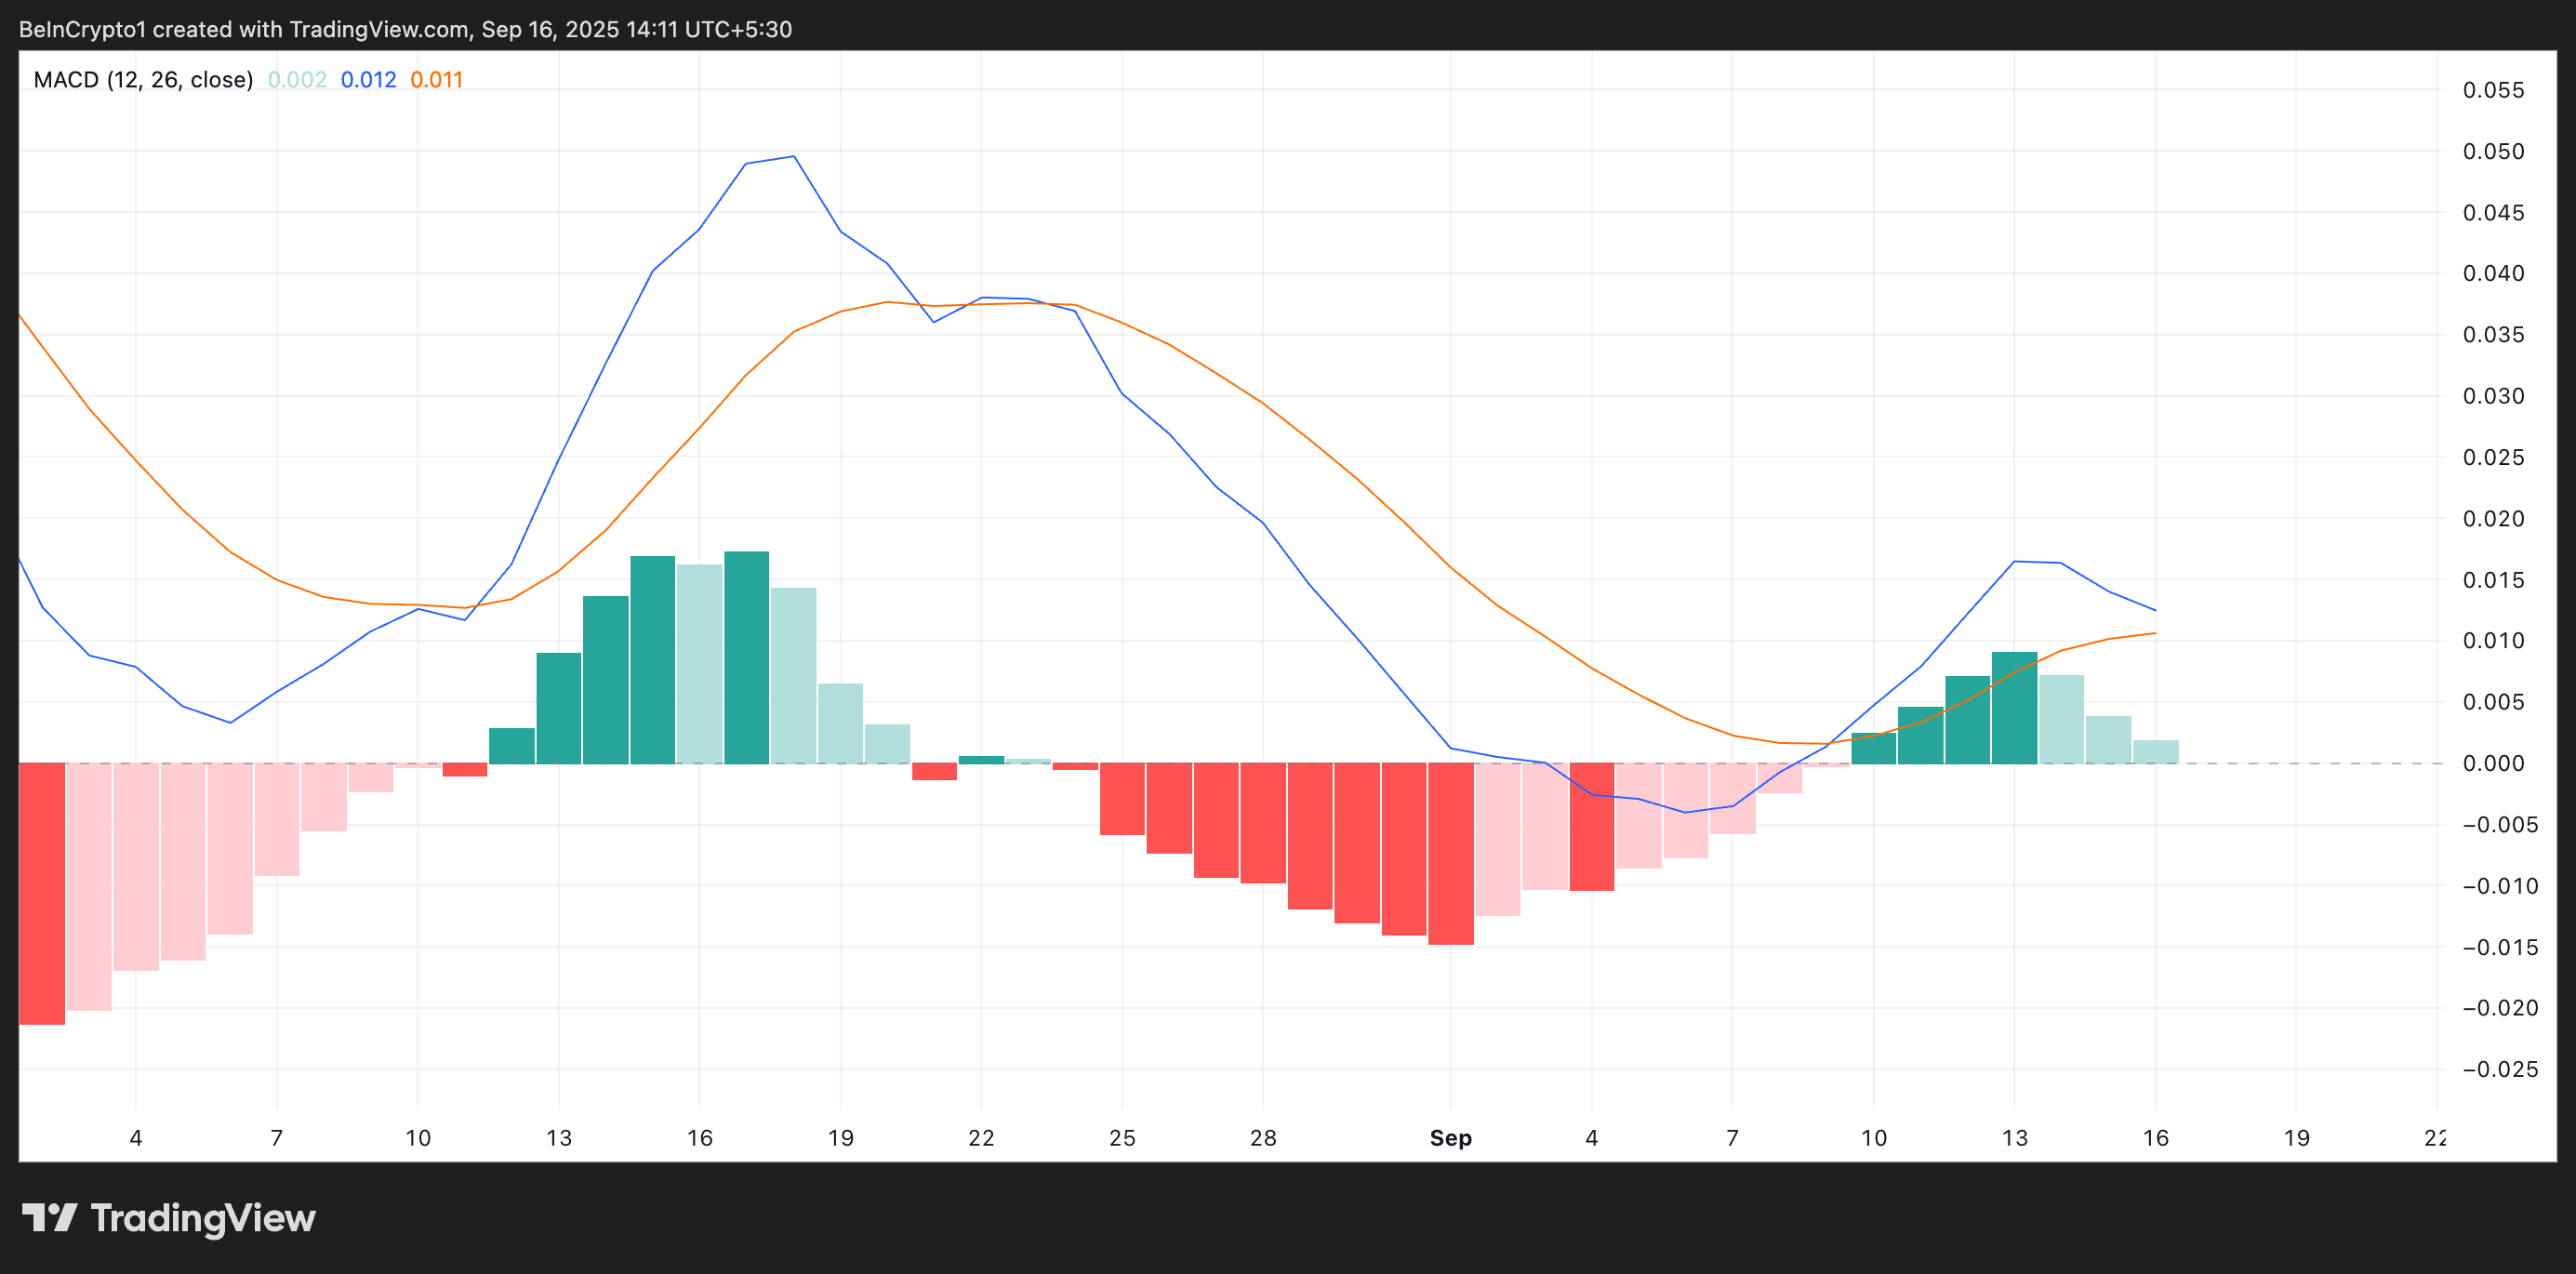 Cardano MACD. Source: TradingView
The MACD indicator identifies trends and momentum in an asset’s price movement, helping traders spot potential buy or sell signals through crossovers between the MACD and signal lines. It forms a bearish crossover when an asset’s MACD line (blue) falls below its signal line (orange), indicating a breakdown in the market’s bullish structure.
ADA’s looming bearish crossover on the MACD suggests that bullish momentum is steadily weakening, leaving the coin vulnerable to sharper declines if sellers maintain control.
Moreover, ADA’s Parabolic Stop and Reverse (SAR) has flipped position, with its dots now positioned above the price to form dynamic resistance. For context, as of this writing, the SAR is positioned at $0.952, while ADA trades at $0.869.
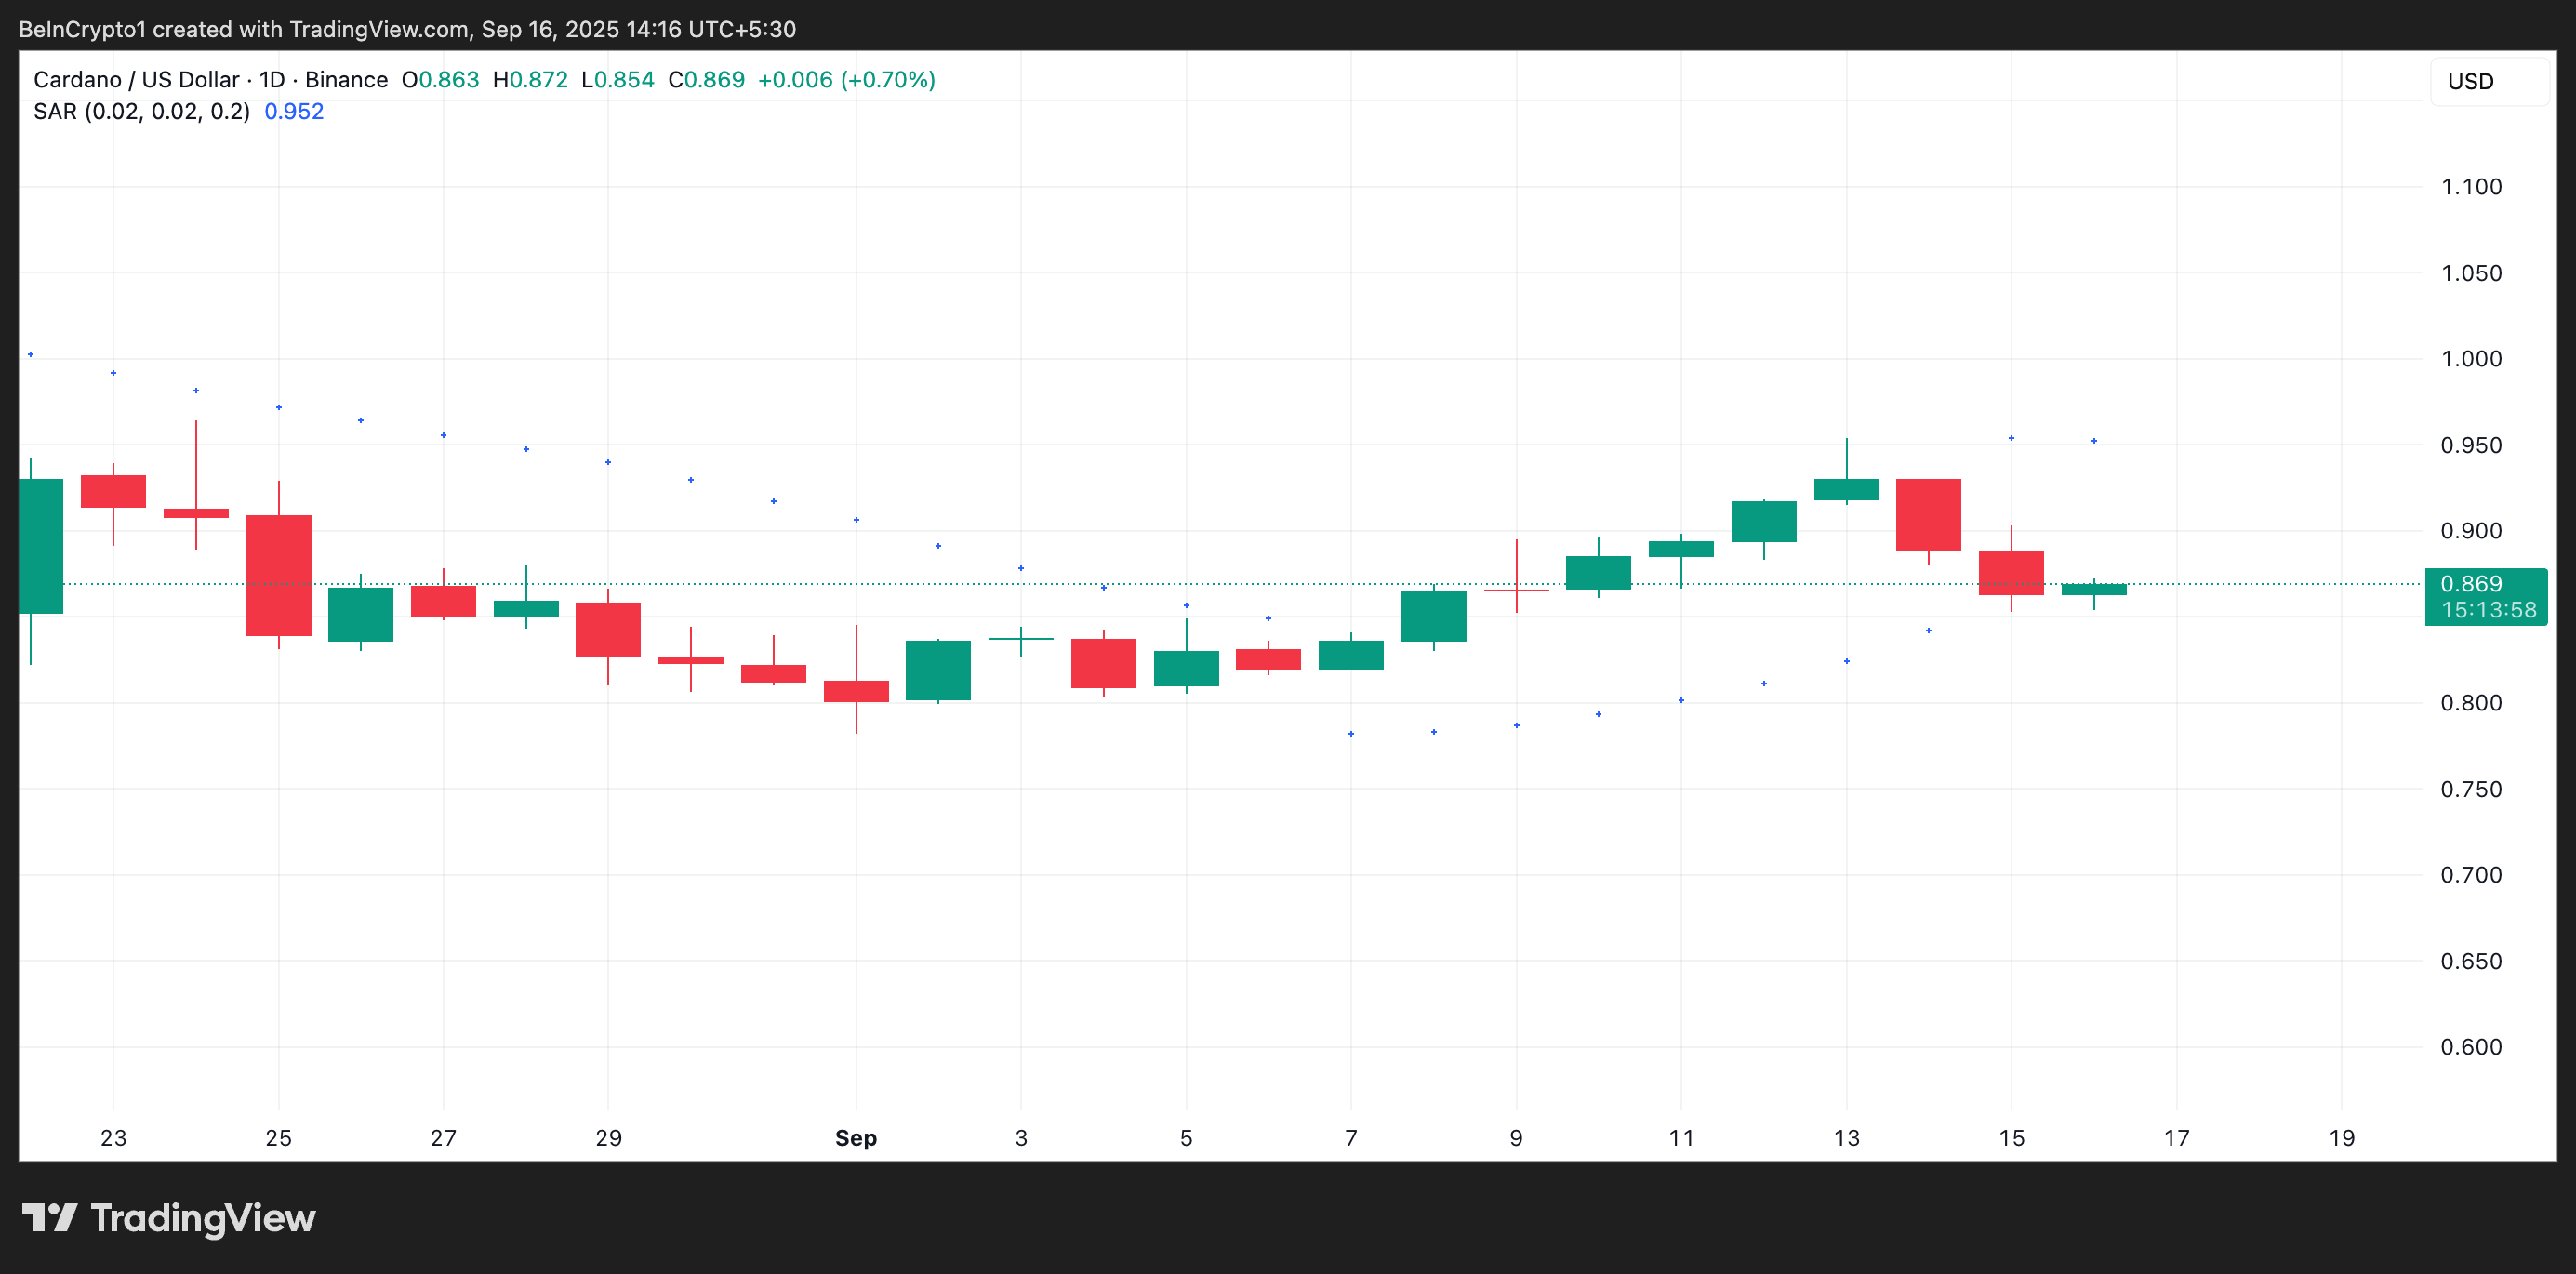 Cardano Parabolic SAR. Source: TradingView
The Parabolic SAR indicator tracks potential trend reversals by placing dots above or below an asset’s price. When the dots remain above price action, it signals that bearish pressure is firmly in control and that any recovery attempts may continue to fail.
This worsens the bearish pressure on ADA and suggests that deeper declines could be on the horizon unless bulls reclaim lost ground quickly.
Will Bears Drag It to $0.677 or Bulls Lift It to $1.079?
With key momentum indicators aligning against the bulls, ADA appears increasingly tilted toward further downside. In this scenario, it could extend its price decline and fall to $0.802. If the bulls fail to defend this support floor, the dip could reach $0.677.
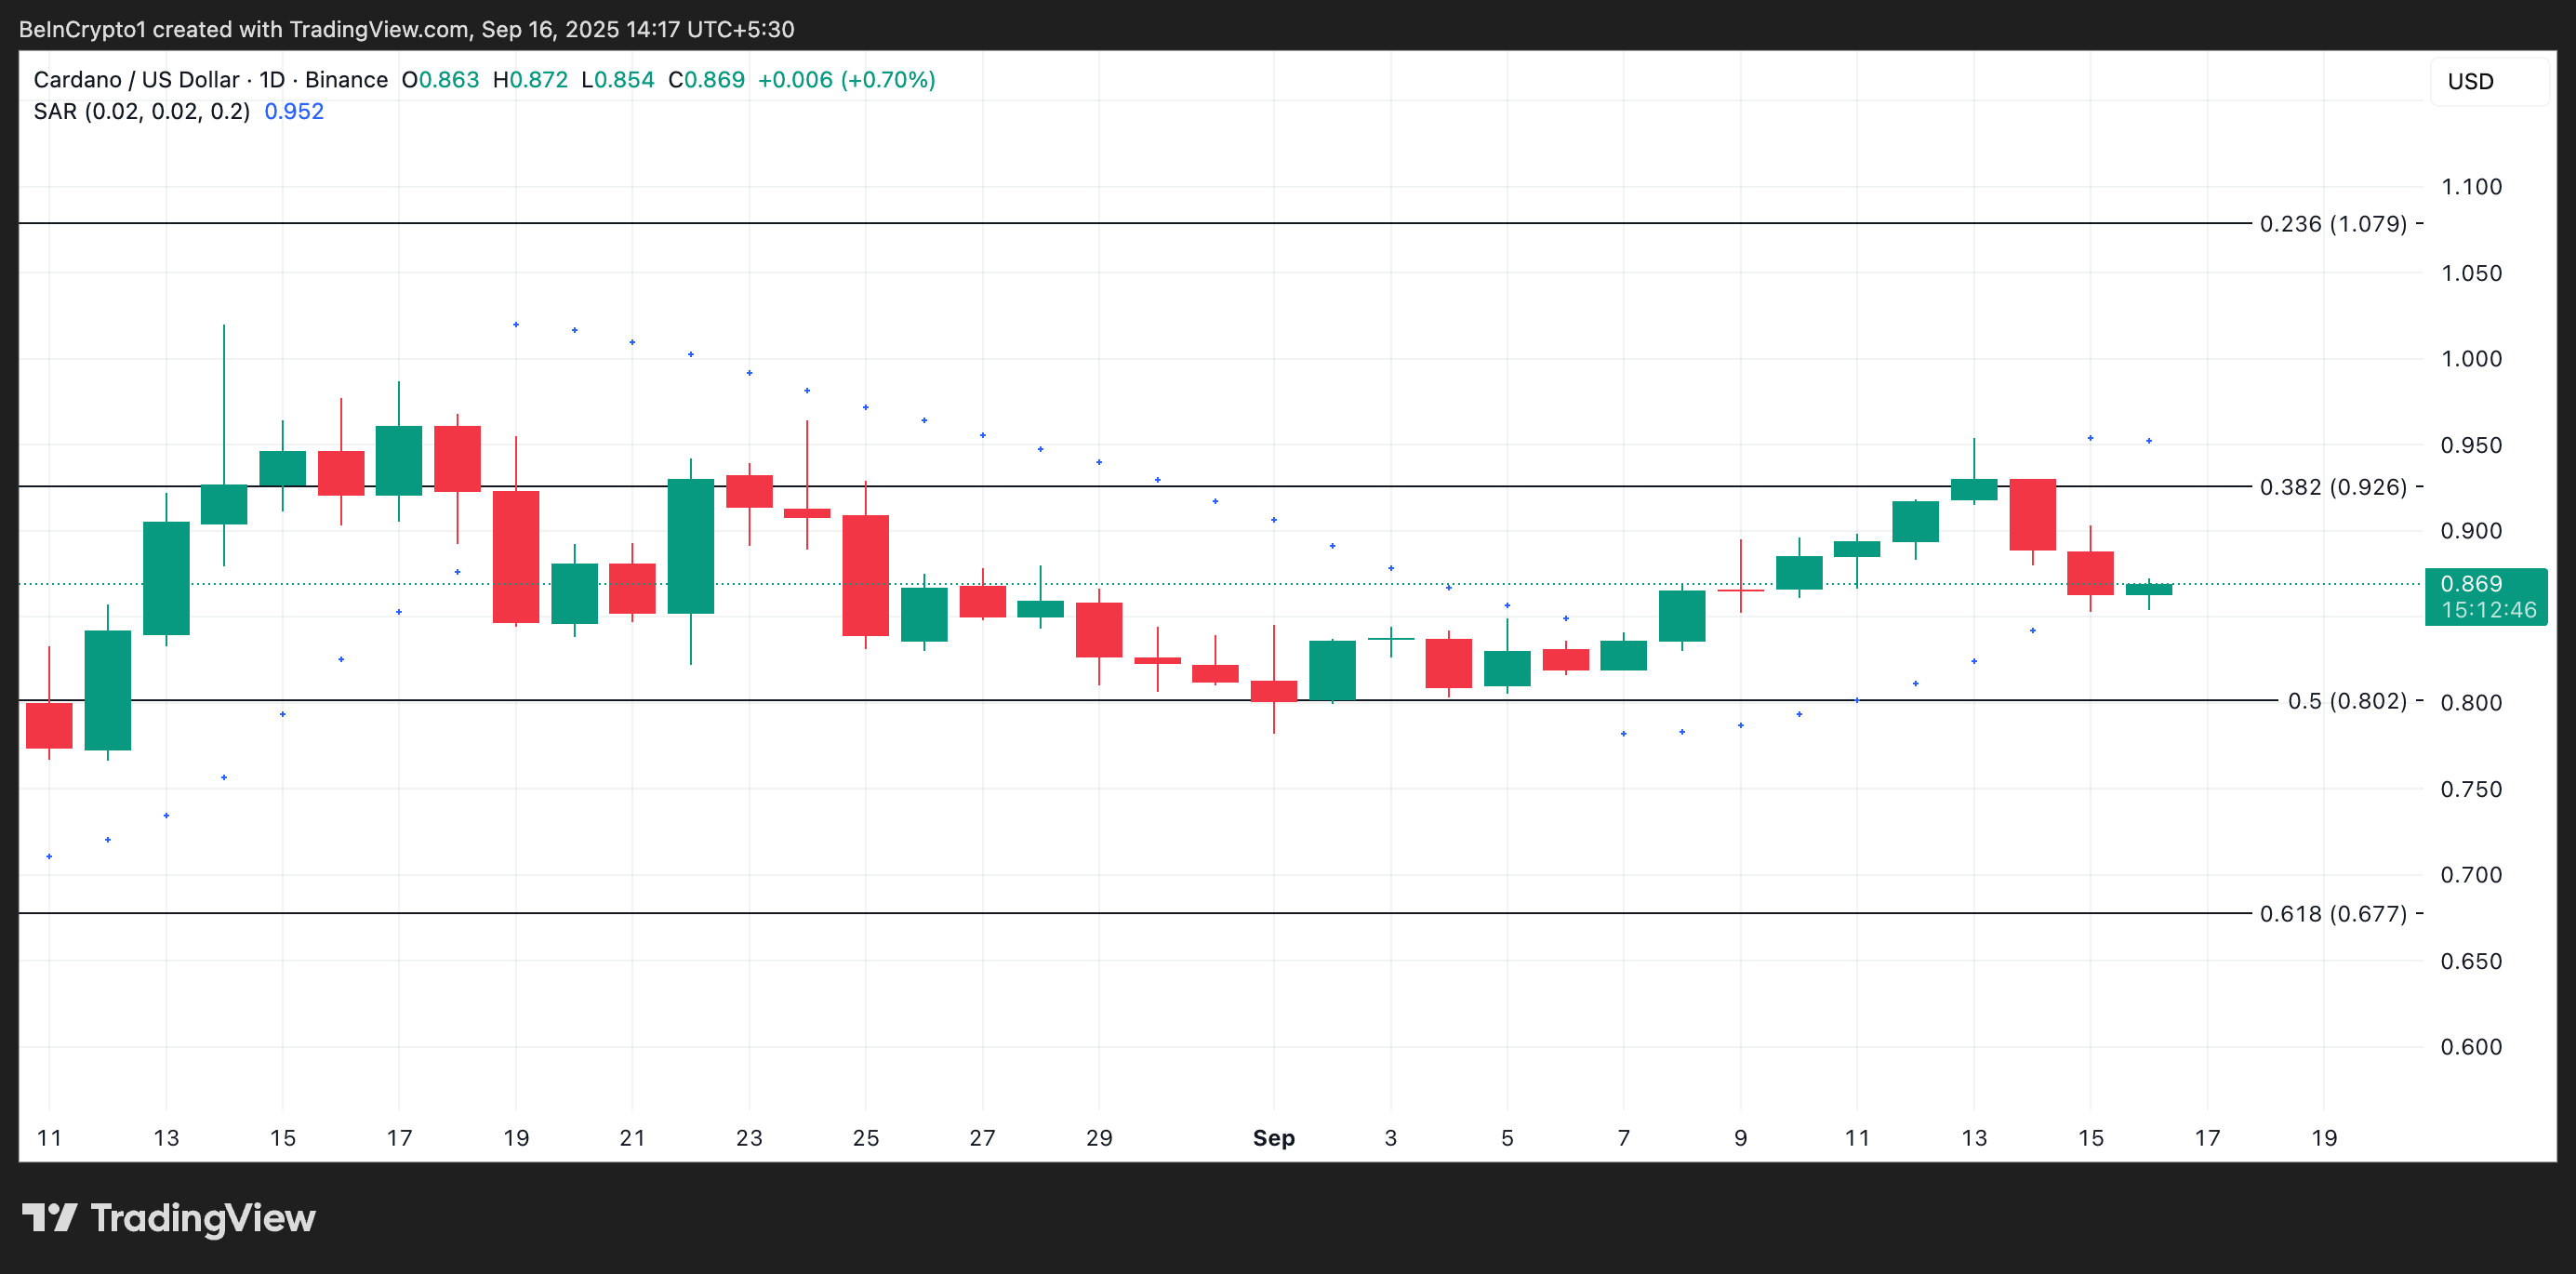 Cardano Price Analysis Source: TradingView
Conversely, if bullish momentum regains strength and ADA successfully breaches the $0.926 barrier on a retest, it could pave the way for a rally toward $1.079, a level last seen in March.
0
0


 Manage all your crypto, NFT and DeFi from one place
Securely connect the portfolio you’re using to start.


0
0