Why Is The Crypto Market Down Today?

0
0

The crypto market trades at $2.49 trillion, up 1.1% from yesterday’s close but still down 1.98% from Sunday’s high.
Bitcoin (BTC) lost $75,000 after the weekend’s US-Iran escalation, while MemeCore (M) took its first meaningful breather.
In the news today:-
- Trader Ansem argued Ethereum is in a worse position in 2026 than it was in 2023, citing Solana dominance, Hyperliquid’s lead in perpetuals, and fading rollup traction
- The US destroyer USS Spruance disabled an Iranian-flagged cargo vessel Sunday, the first seizure since Washington began enforcing its Gulf blockade a week earlier
- The KelpDAO rsETH exploit contagion has spread to Solana, with Kamino’s USDC Prime Market hitting 100% utilization and zero available liquidity
Crypto Market Bounces and Fades as Traders Wait for the Hormuz Decision
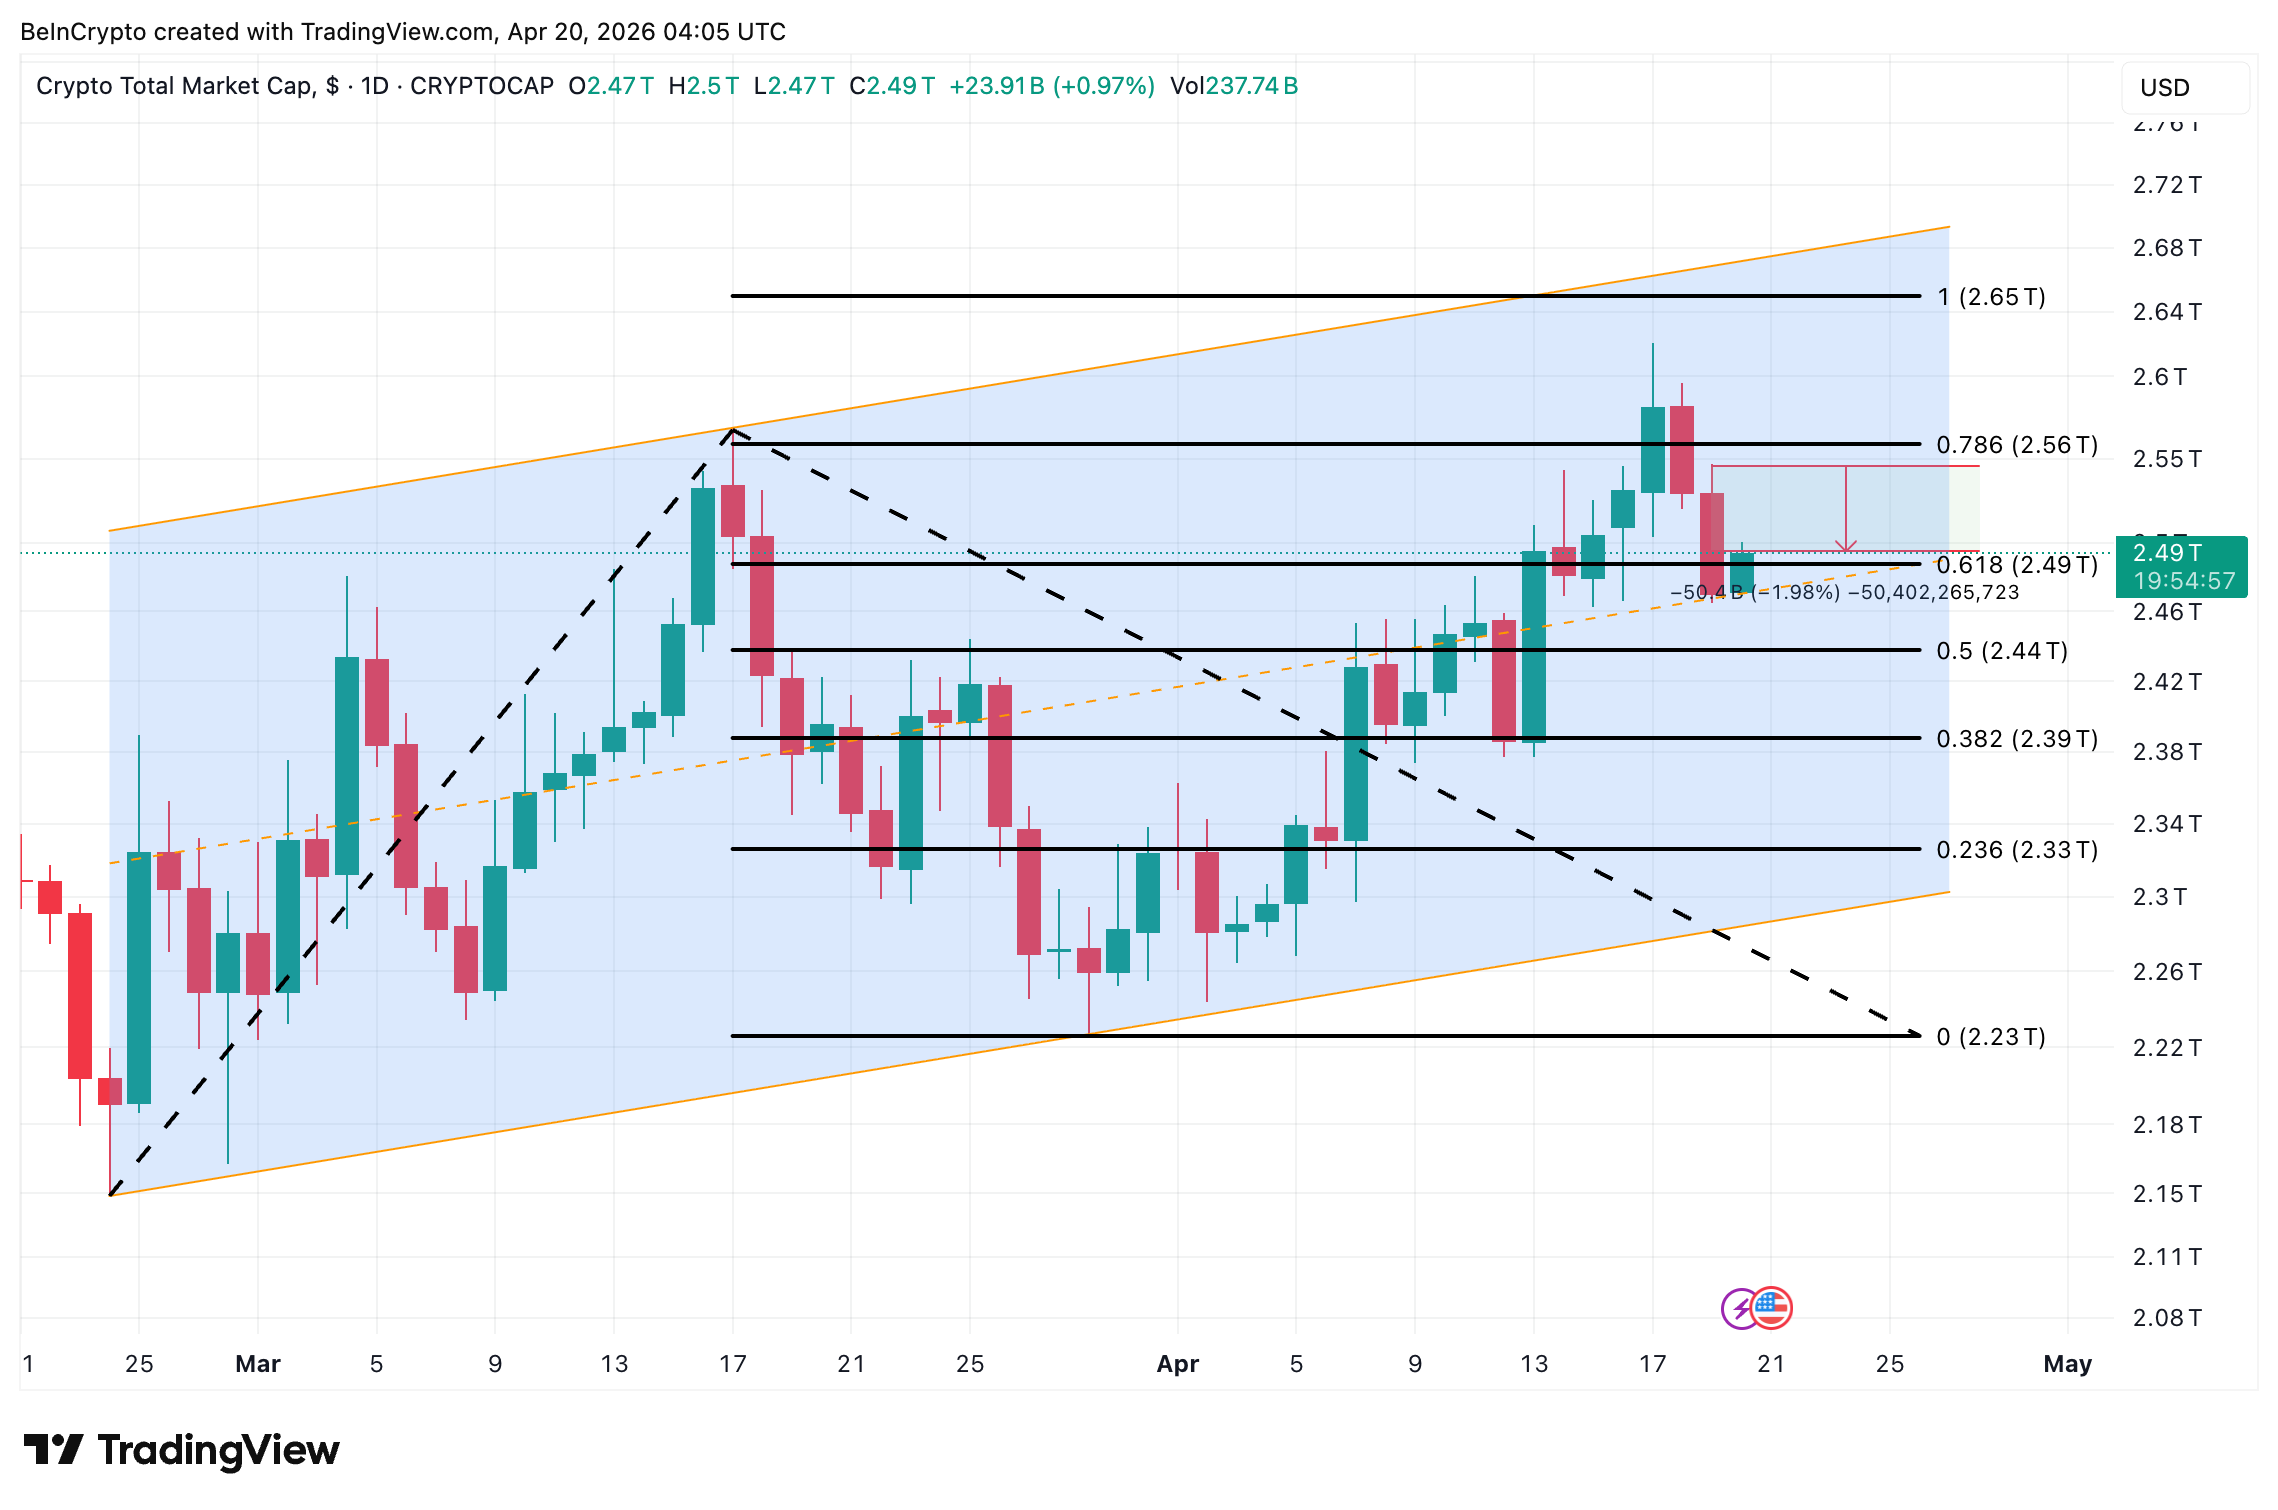
The total crypto market cap has been trading inside a rising parallel channel since February 24. The structure has produced higher highs and higher lows. However, price has failed to break above the upper trendline on multiple attempts.
On April 17, the TOTAL ticker made a local high, closing in on the upper trendline of the channel. Since then, the market has dropped back toward the middle of the channel. The current 1.1% bounce from yesterday’s close is not a breakout. It is a bounce that has yet to reclaim lost territory.
 TOTAL Crypto Market Cap Analysis: TradingView
The timing aligns with the weekend’s Hormuz escalation. Iran issued conflicting signals on closing the strait, which handles roughly 20% of global seaborne oil. That uncertainty has triggered whipsaw trading, with brief relief rallies followed by profit-taking near resistance.
The $2.49 trillion level, which is also the 0.618 Fibonacci, is acting as support. A close above $2.56 trillion would shift the tone toward a channel breakout, with $2.65 trillion as the next resistance. A loss of $2.49 trillion exposes $2.44 trillion and $2.39 trillion.
Bitcoin Loses $75,000 as the US Navy Intercepts an Iranian Vessel
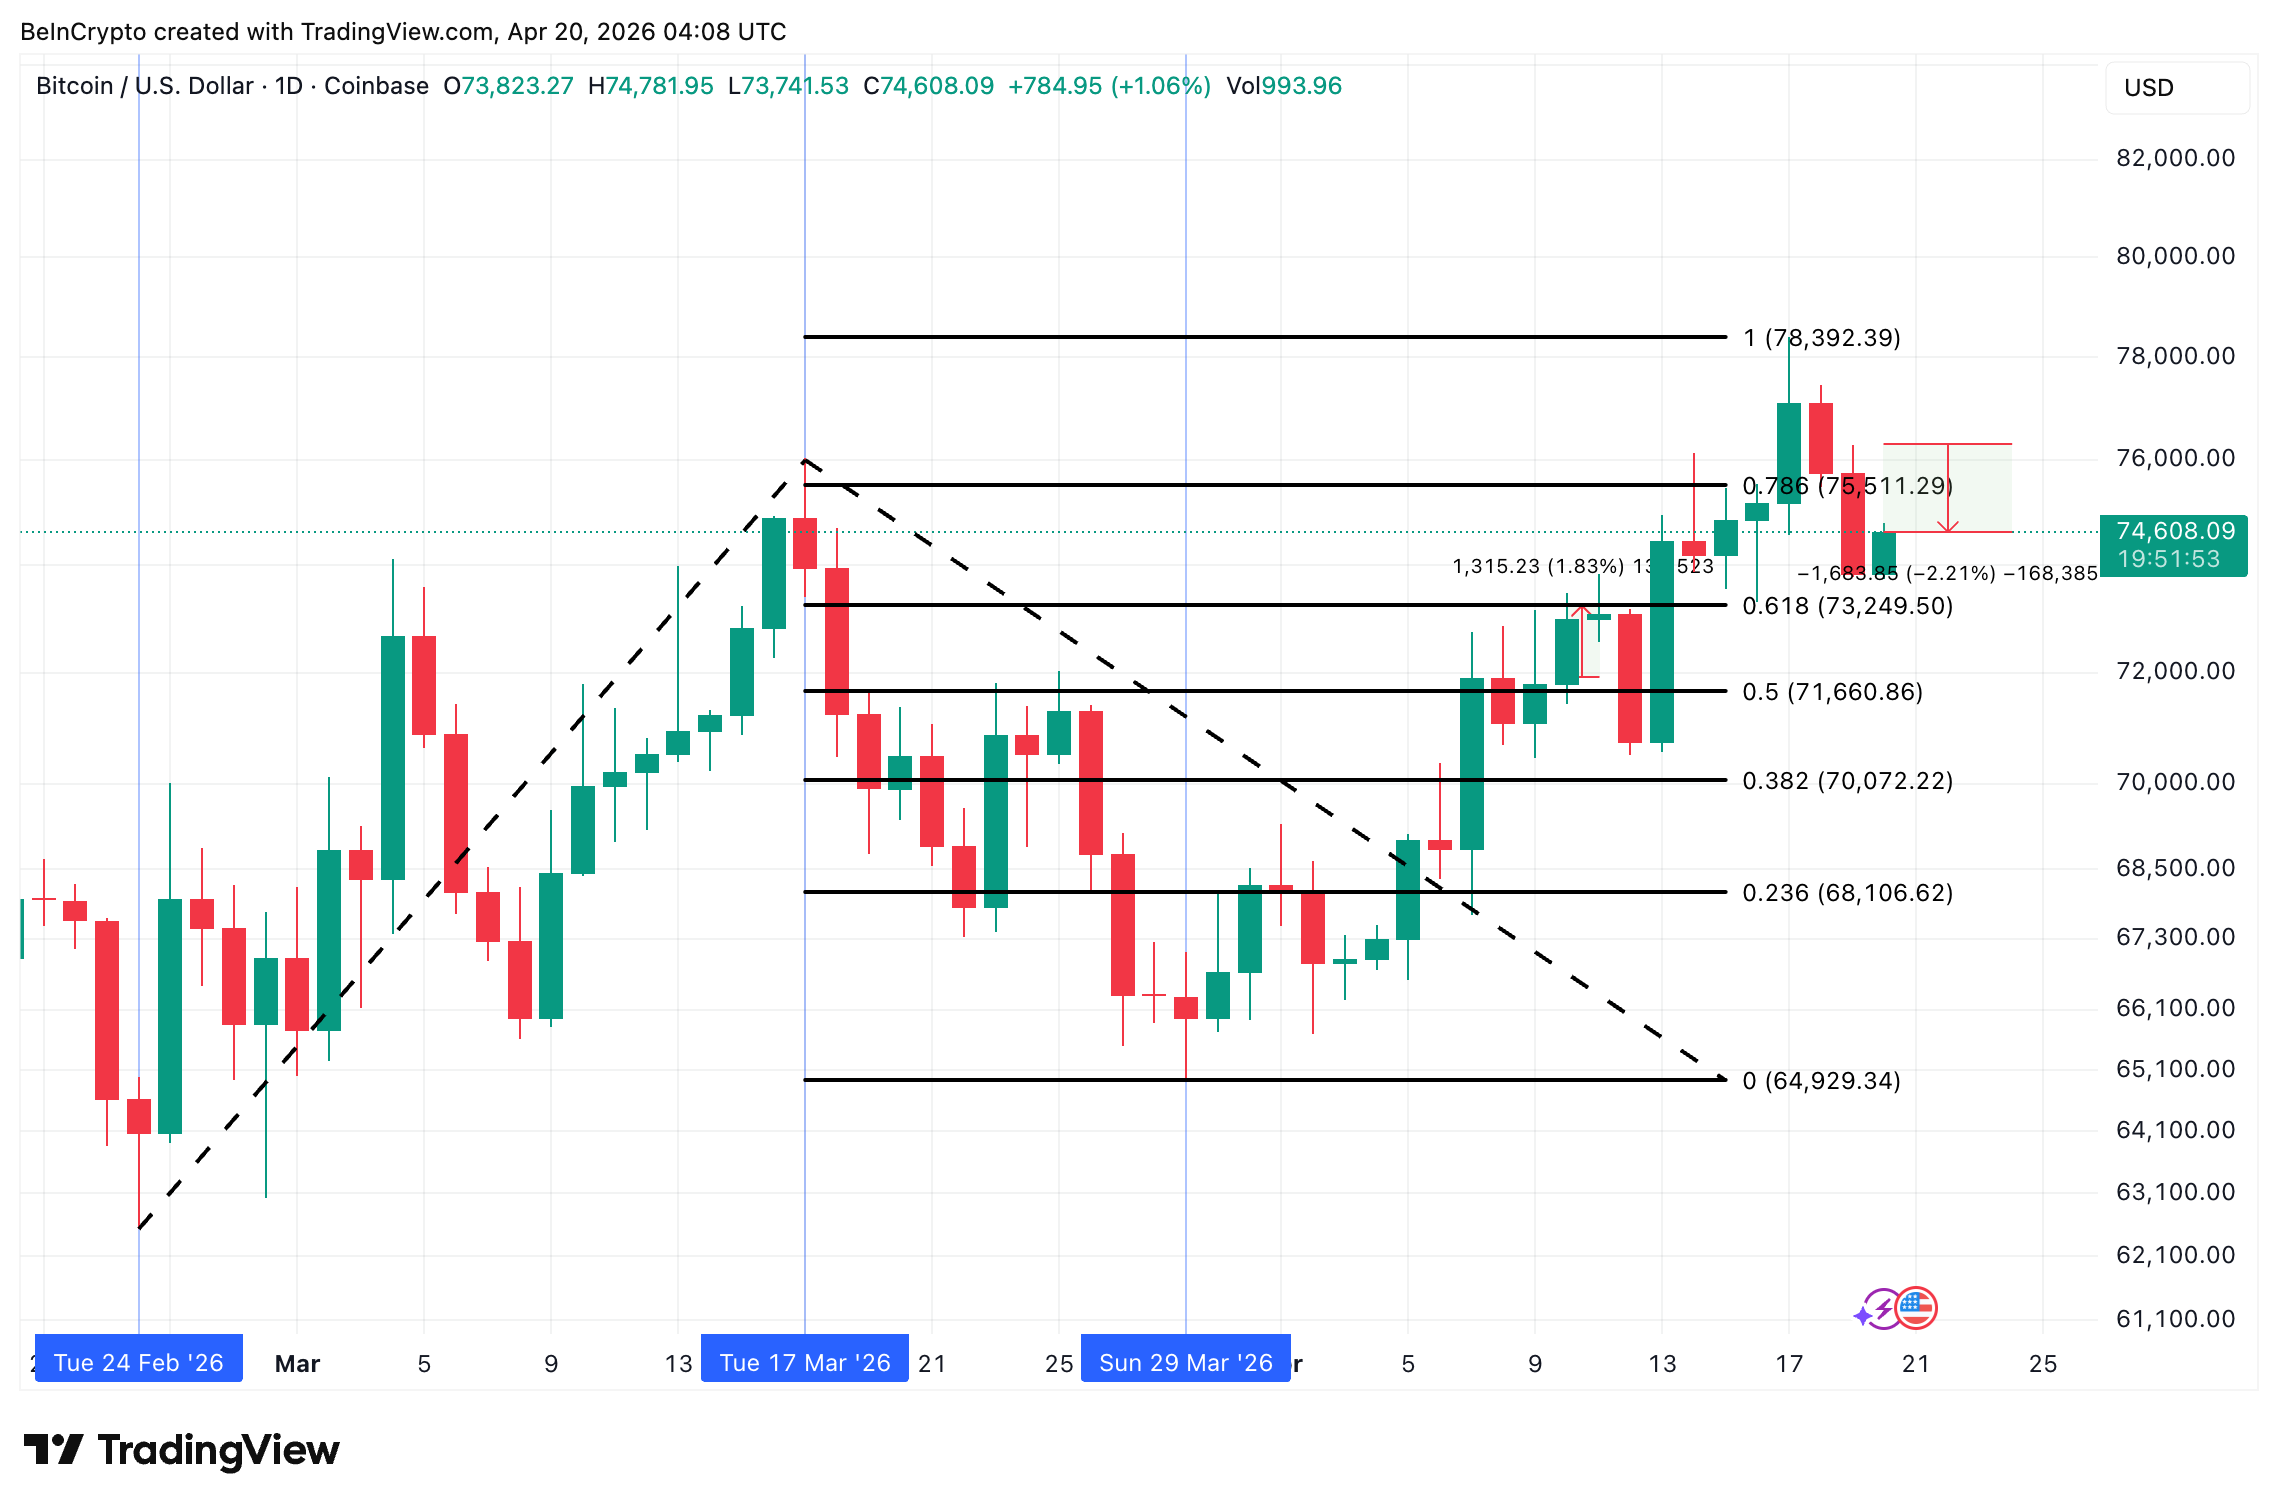
Bitcoin price trades near $74,608, down 2.21% from yesterday’s high. BTC tested $78,392 last week, a trend-based Fibonacci extension from the February 24 swing low. The level ties the March 17 high to the March 29 retracement. Price failed at that exact zone.
BTC has since lost the $75,511 support, the 0.786 Fibonacci, and now sits just above $73,249, the 0.618 Fibonacci. That floor aligns with the TOTAL market cap’s own 0.618 support, tying both levels into the same decision point.
 Bitcoin Price Analysis: TradingView
The drop coincides with the weekend’s US-Iran incident. The USS Spruance boarded the Iranian cargo ship Touska on Sunday after six hours of unheeded stop orders. Tehran pledged a response against US naval forces, and crude futures jumped on the escalation.
If $73,249 breaks, $70,072 and $68,106 come into focus.
Wednesday’s ceasefire deadline adds another layer of pressure, with Trump threatening strikes on Iran’s power grid if talks stall.
MemeCore Consolidates After 299% Rally
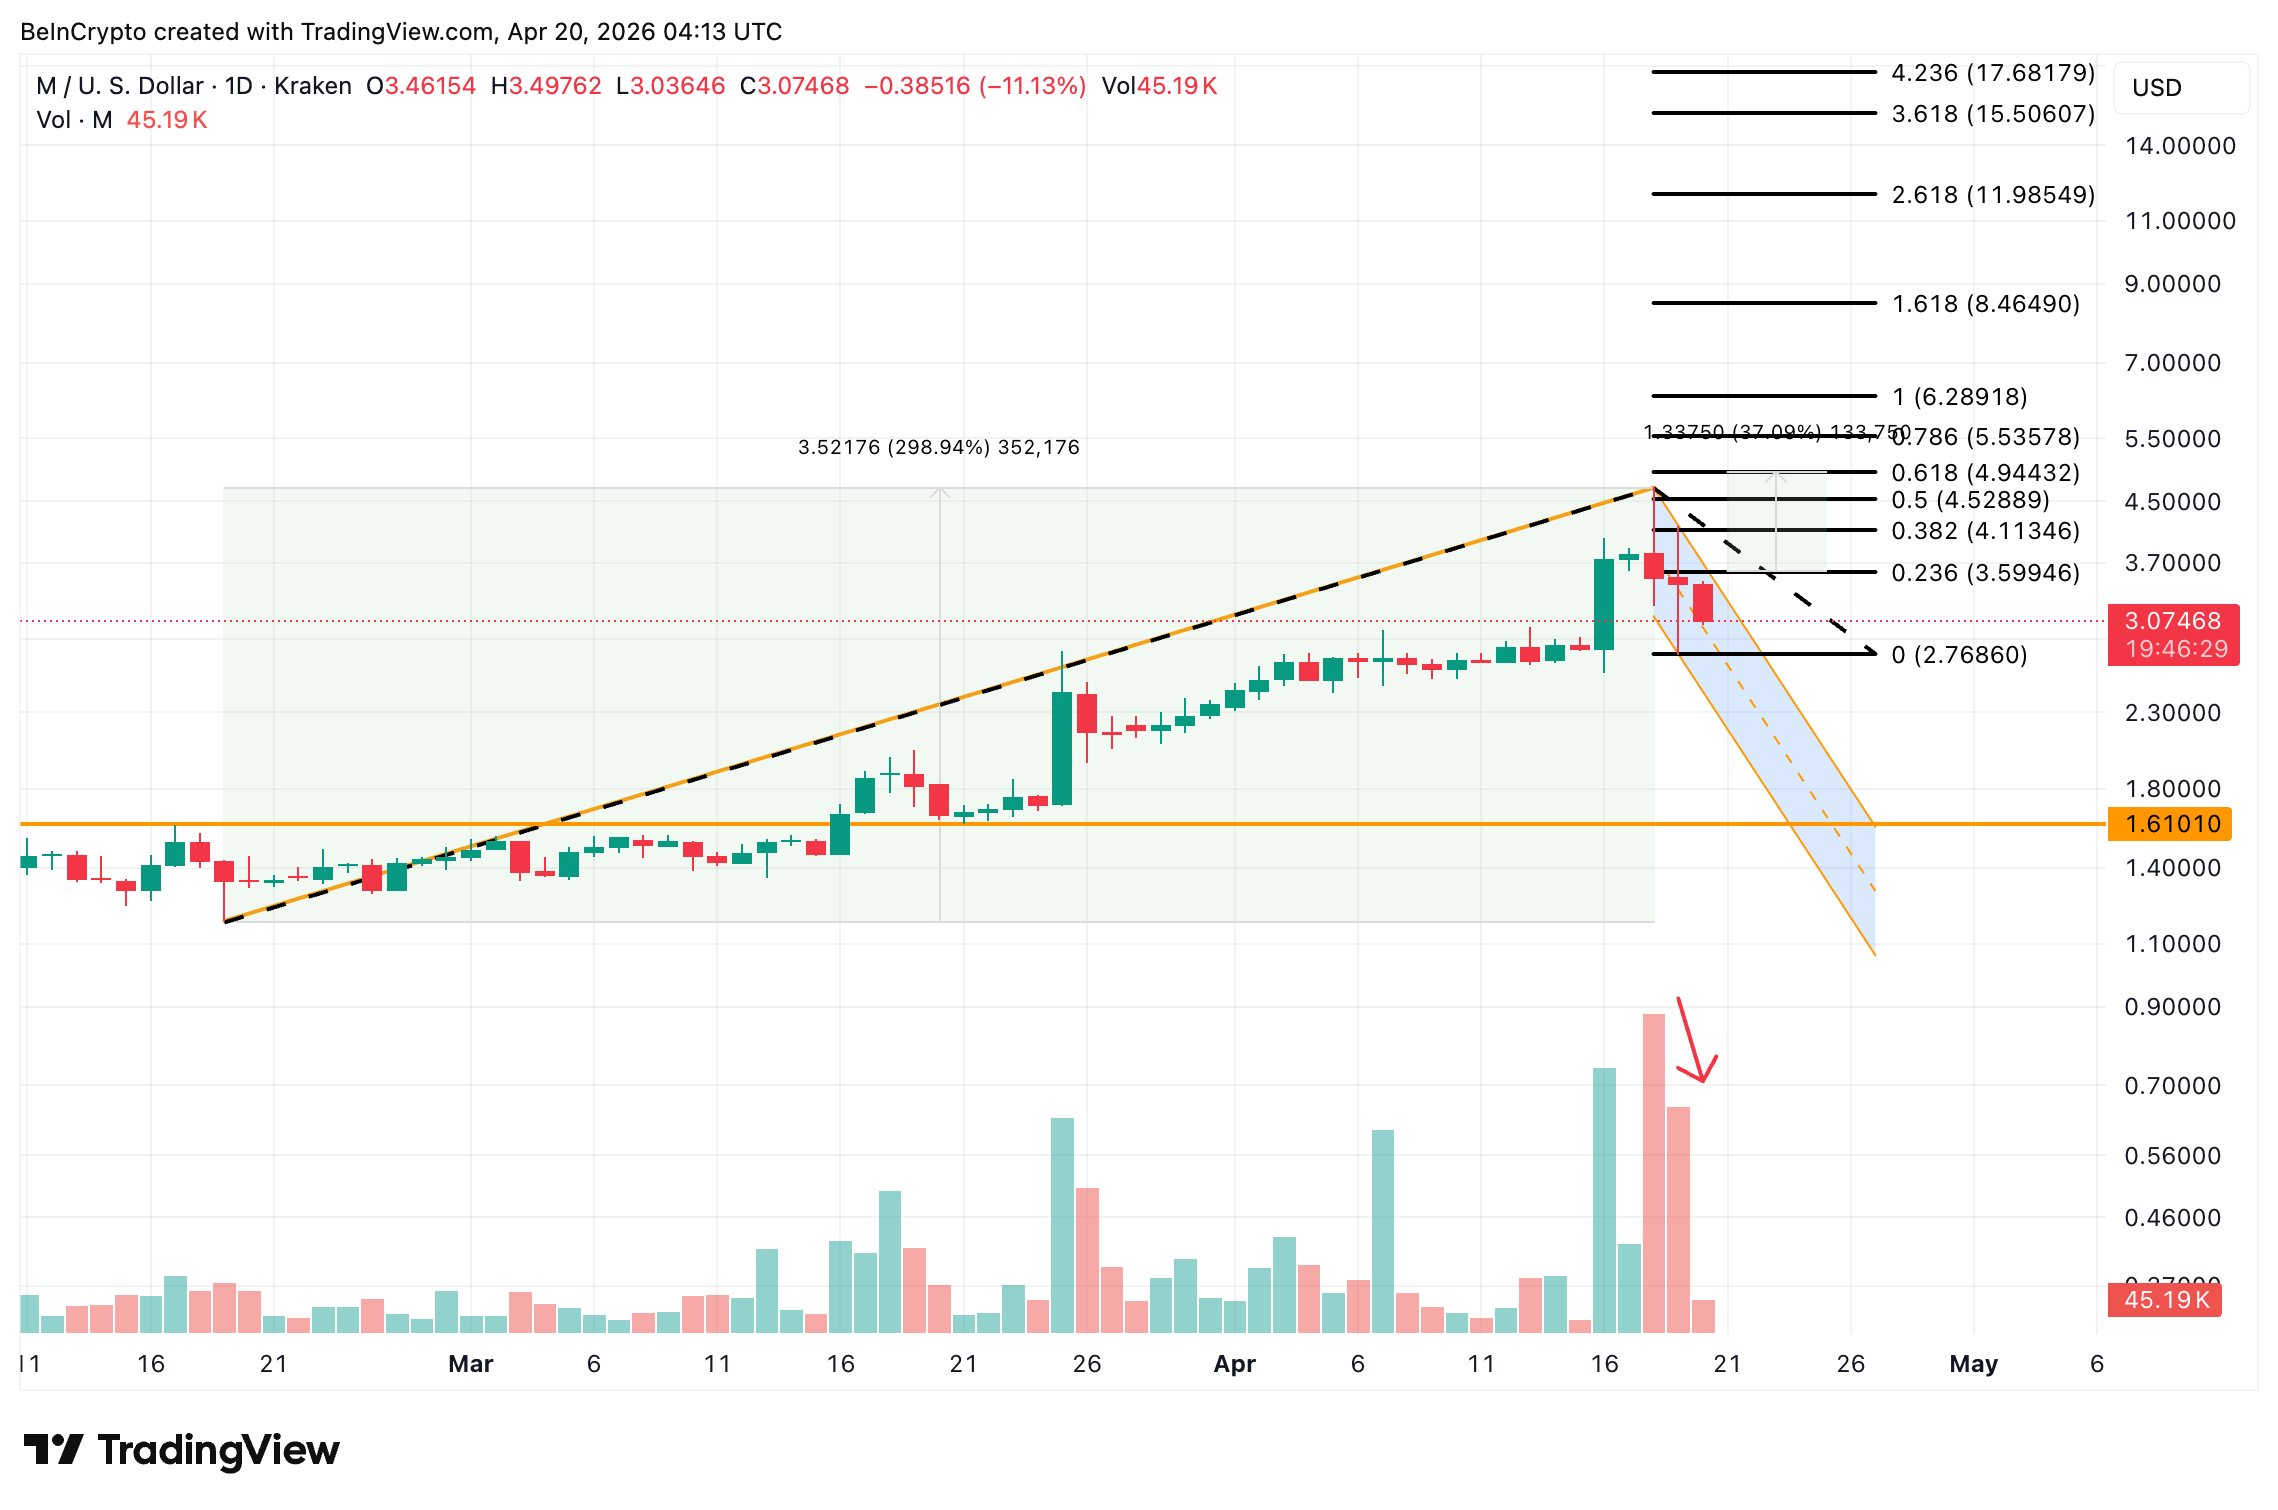
MemeCore (M) trades at $3.07, down 9% on the day, making it today’s worst performer among the top 20 coins. However, the selling is taking place inside a textbook bull flag formation.
Between February 19 and April 18, M rallied 299%. Since the peak, price has pulled back into a consolidation channel. Importantly, volume on the red candles has started fading, which is typical of bull flag formations before upside resolution.
 MemeCore Price Analysis: TradingView
The weakness aligns with the broader crypto market’s rejection near the upper channel.
M needs a move above $3.59, the 0.236 Fibonacci, to break the flag upward. The next hurdle sits at $4.94, a 37% projected move. However, a loss of $2.76 weakens the pattern, and a break below $1.61 invalidates the bullish thesis entirely.
0
0


 Manage all your crypto, NFT and DeFi from one place
Securely connect the portfolio you’re using to start.


0
0
