Ethereum Price Clings to $2,168 as Foundation Leads a 3-Front Selloff

0
0

Ethereum (ETH) price trades at $2,181 on April 9, sitting just 0.5% above a critical technical level while facing coordinated selling pressure from three directions.
The Ethereum Foundation, spot ETF holders, and whales are all reducing exposure simultaneously. Meanwhile, two key moving averages on the daily chart are converging toward a bullish crossover. The combination puts the Ethereum price in its most conflicting position yet, in April.
Symmetrical Triangle Tightens as Two EMAs Close In
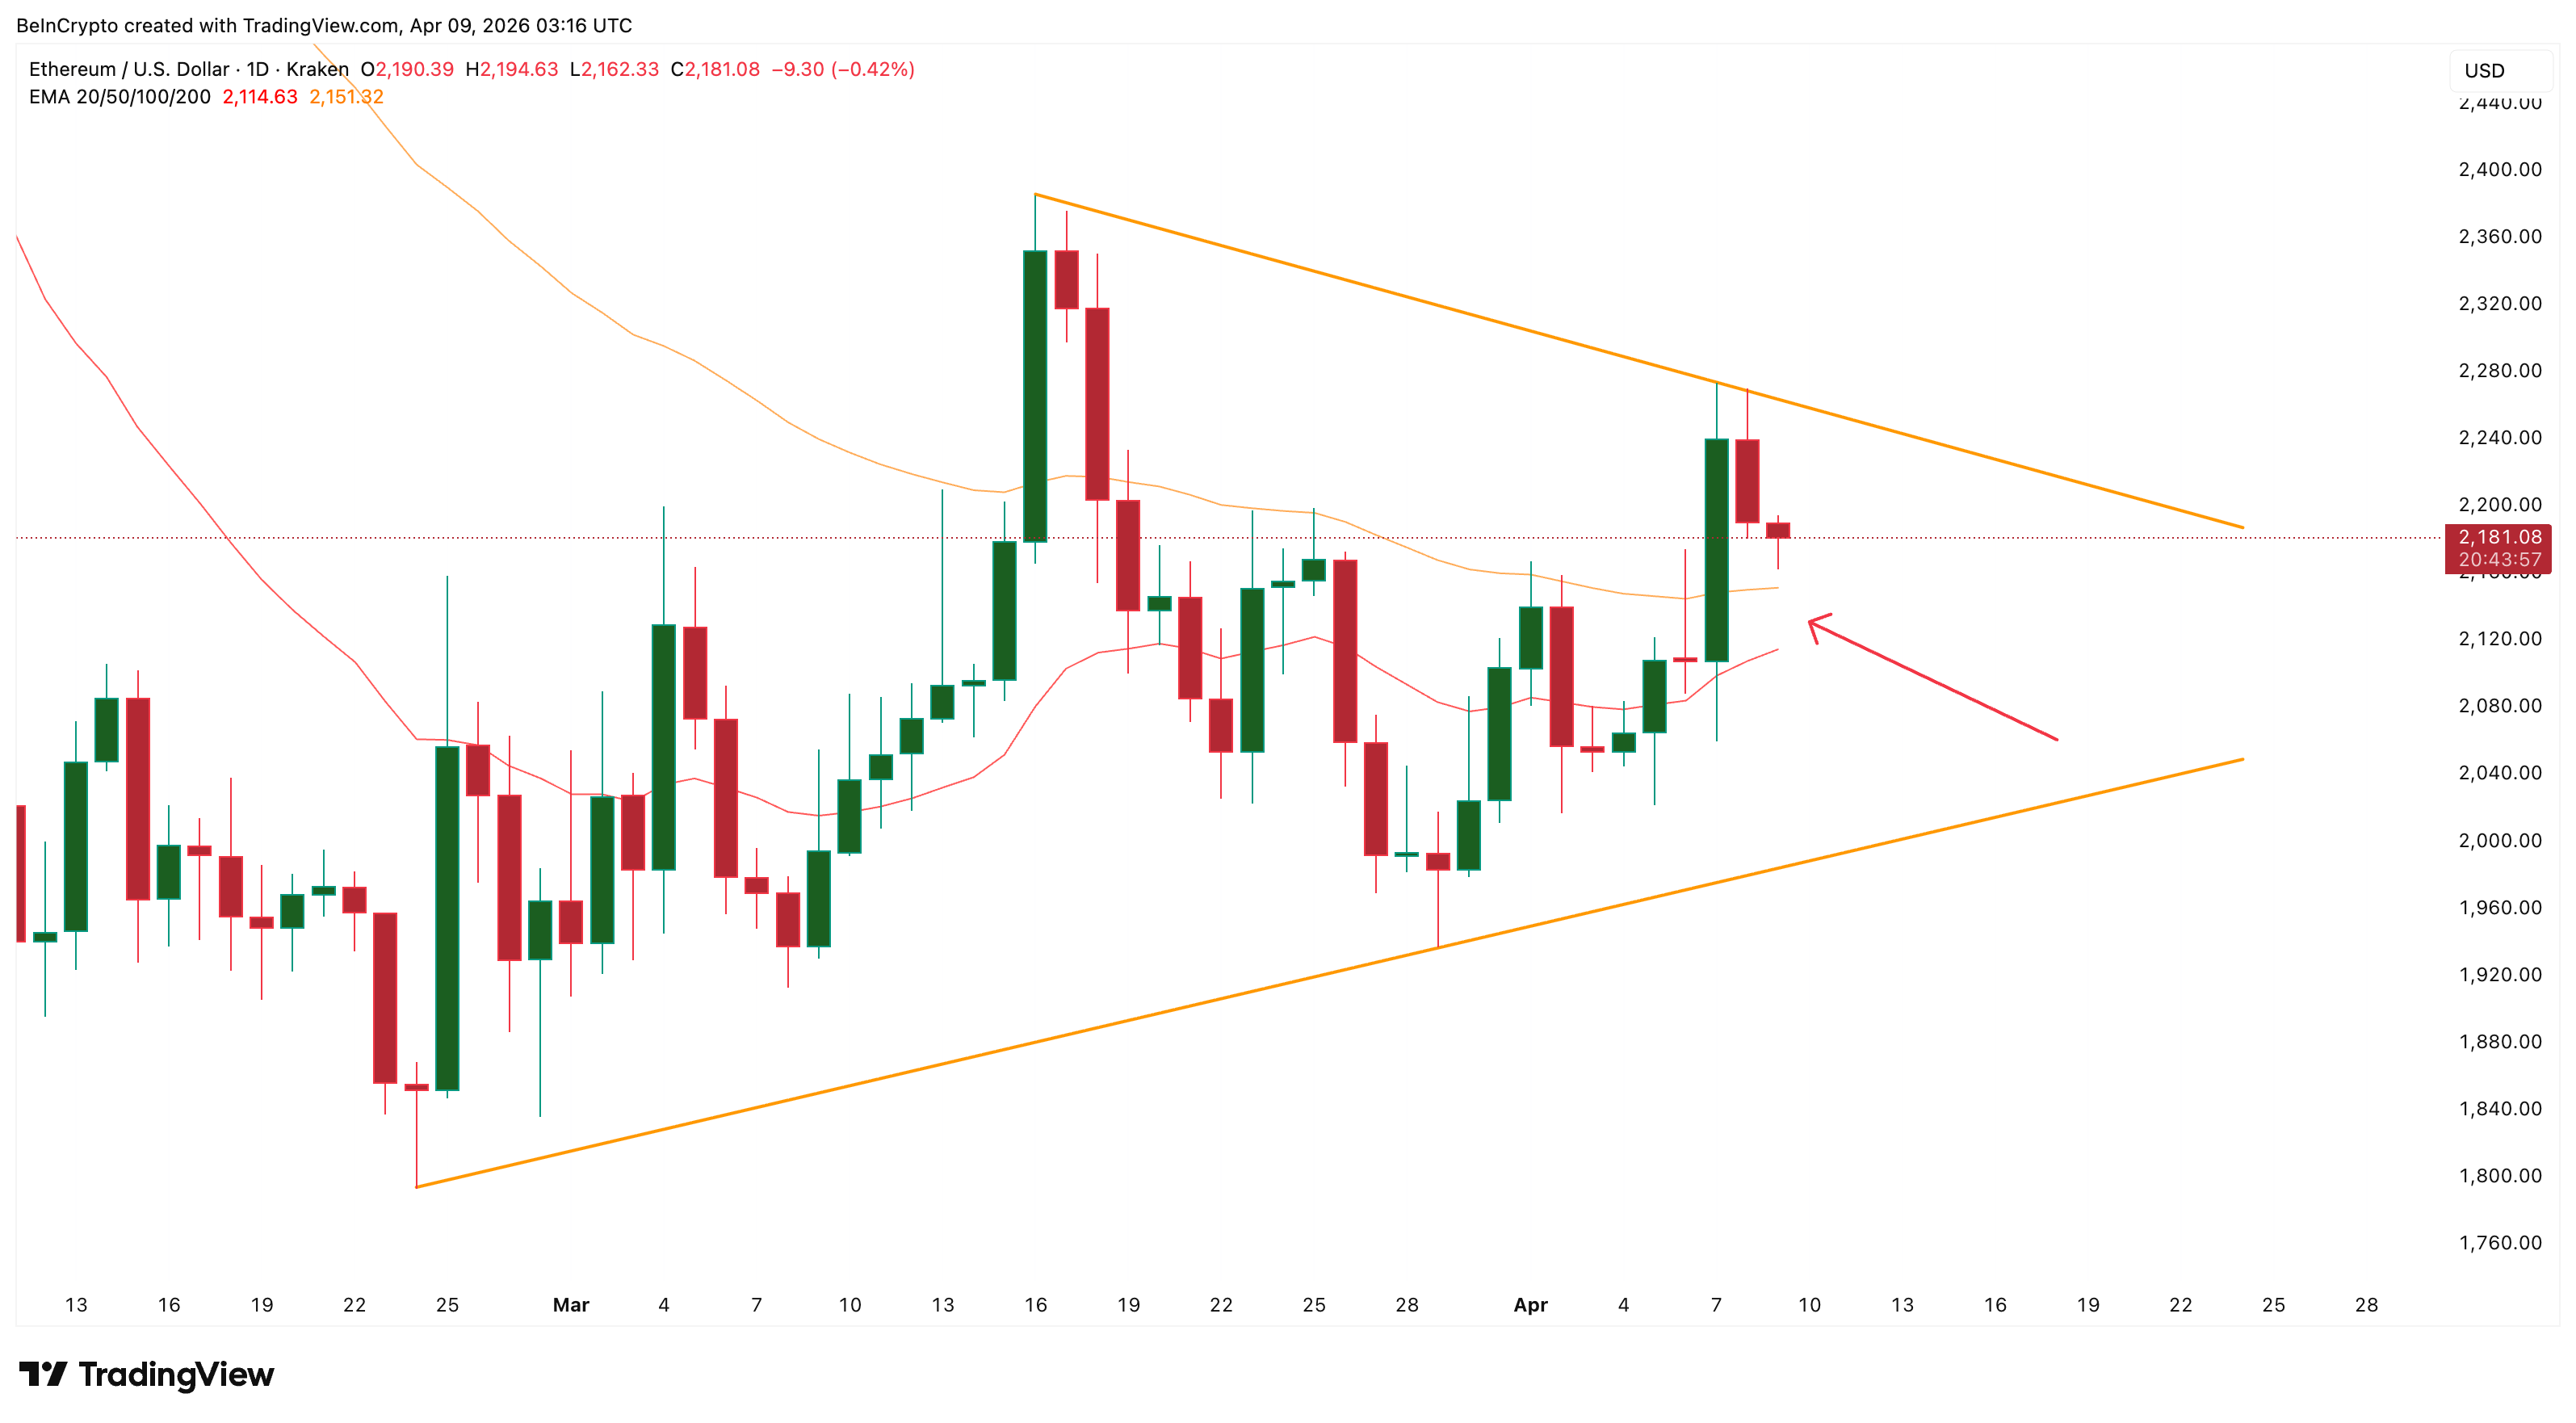
Ethereum price has been trading inside a symmetrical triangle on the daily chart since late February. The pattern has compressed price between a series of lower highs and higher lows, squeezing the range tighter with each session.
The most recent test of the upper trendline was rejected. Sellers defended that level aggressively, pushing ETH back toward the middle of the triangle. The rejection matters because it confirms the pattern is still intact and no breakout has occurred.
The 20-day Exponential Moving Average (EMA), a trend indicator that gives greater weight to recent price movements, sits at $2,114, still below the 50-day EMA at $2,151. The gap between them is narrowing. If the 20-day manages to cross above the 50-day, it would flash a golden cross and shift short-term momentum bullish.
However, with selling pressure mounting from three fronts, the risk is that the 20-day stalls and diverges back downward, a failed crossover attempt that would reinforce the bearish structure.
 Symmetrical Triangle EMAs: TradingView
Want more token insights like this? Sign up for Editor Harsh Notariya’s Daily Crypto Newsletter here.
A failed crossover attempt inside a tightening triangle would tilt the odds toward a downside breakdown. But the chart setup alone does not explain why ETH is under this much pressure. The selling is not just technical. It is structural.
Foundation, ETFs, and Whales All Reduce Exposure at Once
The sell pressure is arriving from three separate fronts simultaneously.
The Ethereum Foundation announced it would convert 5,000 ETH into stablecoins via CoWSwap’s TWAP feature to fund R&D, grants, and donations.
According to on-chain tracker Lookonchain, 3,750 ETH worth $8.3 million has already been sold at an average price of $2,214. Another 1,250 ETH, worth approximately $2.77 million, remains earmarked for conversion. The Foundation’s own announcement framed the sale as routine treasury management, but the market reads any large sell from the project’s creator as a bearish signal regardless of intent.
The ETF picture flipped just as fast. US spot ETH ETF flows recorded a strong inflow of 38,769 ETH on April 6. One day later, April 7 saw an outflow of 24,311 ETH. The reversal erased most of the previous session’s institutional demand in a single day.
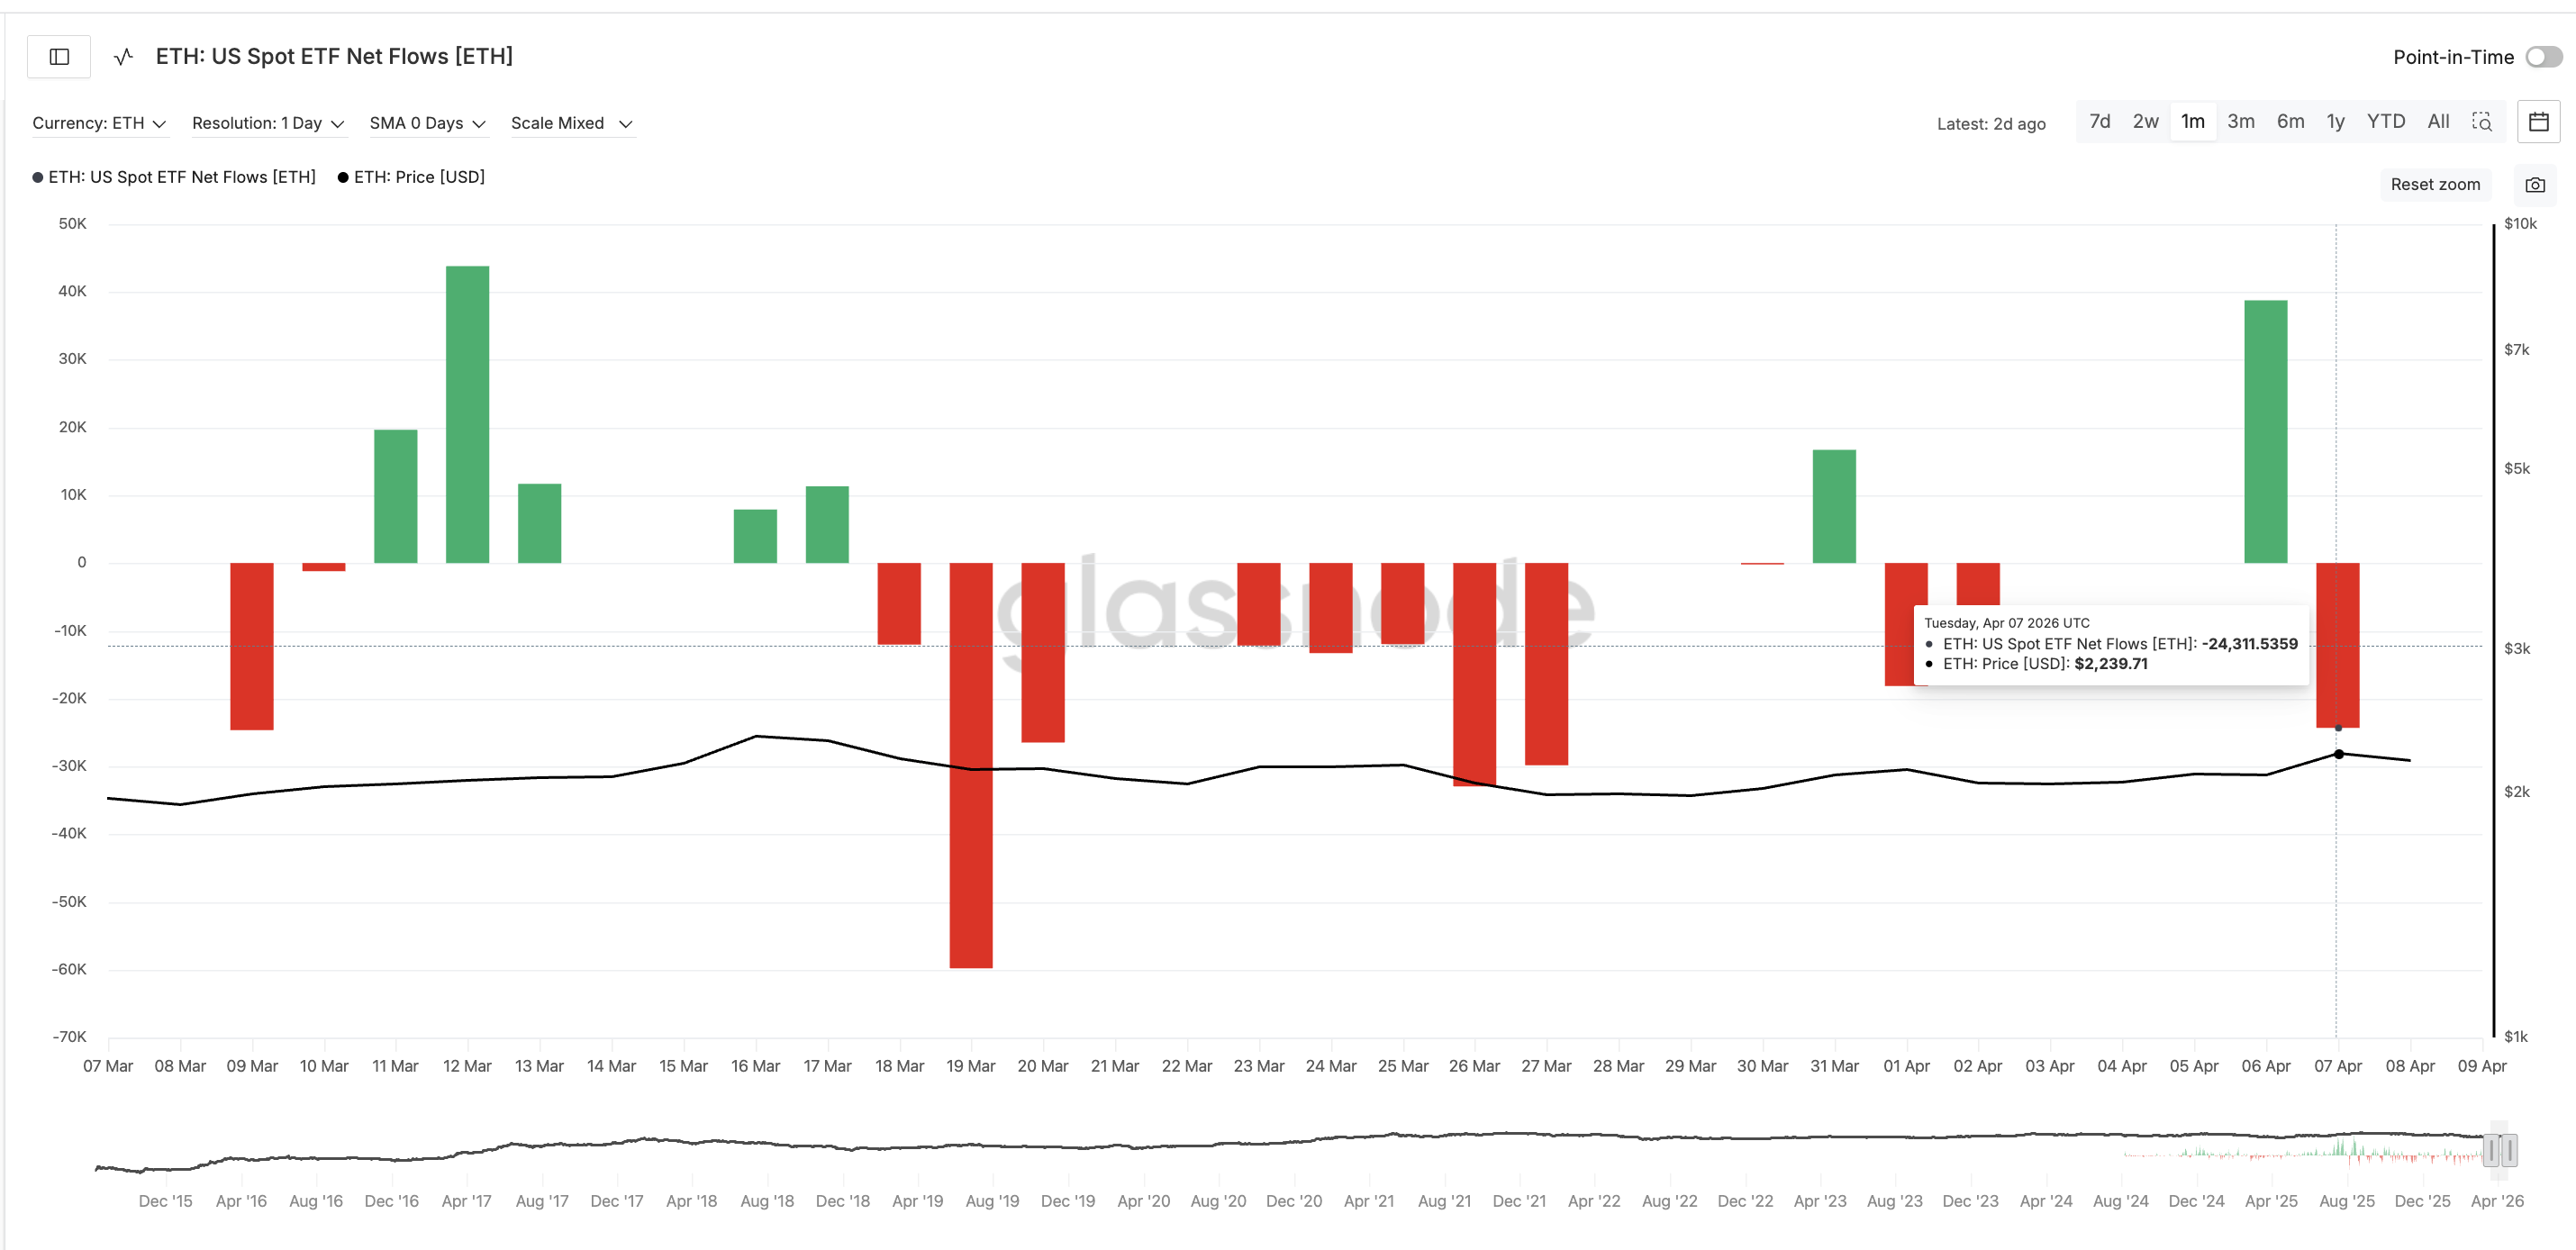 ETH Spot ETF Net Flows: Glassnode
Whale behavior adds the third layer.
According to Santiment data, the supply held by whales outside of exchanges peaked at approximately 123 million ETH around April 8 and has since dropped to 122.93 million, roughly $153 million. The decline appears modest in absolute terms, but the timing matters. Whales began reducing holdings around the same time the Foundation started selling and ETF flows reversed.
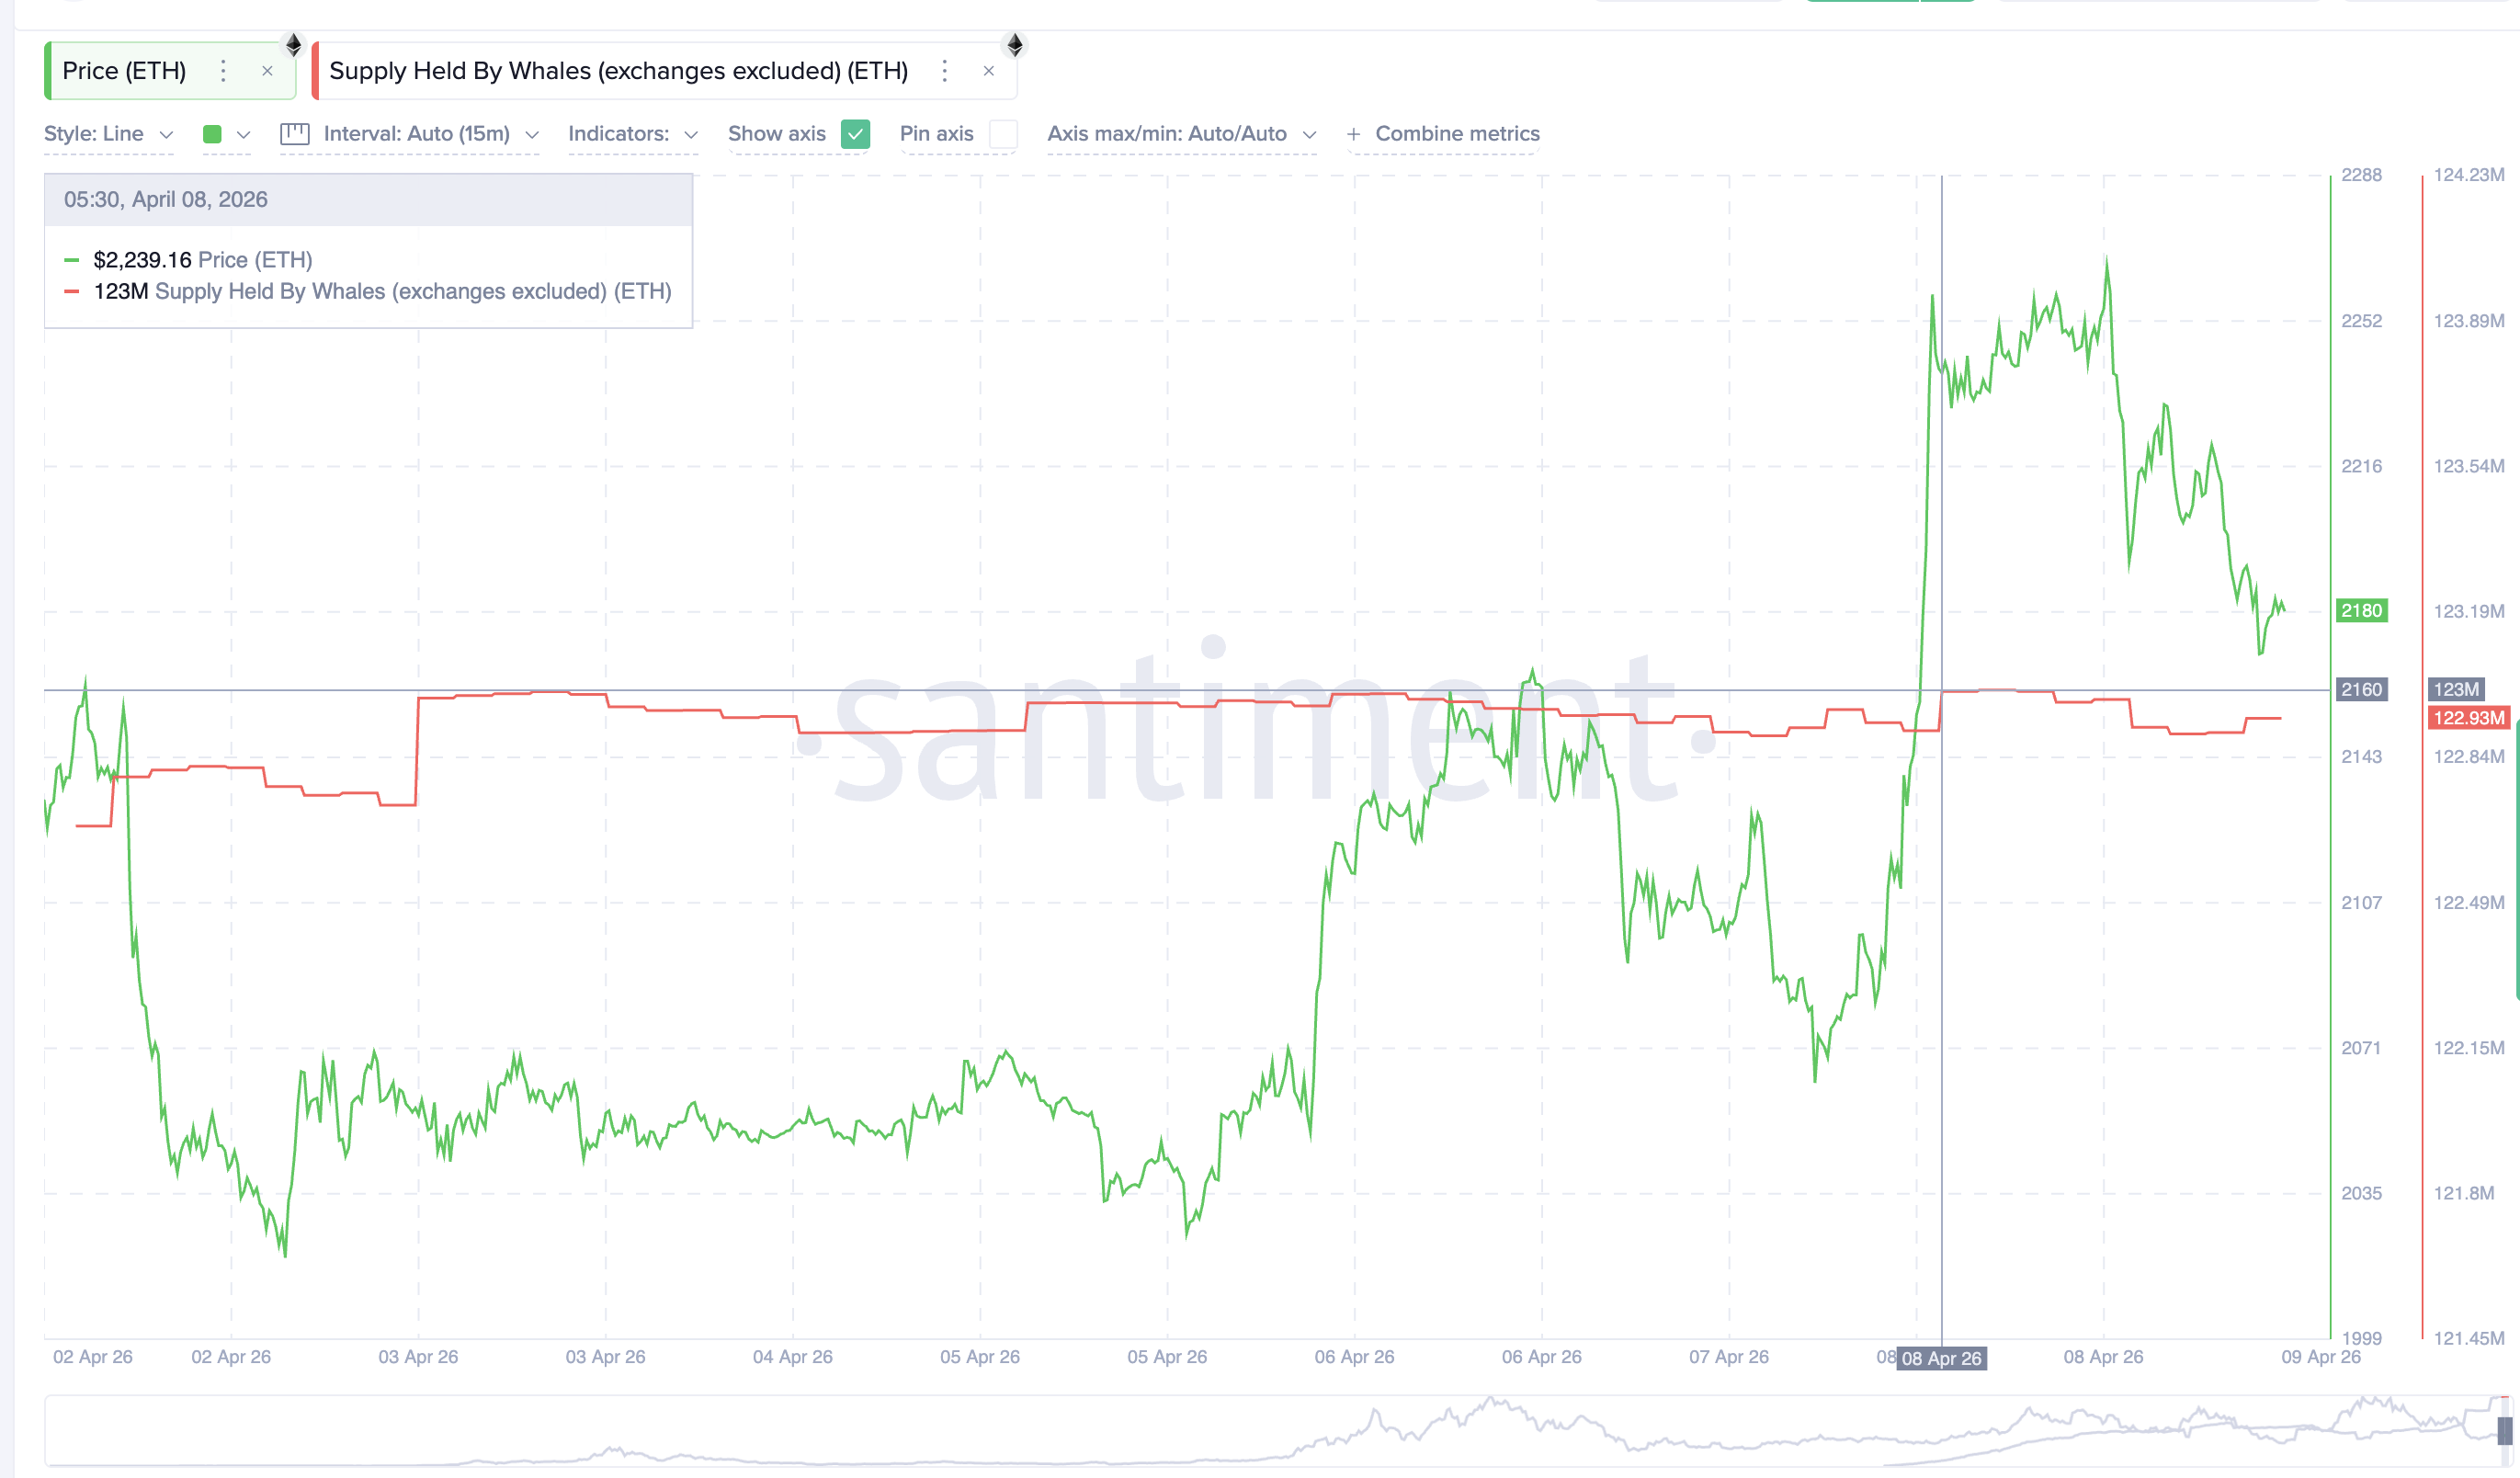 Whale Supply: Santiment
When three independent groups, the Foundation, ETF holders, and whales, all reduce exposure within the same 48-hour window, it creates a supply overhang that technical patterns alone cannot absorb. The ETH price chart now decides how much of this pressure the market can handle.
Ethereum Price Sits 0.5% Above the Level That Changes Everything
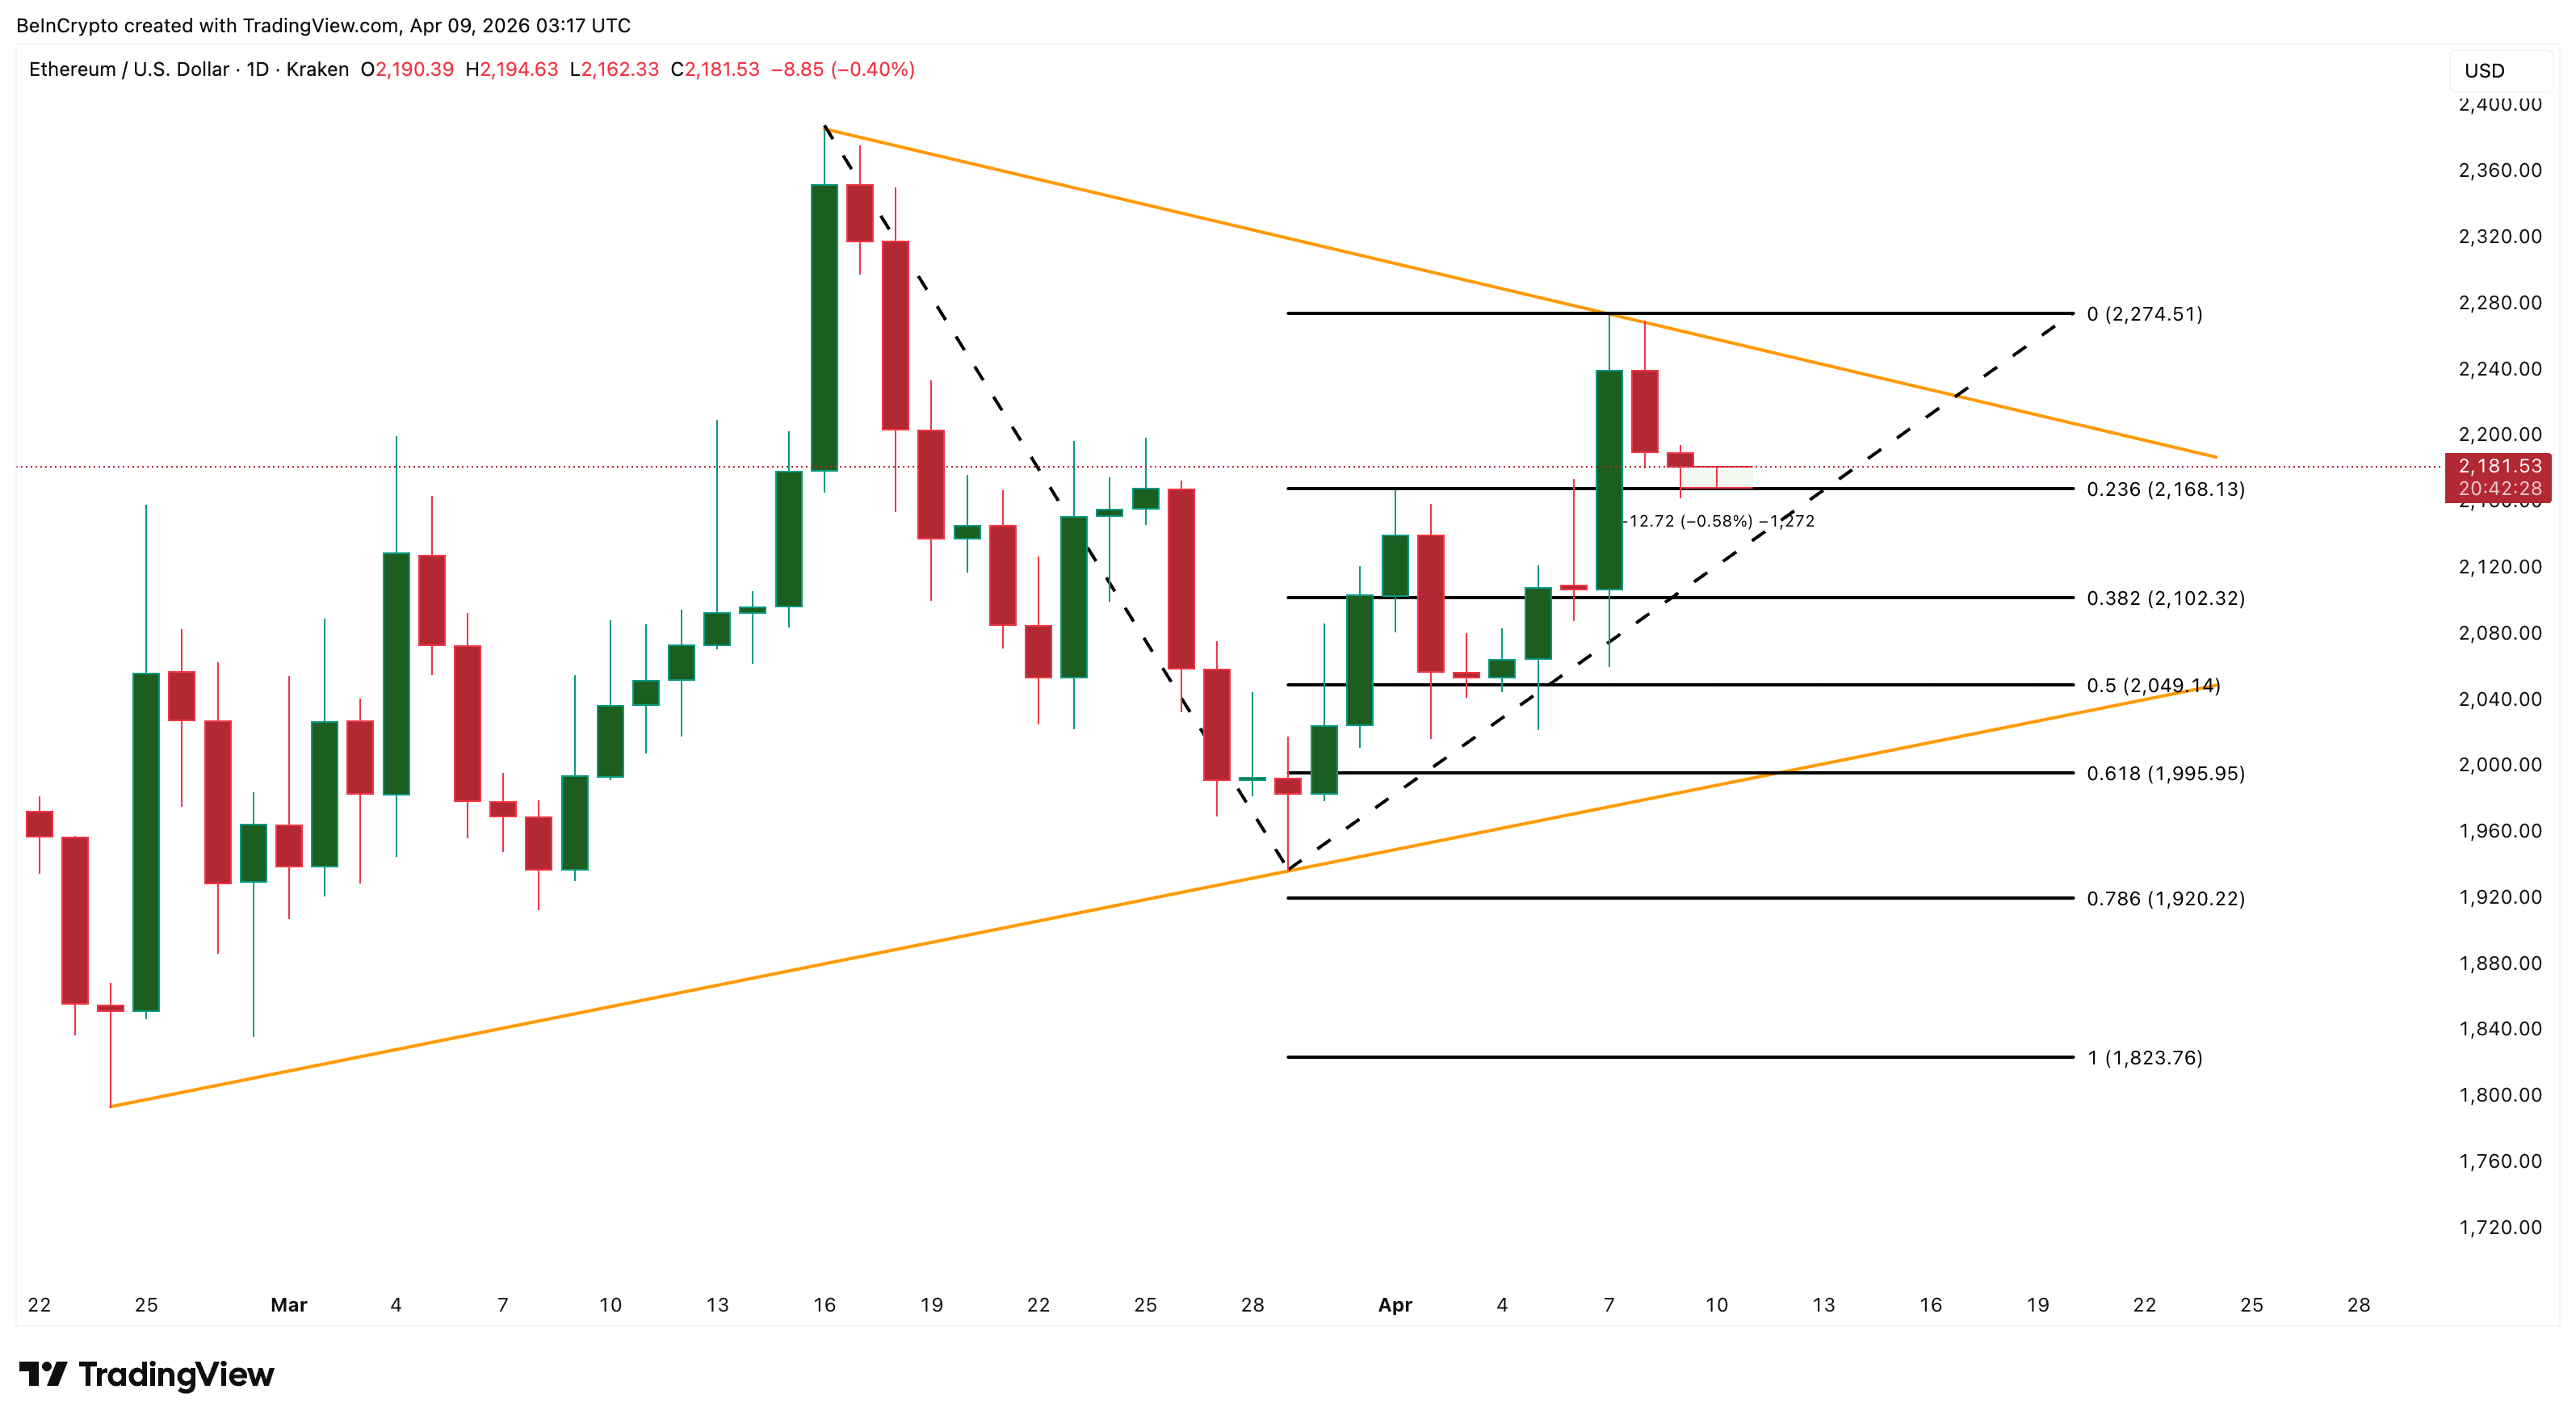
ETH trades at $2,181, just 0.5% above the 0.236 Fibonacci level of $2,168. This is the line that matters most right now. A daily close below $2,168 would confirm that the selling pressure from all three fronts is overwhelming dip buyers and would place ETH firmly in the lower half of the triangle.
Below $2,168, the next supports are $2,102 at the 0.382 level and $2,049 at the 0.5 level. A drop below $1,995 at the 0.618 level would bring the lower trendline of the symmetrical triangle into direct focus, raising the risk of a breakdown toward $1,823.
Ethereum price did briefly dip below $2,168 during the session before buying pressure helped it reclaim the level. That reclaim shows buyers are aware of the line. However, a second test with the EMA golden cross still unconfirmed and the Foundation still holding 1,250 ETH to sell may not hold as well. The broader market weakness adds another headwind.
 ETH Price Analysis: TradingView
For strength to return, ETH needs to stay above $2,168 and attempt a move back toward $2,274. That would push price back toward the upper trendline and could help confirm the crossover. However, with three selling cohorts active and no fresh demand catalyst visible, the upside path remains the harder one.
Currently, $2,168 separates a defended floor with a path back toward $2,274 from a three-front-driven slide toward $2,102 and lower.
0
0


 Manage all your crypto, NFT and DeFi from one place
Securely connect the portfolio you’re using to start.

0
0

0
0

0
0
