Is Solana Primed for a Rally? Analyzing SOL’s Breakout and What’s Next for Its Price

0
0


Solana faced intense selling pressure after reaching a new all-time high of $295.83 on January 19. This caused its price to trend within a falling wedge pattern as bears took control.
However, the recent market recovery has fueled a breakout above the upper trendline of this pattern, signaling a potential bullish reversal. Is SOL primed for a sustained rally?
SOL’s Price Surge Signals Weakened Selling Pressure
A falling wedge pattern emerges when an asset’s price moves within a narrowing downward-sloping range, characterized by lower highs and lower lows. While the price trends downward within the wedge, the narrowing range indicates weakening selling pressure, often leading to an upward breakout.
SOL completed its breakout on March 19 and has since climbed by 10%. When an asset breaks above a falling wedge pattern like this, selling pressure has weakened, and buyers are gaining control.
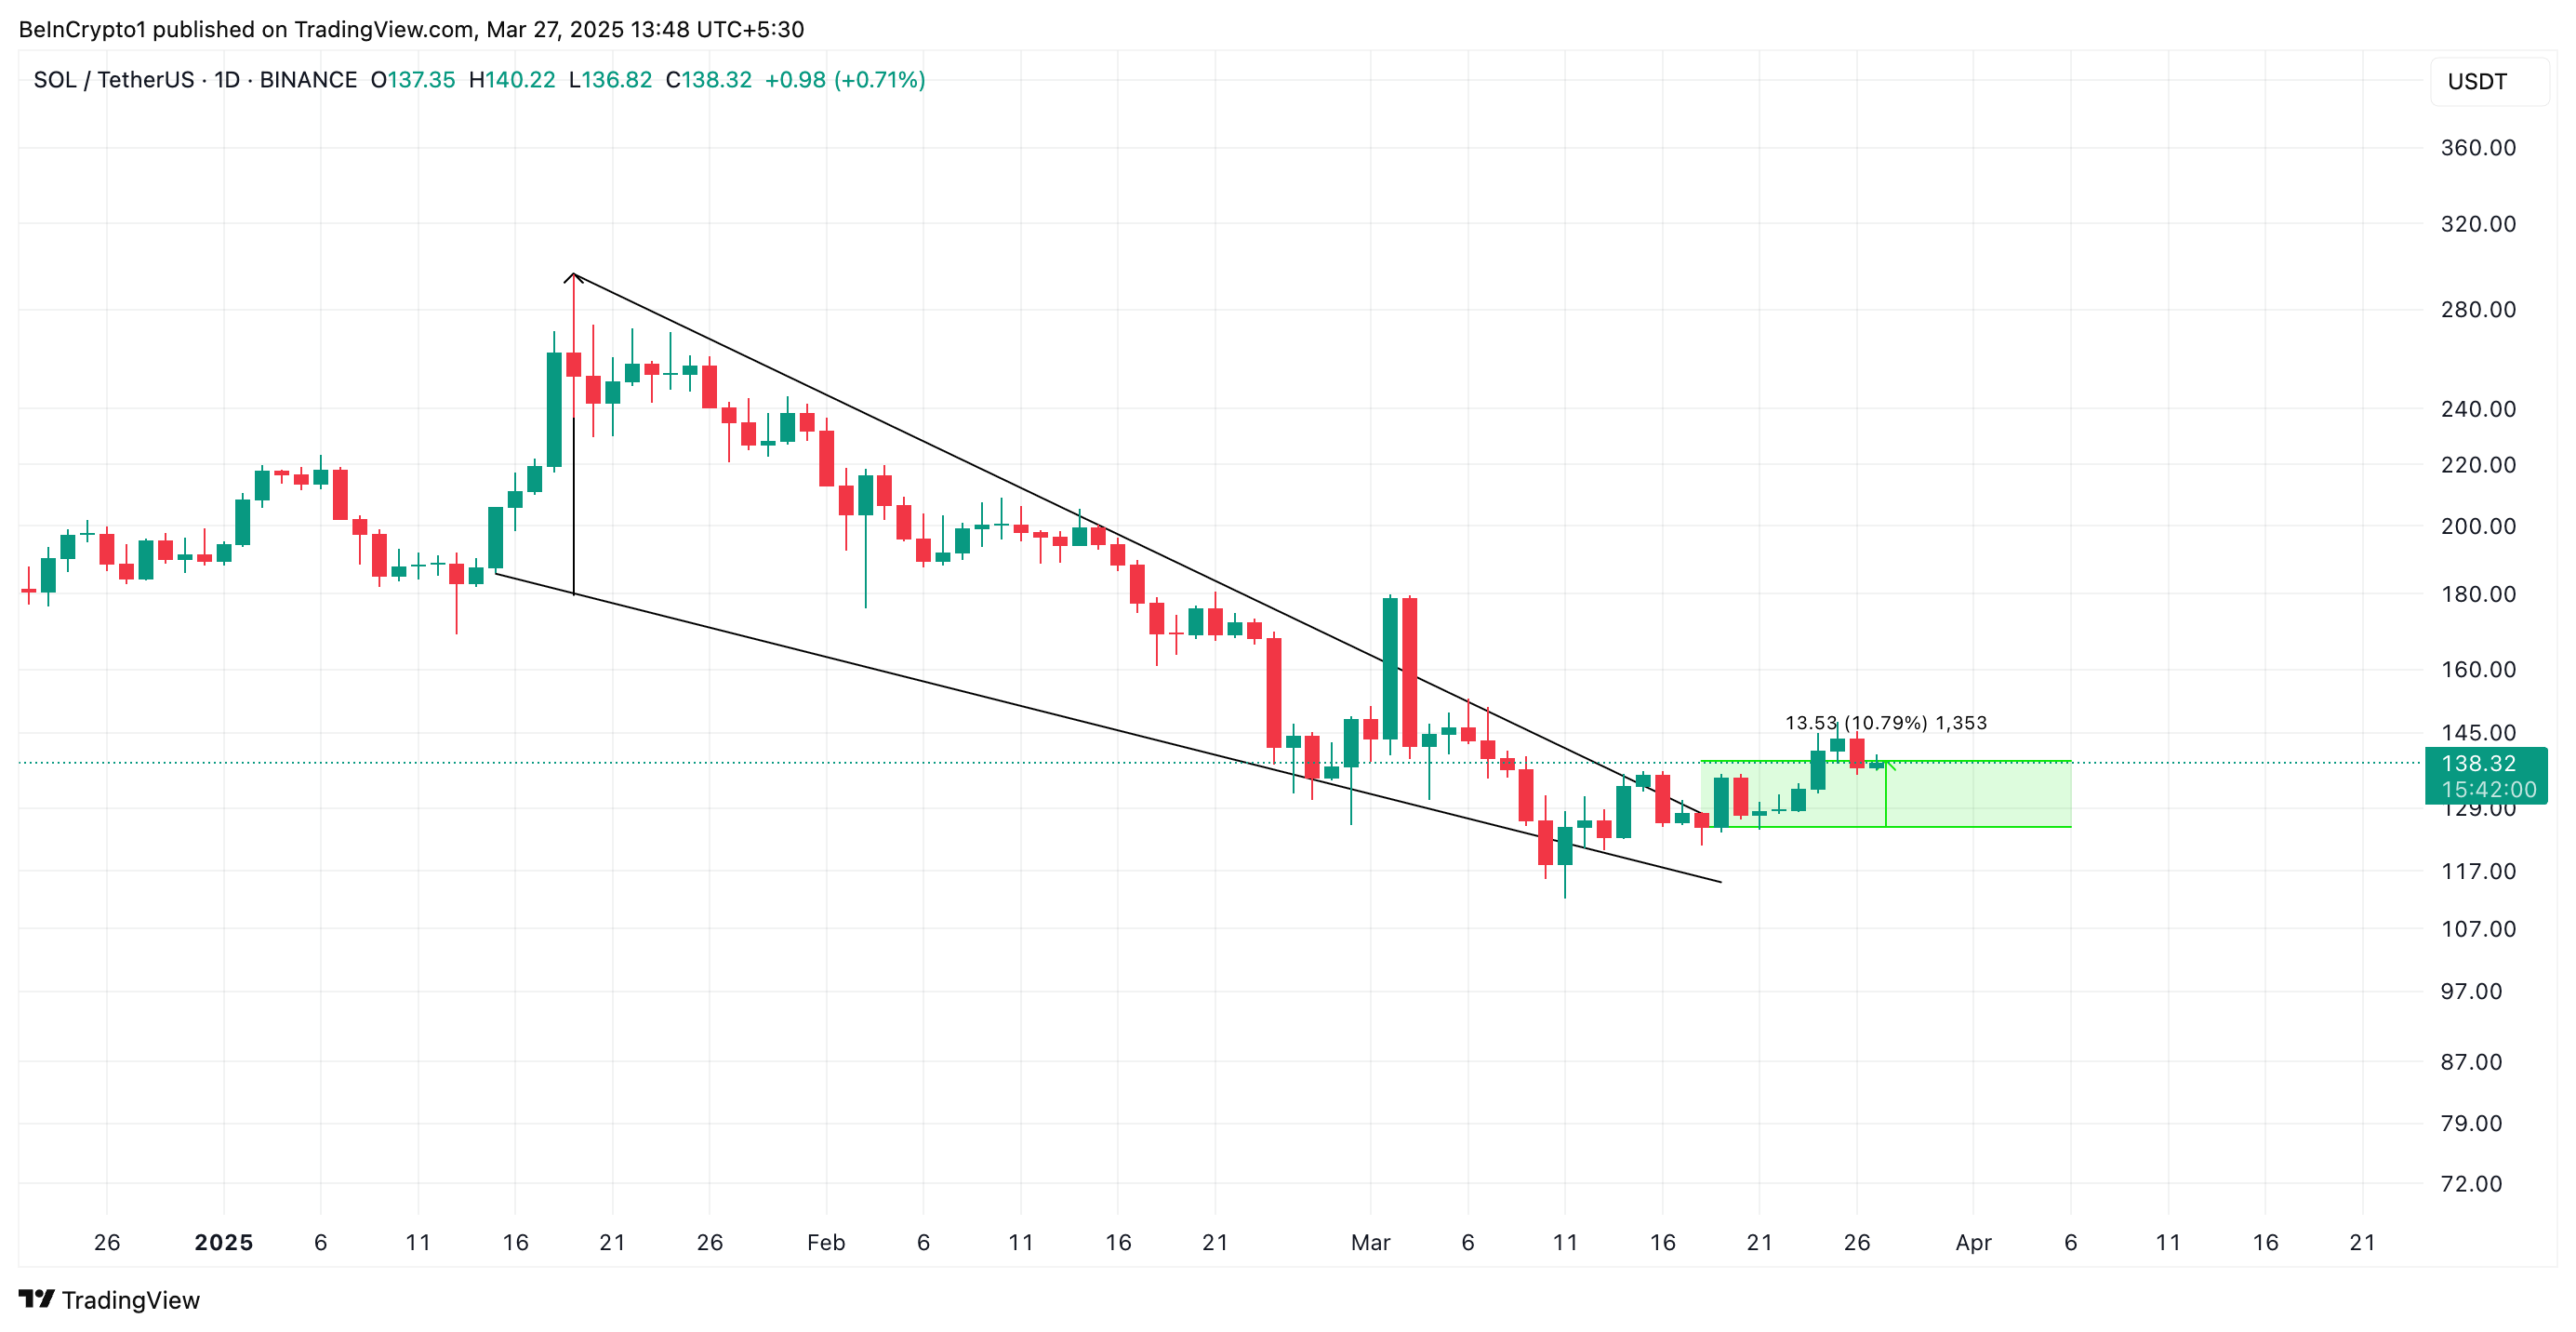 SOL Falling Wedge. Source: TradingView
This breakout is often accompanied by increased trading volume, confirming the possibility of a sustained uptrend. This is the case for SOL, as its rising open interest highlights the strong demand for the altcoin. It stands at $4.81 billion at press time, rallying 22% since the coin’s breakout.
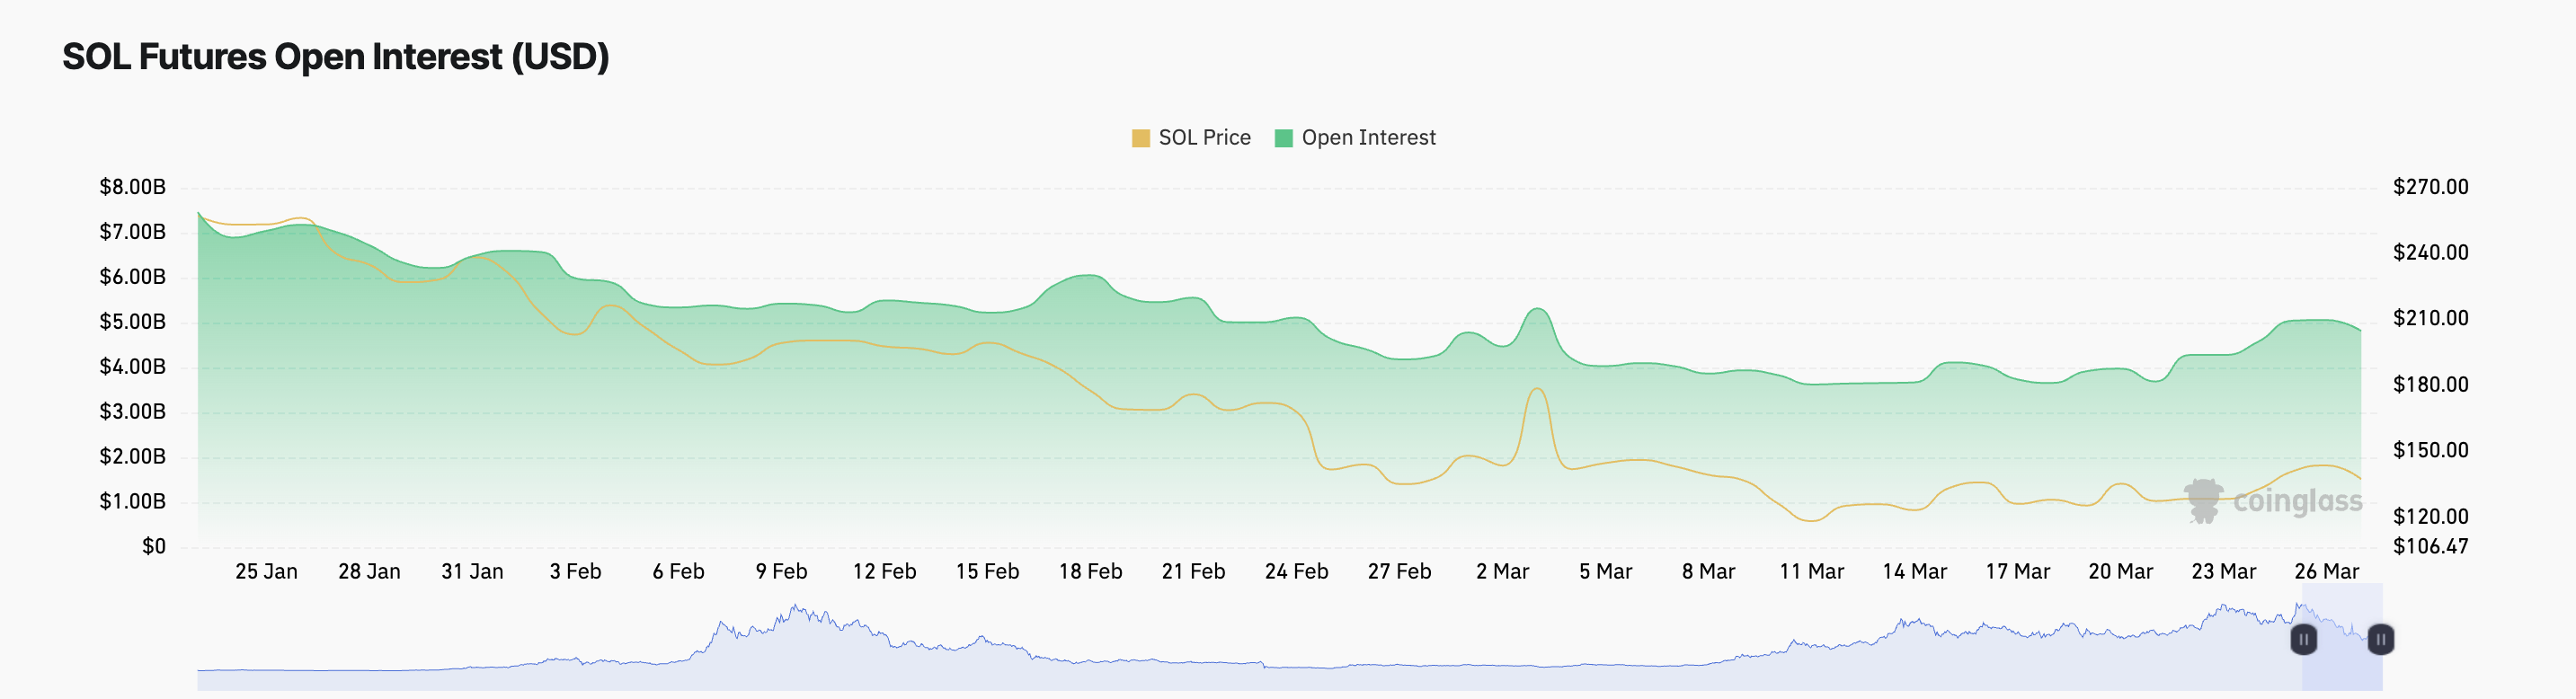 SOL Open Interest. Source: Coinglass
Open interest refers to the total number of outstanding derivative contracts, such as futures or options, that have not been settled. As with SOL, when open interest rises during a price rally, it signals increasing market participation and strong conviction among traders, reinforcing the momentum behind the uptrend.
Moreover, SOL’s Aroon Up Line confirms the strength of its current rally. At 85.71% at press time, the indicator signals a strong bullish presence in the altcoin’s market.
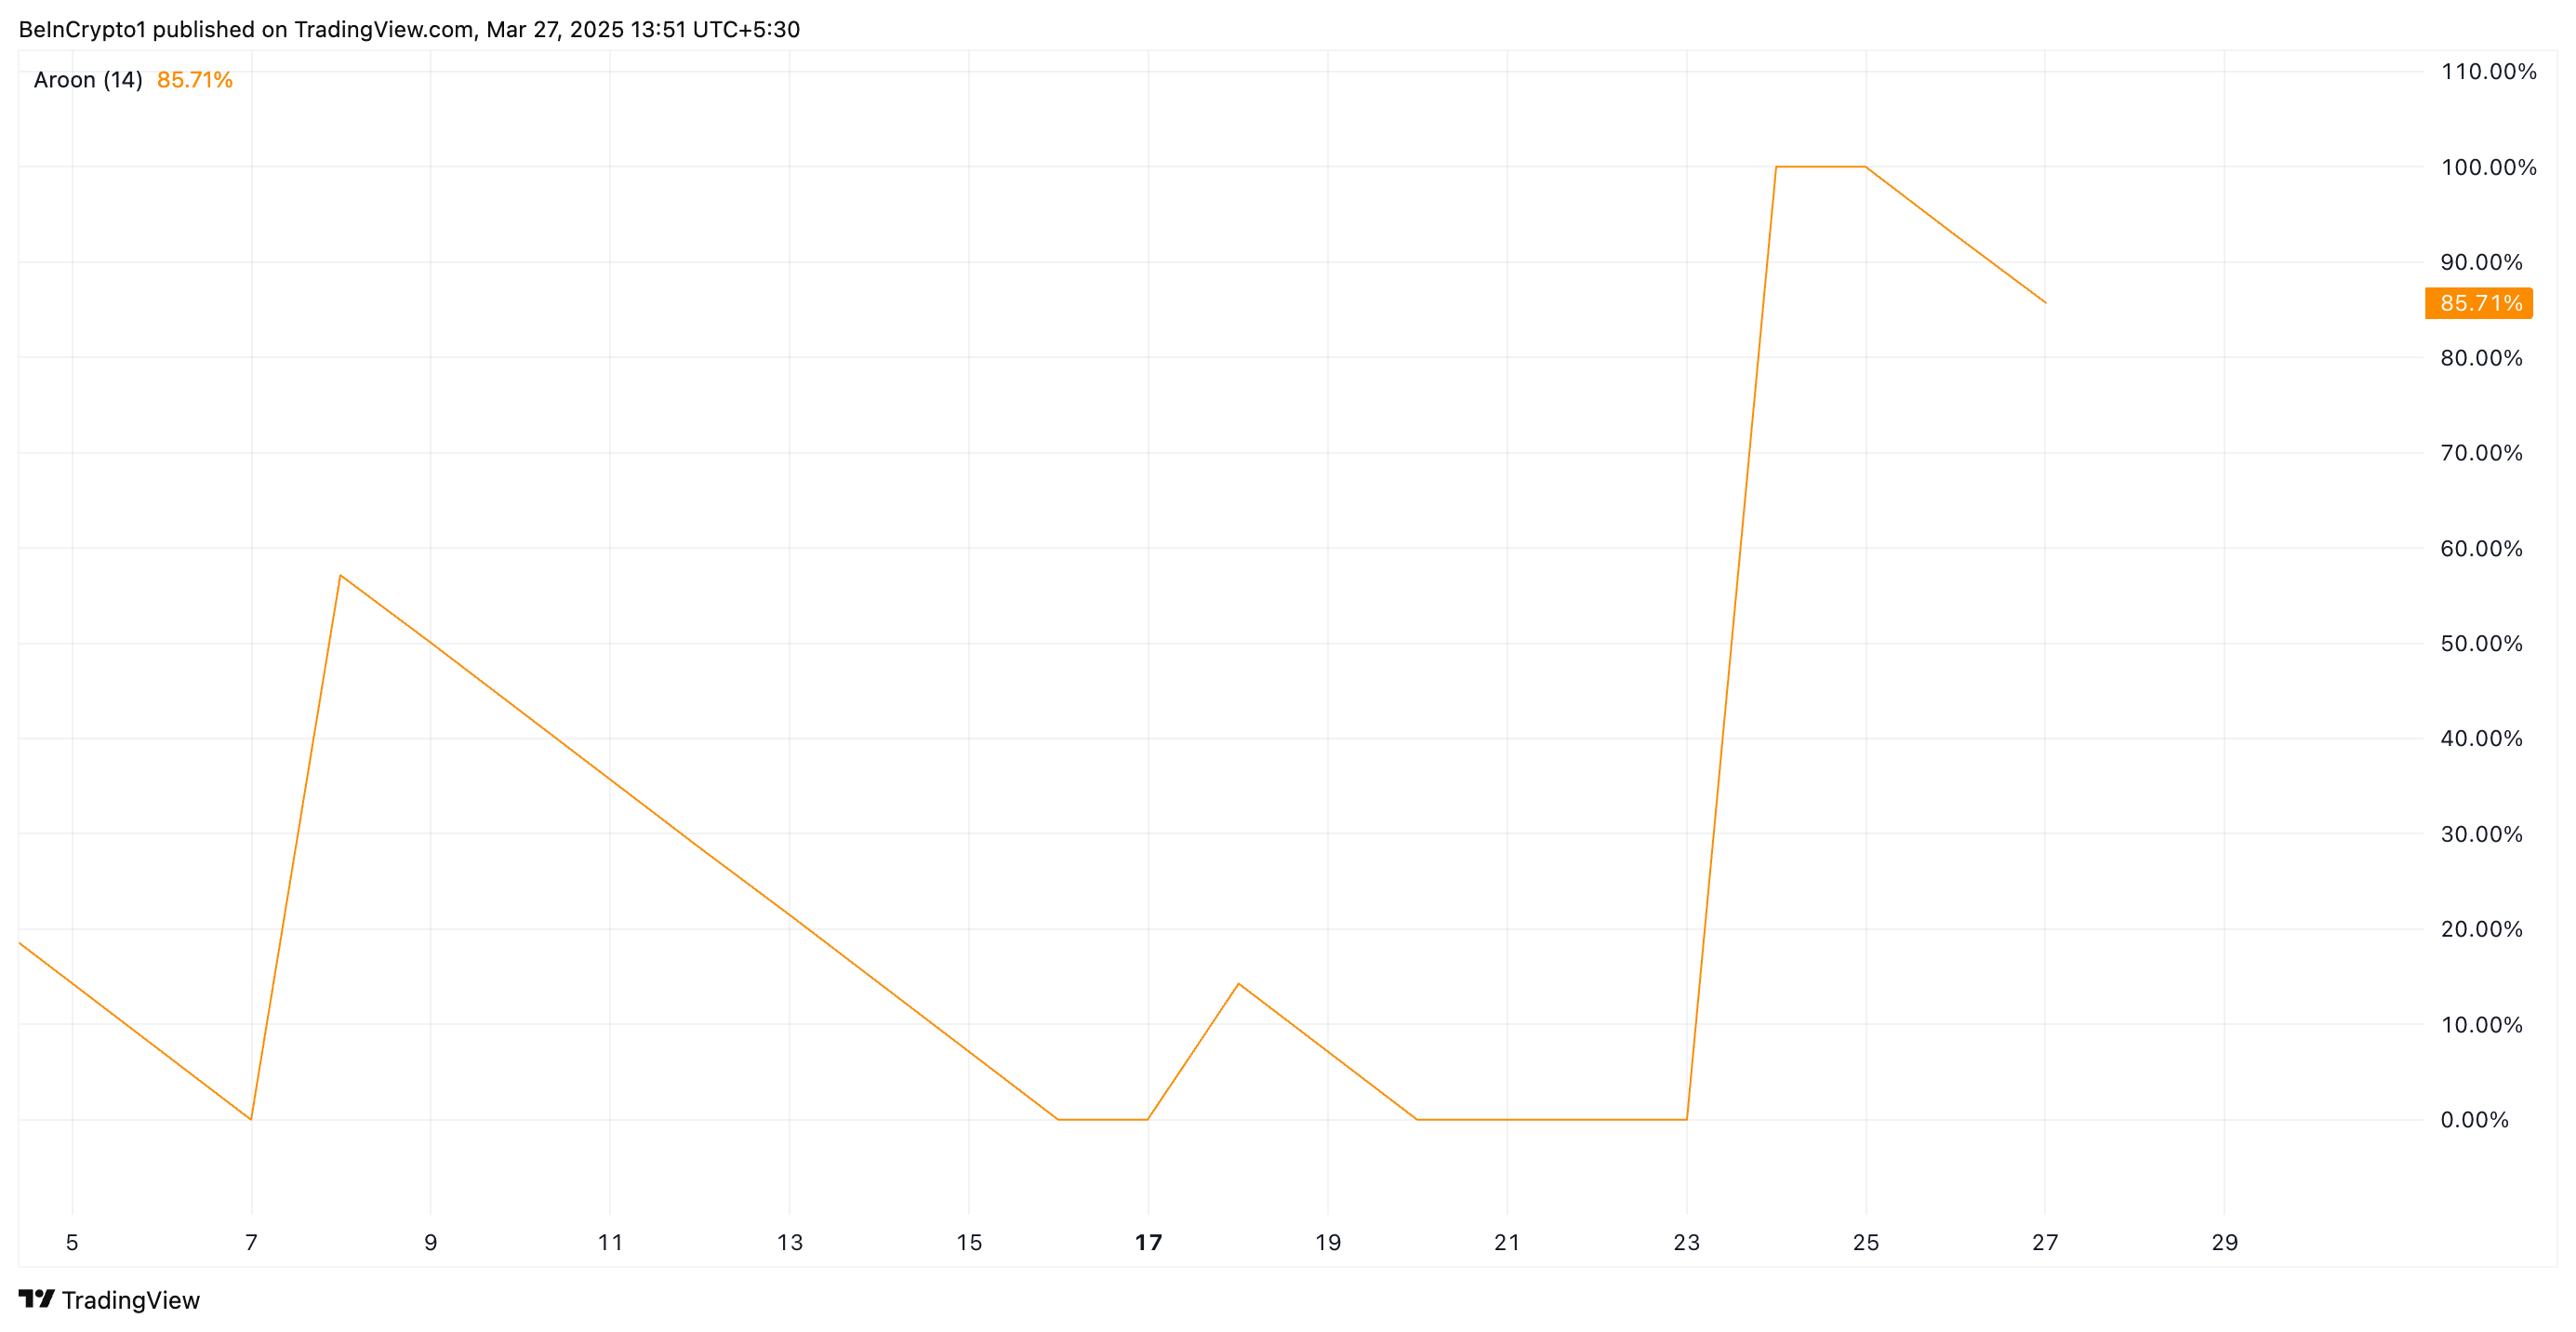 SOL Aroon Up Line. Source: TradingView
The Aroon Indicator measures the strength and direction of a trend by tracking the time since the highest and lowest prices occurred. When an asset’s Aroon Up line is close to 100%, it signals a strong uptrend, indicating that it has recently hit new highs and has bullish momentum.
Solana’s Breakout Could Push Price to $230, But Risks Remain
Typically, when an asset breaks out of a falling wedge pattern, its price is expected to rise by an amount equal to the maximum height of the wedge. If this happens, SOL’s price could climb 67% to exchange hands at $230.22.
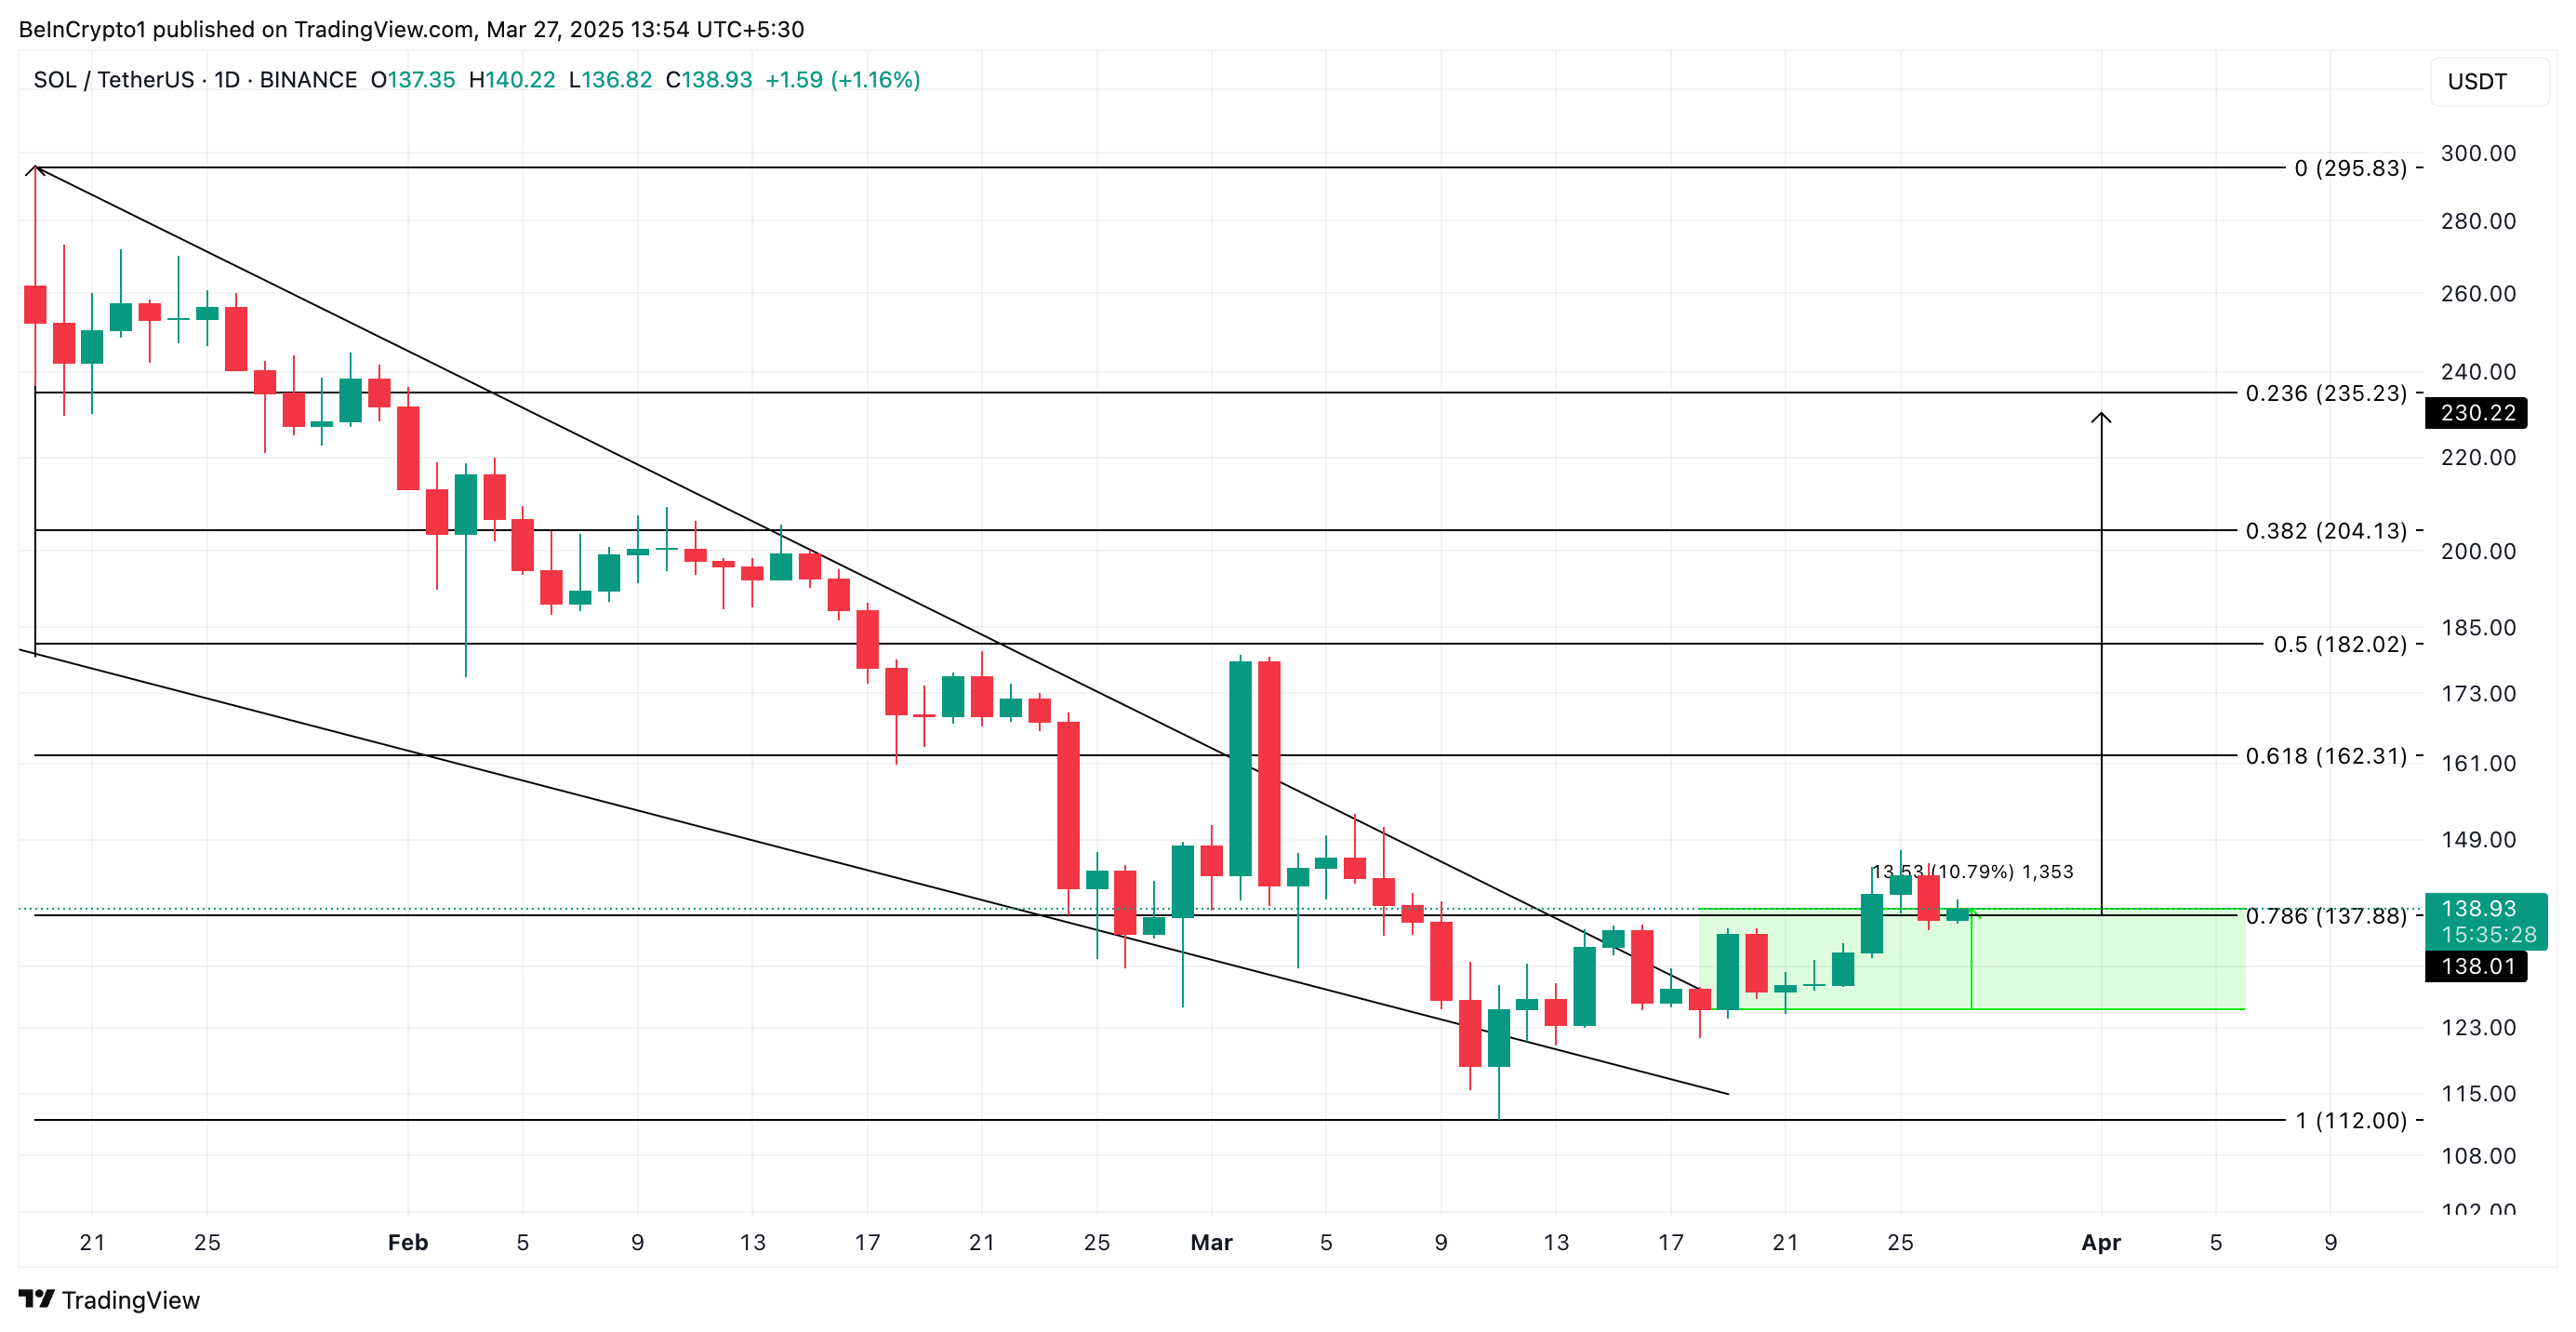 SOL Price Analysis. Source: TradingView
On the other hand, if selloffs resume, this bullish projection would be invalidated. SOL’s price could fall toward $112 if this happens.
0
0

 Manage all your crypto, NFT and DeFi from one place
Securely connect the portfolio you’re using to start.


