XLM Price’s 14% Rise Meets Critical Barrier, Breaching It Is a Make-or-Break Moment

0
0

Stellar (XLM) has surged roughly 14% and is now pressing against the 61.8% Fibonacci retracement level at $0.1776. The altcoin trades at $0.1777 on the 12-hour chart as of March 25, 2026.
A bullish divergence on the Chaikin Money Flow indicator and a dominant long position bias in the futures market both support the rally. However, the 61.8% Fibonacci level has already turned XLM away once before, and a repeat rejection carries real consequences.
Divergence Signals Recovering Buyer Pressure Aiding XLM Rise
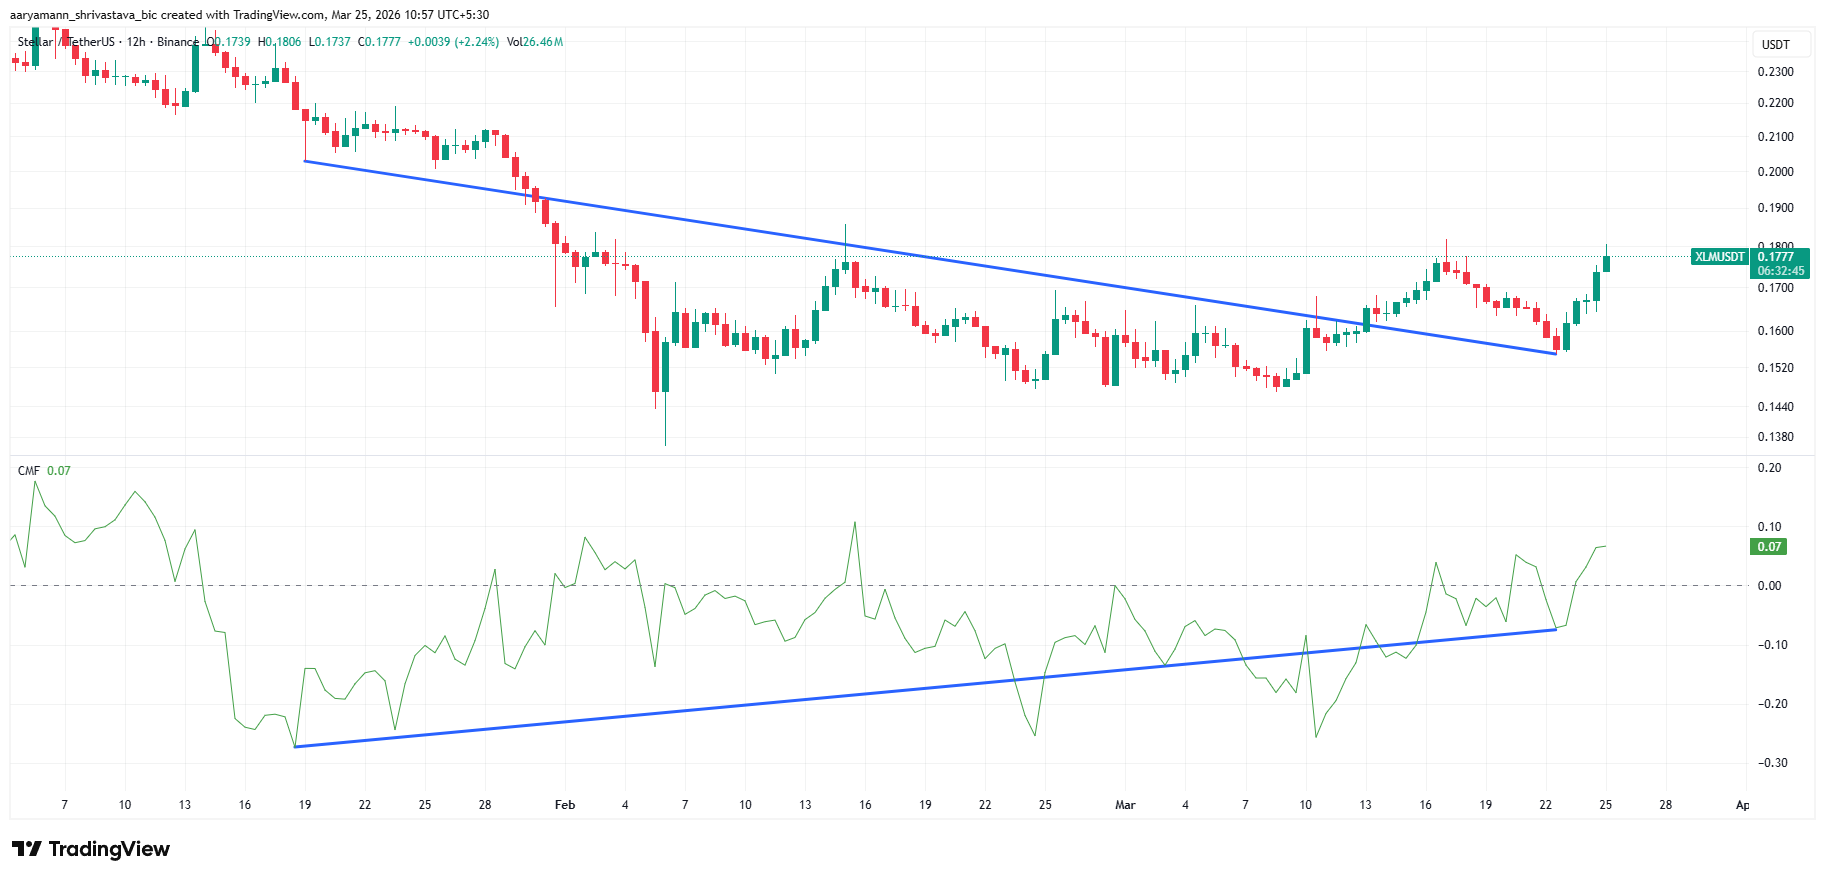
The Chaikin Money Flow (CMF) is currently standing above the zero line at 0.07. That matters because, while the price was making lower lows throughout January and February, CMF was forming higher lows over the same period.
This is a classic bullish divergence formed between February 18 and March 23. Price and momentum were moving in opposite directions, signaling that selling pressure was weakening even as XLM continued to slide. The CMF trendline drawn across its lows shows a consistent rise from the minus-0.25 zone in late January to its current reading above zero.
Want more token insights like this? Sign up for Editor Harsh Notariya’s Daily Crypto Newsletter here.
 XLM CMF. Source: TradingView
A CMF reading above zero means buying volume is outpacing selling volume on a net basis. For the bullish case to hold, CMF needs to remain above zero and ideally push toward the 0.10-0.20 range. A drop back below zero would suggest buyers are losing conviction at this resistance level.
Bulls Dominate XLM’s Futures Market
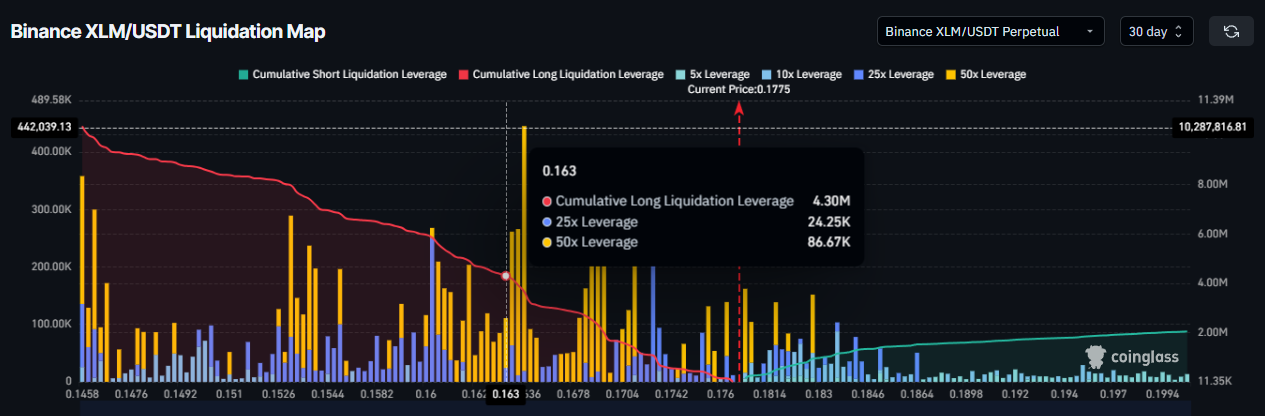
Despite the CMF divergence pointing bullish, the liquidation map for XLM perpetual futures on Binance tells a more complicated story. The current price of $0.1775 sits inside one of the densest clusters of long liquidation leverage on the entire chart.
At the $0.163 price level, cumulative long liquidation leverage stands at $4.30 million. That cluster represents overleveraged long positions that get force-closed if the price falls to that zone. Above the current price, short liquidation leverage builds progressively, meaning a breakout higher would squeeze shorts and add fuel to any upward move.
 XLM Liquidation Map. Source: Coinglass
The dominance of long positions in the futures market reflects traders’ conviction that XLM will break higher. However, that same concentration creates a trap. If the 61.8% Fibonacci level rejects price and momentum turns south, those stacked longs between $0.1700 and $0.163 become a liquidation cascade waiting to be triggered.
XLM Price Faces an Old Foe
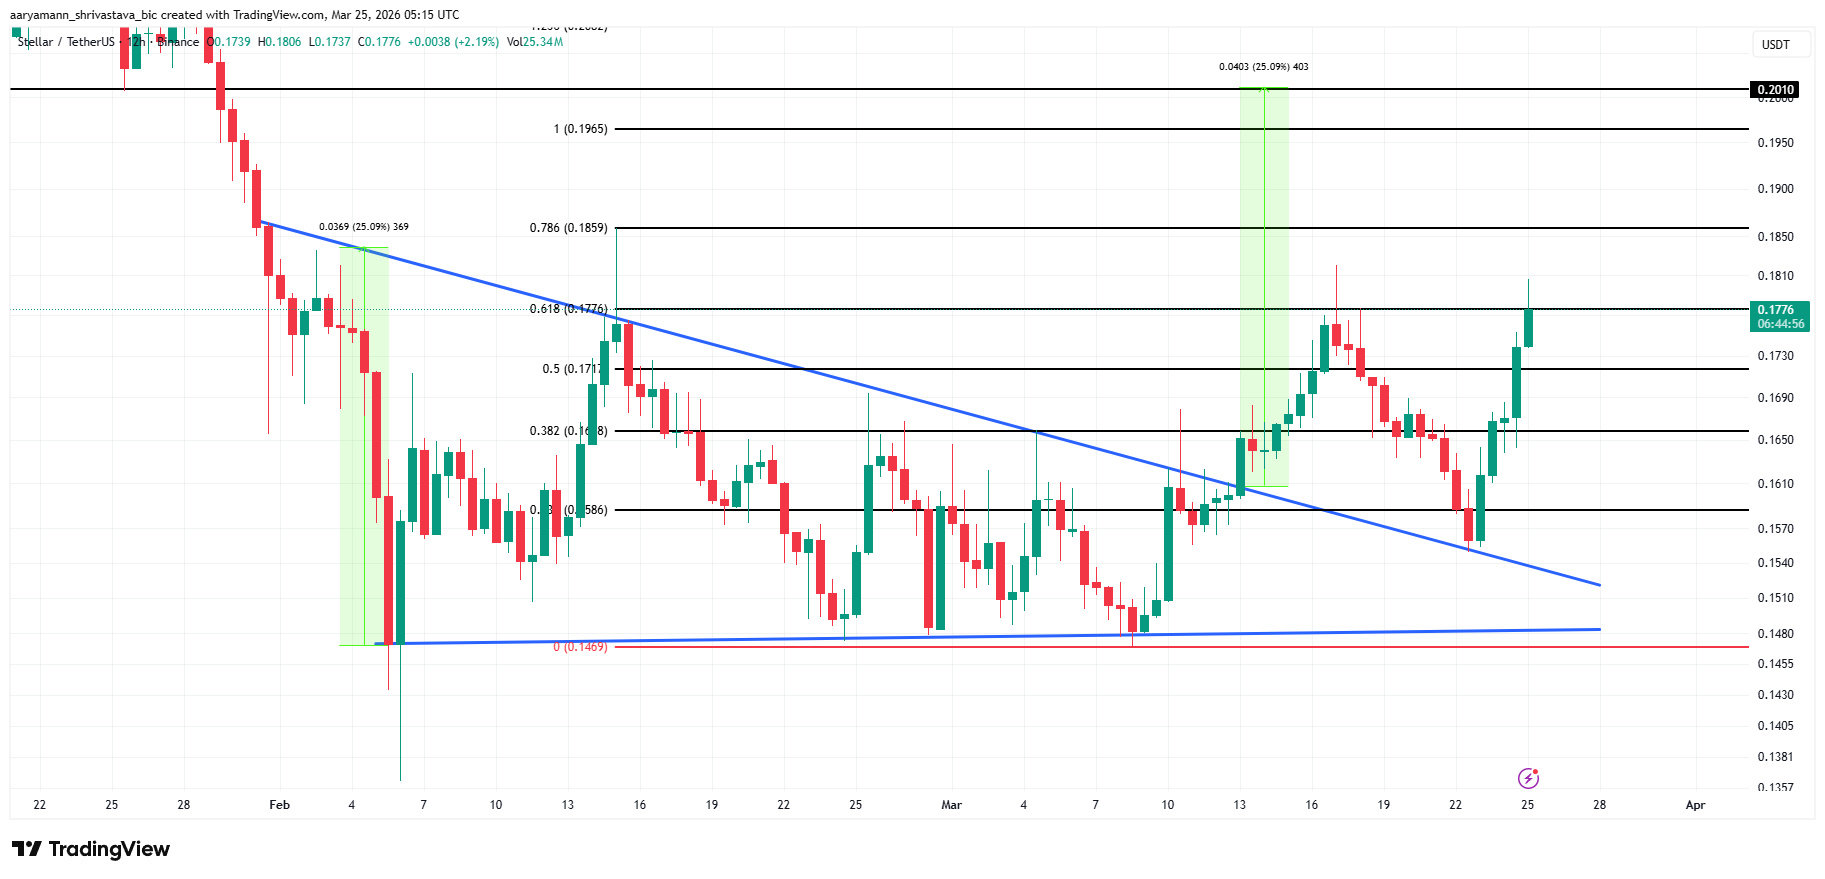
The Fibonacci retracement chart drawn from the January high near $0.2228 down to the February low at $0.1469 identifies the 61.8% level at $0.1776. XLM has tested this level before. In mid-February, price briefly tapped the 61.8% zone and was rejected, falling back through the 50% level at $0.1710 and eventually retesting the 38.2% level near $0.1618.
XLM is now back at the same 61.8% barrier following a 14% rise in the last 2 days. The altcoin is also noting a descending wedge formation, which adds further resistance pressure. The measured breakout target sits at $0.2010, which represents a 25.09% move from the breakout point. XLM nearly invalidated this pattern, but the recovery has kept it intact.
For that target to come into play, XLM must break and close above $0.1776 convincingly. The 78.6% retracement level at $0.1859 would serve as the next checkpoint before $0.2010 becomes realistic.
 XLM Price Analysis. Source: TradingView
The invalidating scenario is straightforward. A rejection at $0.1776 followed by a close below the $0.1586 support level would sweep through the dense long liquidation cluster centered around $0.1630. That would put $4.30 million in leveraged long positions at risk of forced liquidation, amplifying any sell-off significantly. The hard support floor below is the $0.1469 swing low, marked as the 0 level on the Fibonacci chart.
XLM either breaks the 61.8% Fib wall and runs toward $0.2010, or history repeats, and the rejection triggers a liquidation-driven move toward $0.1630.
0
0


 Manage all your crypto, NFT and DeFi from one place
Securely connect the portfolio you’re using to start.

0
0

0
0

0
0

0
0