
Why Are Bitcoin and Ethereum Prices Losing Steam While XRP Holds Up?

0
0

Bitcoin and Ethereum prices are showing signs of losing steam, pulling back from short-term highs after an early rally tied to the US Treasury's bond buyback move.
XRP, meanwhile, is holding up firm near its own resistance zone. This Bitcoin price prediction breaks down why the momentum is fading and what levels traders are watching next.
Why Are Crypto Prices Moving Today?
The trigger behind the latest move was not crypto-specific news. It came from Washington.
The Treasury announced it will double its long-term bond buyback operations from $2 billion to $4 billion per session. Bernstein strategist Gautam Chhugani said this kind of liquidity move has historically been a positive signal for bitcoin.
Treasury Secretary Scott Bessent said he still has a "big toolkit" left to manage rising bond yields. That comment alone was enough to lift sentiment across digital assets overnight.
There was also a political angle. President Trump met with executives from Coinbase and Robinhood at the White House this week and pushed Congress to pass a version of the Clarity Act.
Chhugani noted that without the bill, regulators may still move ahead with new rules covering things like 24/7 crypto futures and tokenized stocks.
By buying debt in the secondary market, the Treasury is aiming to inject liquidity, stabilize falling bond prices, and pull down borrowing costs for consumers and businesses. Yields had spiked to 20-year highs, driven by nagging inflation and energy price pressure tied to the ongoing US-Iran conflict.
Bitcoin Price Prediction: Why Is BTC Losing Steam Near $80,000?
Bitcoin touched a high of $79,463 this week, but the rally lost almost 3% from that peak in a hurry. It is now trading around $77,358.
A large sell wall has formed right at the $80,000 level, based on order book data from CoinGlass. Walls like this often show that a big holder is not ready to let price run further just yet.
BTC is currently caught between the 50-week EMA near $77,237 and the 100-week EMA around $78,451. That tight cluster has been hard to break through.
The weekly RSI sits close to 56, which is a healthy reading. It is bullish but not overheated, so there is still room to climb if resistance gives way.
On the weekly chart, Bitcoin has bounced strongly from the $60,000 to $62,000 support zone, forming a higher-low recovery followed by a strong bullish weekly candle. BTC has also reclaimed the 20-week EMA near $69,239, which now acts as a dynamic support floor underneath the market.
Bitcoin Support and Resistance Levels
Level Type | Price Zone | Note |
Major resistance | $83,000 | Lines up with horizontal chart resistance |
Resistance cluster | 77,000–79,000 | 50-week and 100-week EMA zone |
Support | $69,200 | 20-week EMA |
Support | $68,500 | 200-week EMA |
Downside risk zone | 60,000–62,000 | Prior support base |
A weekly close above $83,000 could open the door toward $90,000 to $95,000, and possibly higher if buyers keep control. A rejection from current levels could send price back toward the 20-week EMA near $69,200.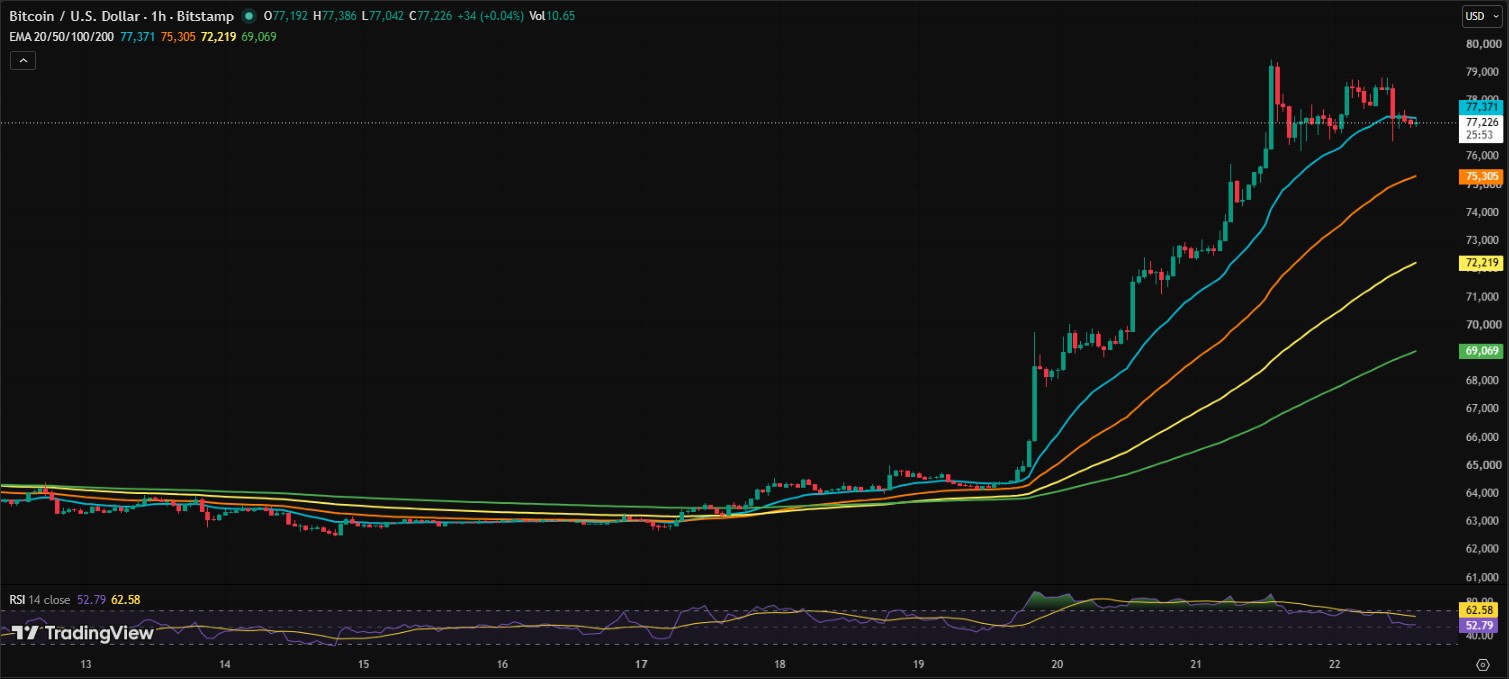
Crypto liquidations across the market hit $1.36 billion in the past 24 hours, according to CoinGlass data. Ethereum led with $303.66 million liquidated, followed by Bitcoin at $273.16 million, XRP at $122.27 million, and Solana at $103.04 million. ZEC saw $70.24 million wiped out, while DOGE and HYPE recorded $41.89 million and $33.09 million.
Long positions made up $809.78 million of the total, compared with $552 million in short liquidations. Over 261,000 traders were liquidated in the period, and the single largest order was a $24.96 million BTC-USD position on Hyperliquid.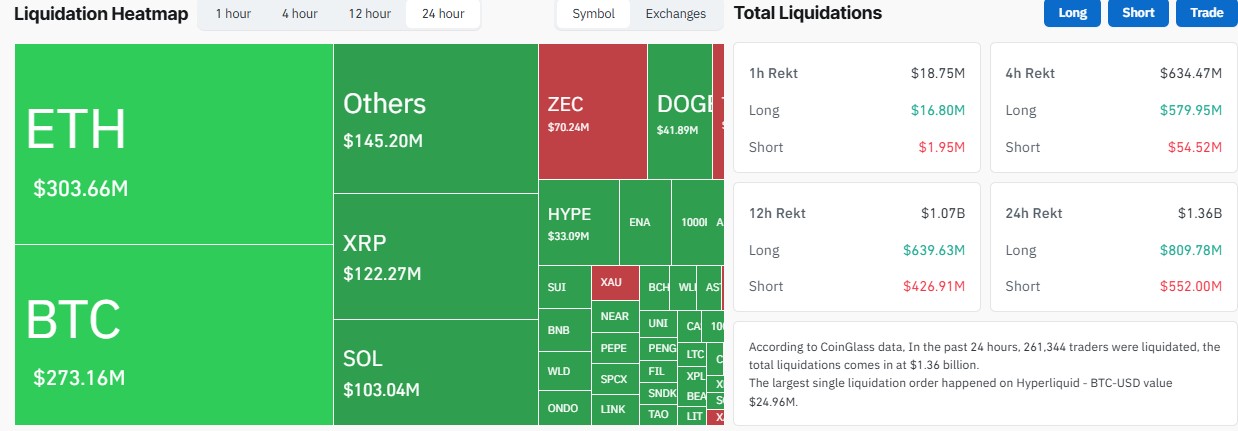
Ethereum Price Prediction: Why Is ETH Losing Momentum After the 100-Week EMA Rejection?
Ethereum has been rejected from its 100-week EMA near $2,475, and that level is still acting as a wall for sellers.
On the hourly chart, ETH ran from around $1,900 up past $2,500, then dropped about 6% in a short window as buyers ran out of steam.
The $2,370 area is now the level to watch. Holding above it and reclaiming $2,450 to $2,475 could open the way toward $2,520 to $2,560.
If $2,370 breaks, the pullback could stretch toward $2,300, and possibly $2,200 in a deeper correction.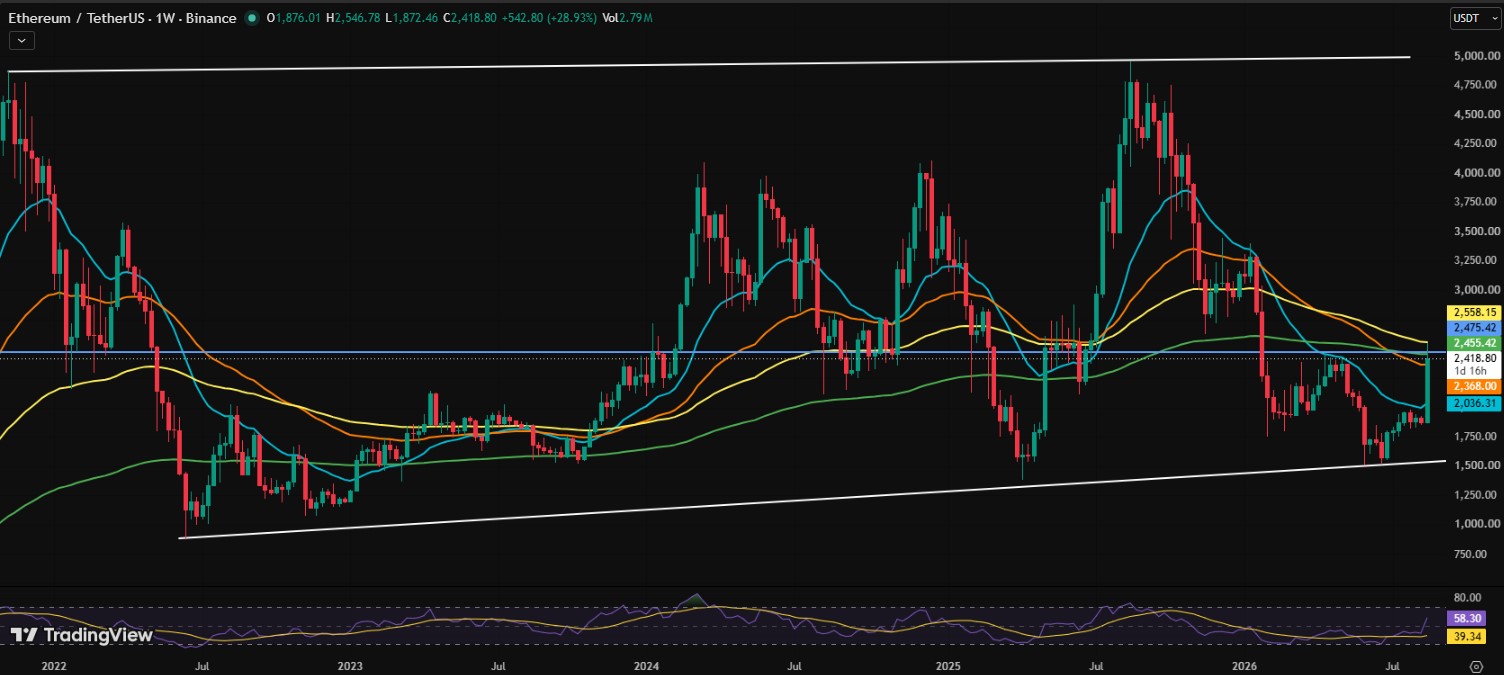
Ethereum saw the largest liquidations of any coin over the past day, at $303.66 million, according to CoinGlass. That suggests leveraged positions got shaken out hard on both sides of the move.
XRP Price Prediction: Why Is XRP Holding Up Above Its 200 EMA?
While Bitcoin and Ethereum lose steam near their resistance zones, XRP has had one of the stronger runs in the market, climbing from around $1.00 to $1.70 before settling near $1.53.
The token is now trading above its 200 EMA, sitting near $1.345, which had been a major resistance line for months. That shift matters because old resistance often becomes new support once it is reclaimed.
The daily RSI is close to 87, which is deep into overbought territory. A short pause or pullback would not be unusual after a move like this.
Market analyst EGRAG CRYPTO has called $1.65 the next battleground for XRP. Holding above $1.45 to $1.50 could set up another push toward that level and beyond.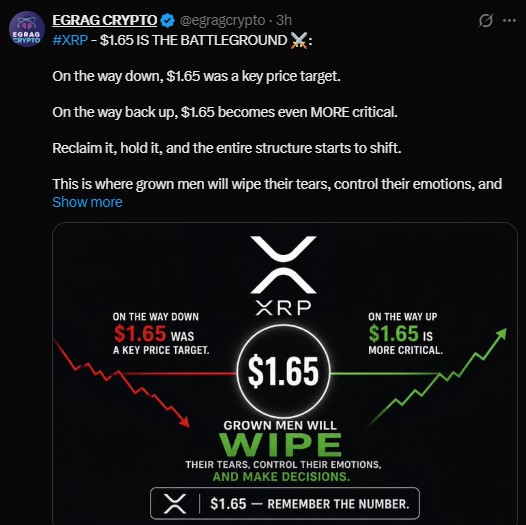
Large holders reportedly added around 190 million XRP in a single day, based on on-chain tracking data, and activity on the XRP Ledger has picked up as well.
Ripple CEO Brad Garlinghouse also took part in private talks on the Clarity Act with US Commerce Secretary Howard Lutnick this week, keeping regulatory clarity in focus for the token.
Market commentator ChartNerd has pointed out similarities between XRP's current chart structure and the setup around its 2022 cycle bottom. A key level in that comparison is XRP's 50-week EMA. Reclaiming it, alongside a break of $1.65, could strengthen the case that XRP is shifting from recovery into a more sustained uptrend.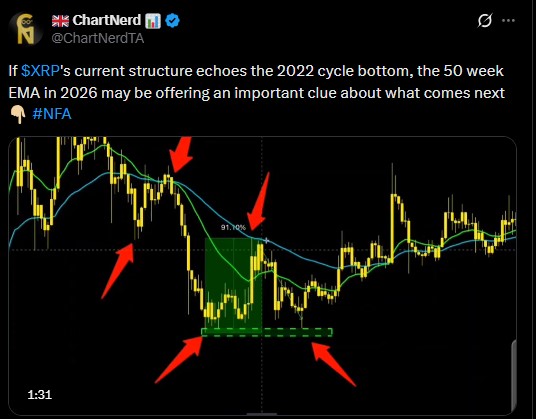
XRP Key Levels to Watch
Level | Price | Significance |
Resistance | 1.65–1.70 | Key battleground level |
Support | $1.45 | Near-term floor |
Support | 1.35–1.40 | 200 EMA and breakout zone |
Downside risk | 1.17–1.20 | 100 EMA level |
A daily close above $1.70 could open the path toward $1.80 to $1.90, with $2.00 becoming the next round-number target. A break below $1.35 would weaken the current setup.
What This Means for the Market This Week
Inflation data, GDP figures, and jobs numbers are all due this week, and they could shape whether this rally has more room to run.
Fed Chair Kevin Warsh has said price stability remains a priority, even as pressure builds for the FOMC to consider a rate hike. According to Polymarket data, the odds of a rate hike have climbed back above 50%.
A hot inflation print could hurt risk assets, including bitcoin, ethereum, and XRP. Softer data could give the current rally more fuel.
For now, the bitcoin price prediction outlook stays tied to whether BTC can clear the $77,000 to $79,000 resistance band, while ETH and XRP fight their own battles at $2,475 and $1.65.
Disclaimer
This article is for informational purposes only and does not constitute financial, investment, or trading advice. Cryptocurrency prices are highly volatile and involve significant risk. Past performance is not indicative of future results. Always do your own research and consult a licensed financial advisor before making any investment decisions.
0
0


 Manage all your crypto, NFT and DeFi from one place
Securely connect the portfolio you’re using to start.


