SUI Struggles at Resistance After $147 Million Token Unlock

0
0


SUI enters a critical phase today as a $147 million token unlock threatens to inject selling pressure into a market already testing key resistance levels. Despite a sharp rebound in momentum—evident in the RSI’s surge from oversold territory—SUI failed to break above the crucial 60 mark, signaling buyer hesitation.
The Ichimoku Cloud shows price action pressing against the cloud’s edge, but lacking the conviction needed for a clear breakout. With a possible golden cross forming on the EMA lines, bulls still have a chance—if they can overcome resistance at $2.50 and avoid being dragged down by post-unlock volatility.
SUI RSI Surged Since Yesterday But Failed To Break Above 60
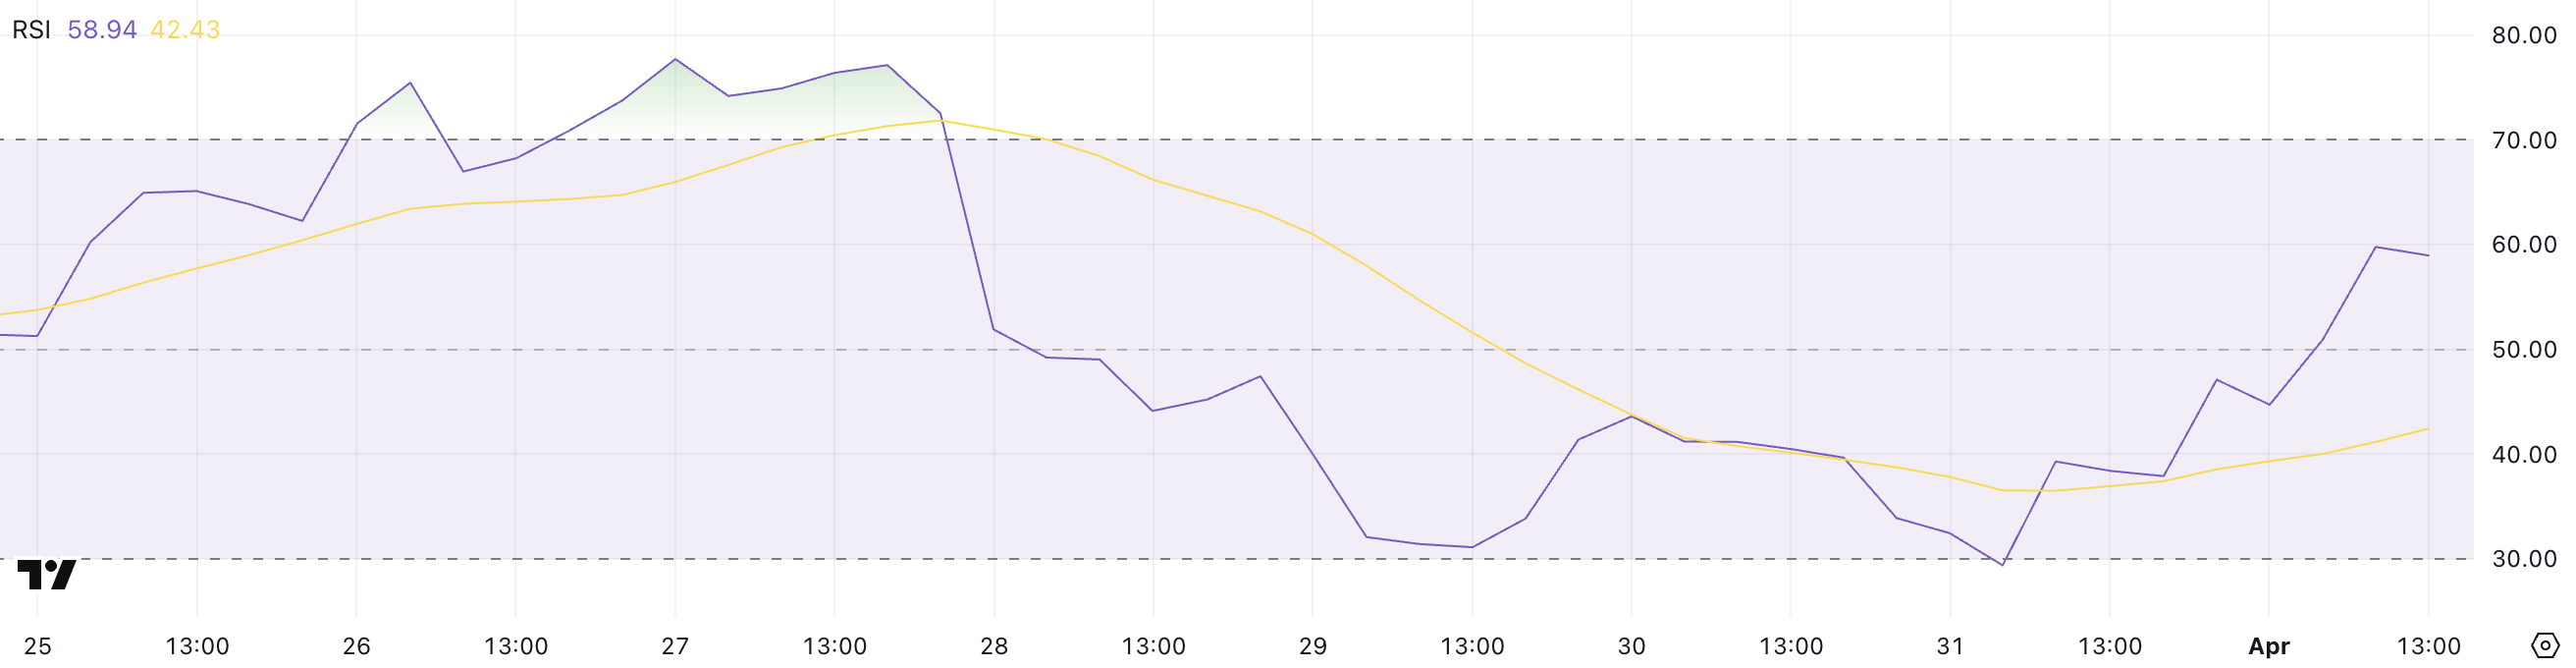
SUI’s Relative Strength Index (RSI) has jumped sharply to 58.94, up from 29.38 just a day ago, reflecting a strong shift in short-term momentum.
The RSI is a momentum oscillator that measures the speed and magnitude of recent price changes. It typically ranges from 0 to 100. Readings below 30 suggest an asset may be oversold, while levels above 70 indicate it may be overbought.
The rapid rise in SUI’s RSI suggests buyers have stepped in aggressively after a period of heavy selling.
 SUI RSI. Source: TradingView.
However, despite the impressive rebound, SUI’s RSI briefly approached but failed to break above the 60 threshold earlier today.
This level often acts as a short-term resistance during recovery phases, and the rejection may indicate lingering hesitation among buyers or profit-taking after the surge.
While the RSI nearing 60 is encouraging, a decisive move above it would be needed to confirm a breakout. For now, SUI appears to be in a recovery mode. However, the inability to push past 60 highlights that bulls are not fully in control just yet.
Ichimoku Cloud Shows Lack Of Strong Upward Momentum
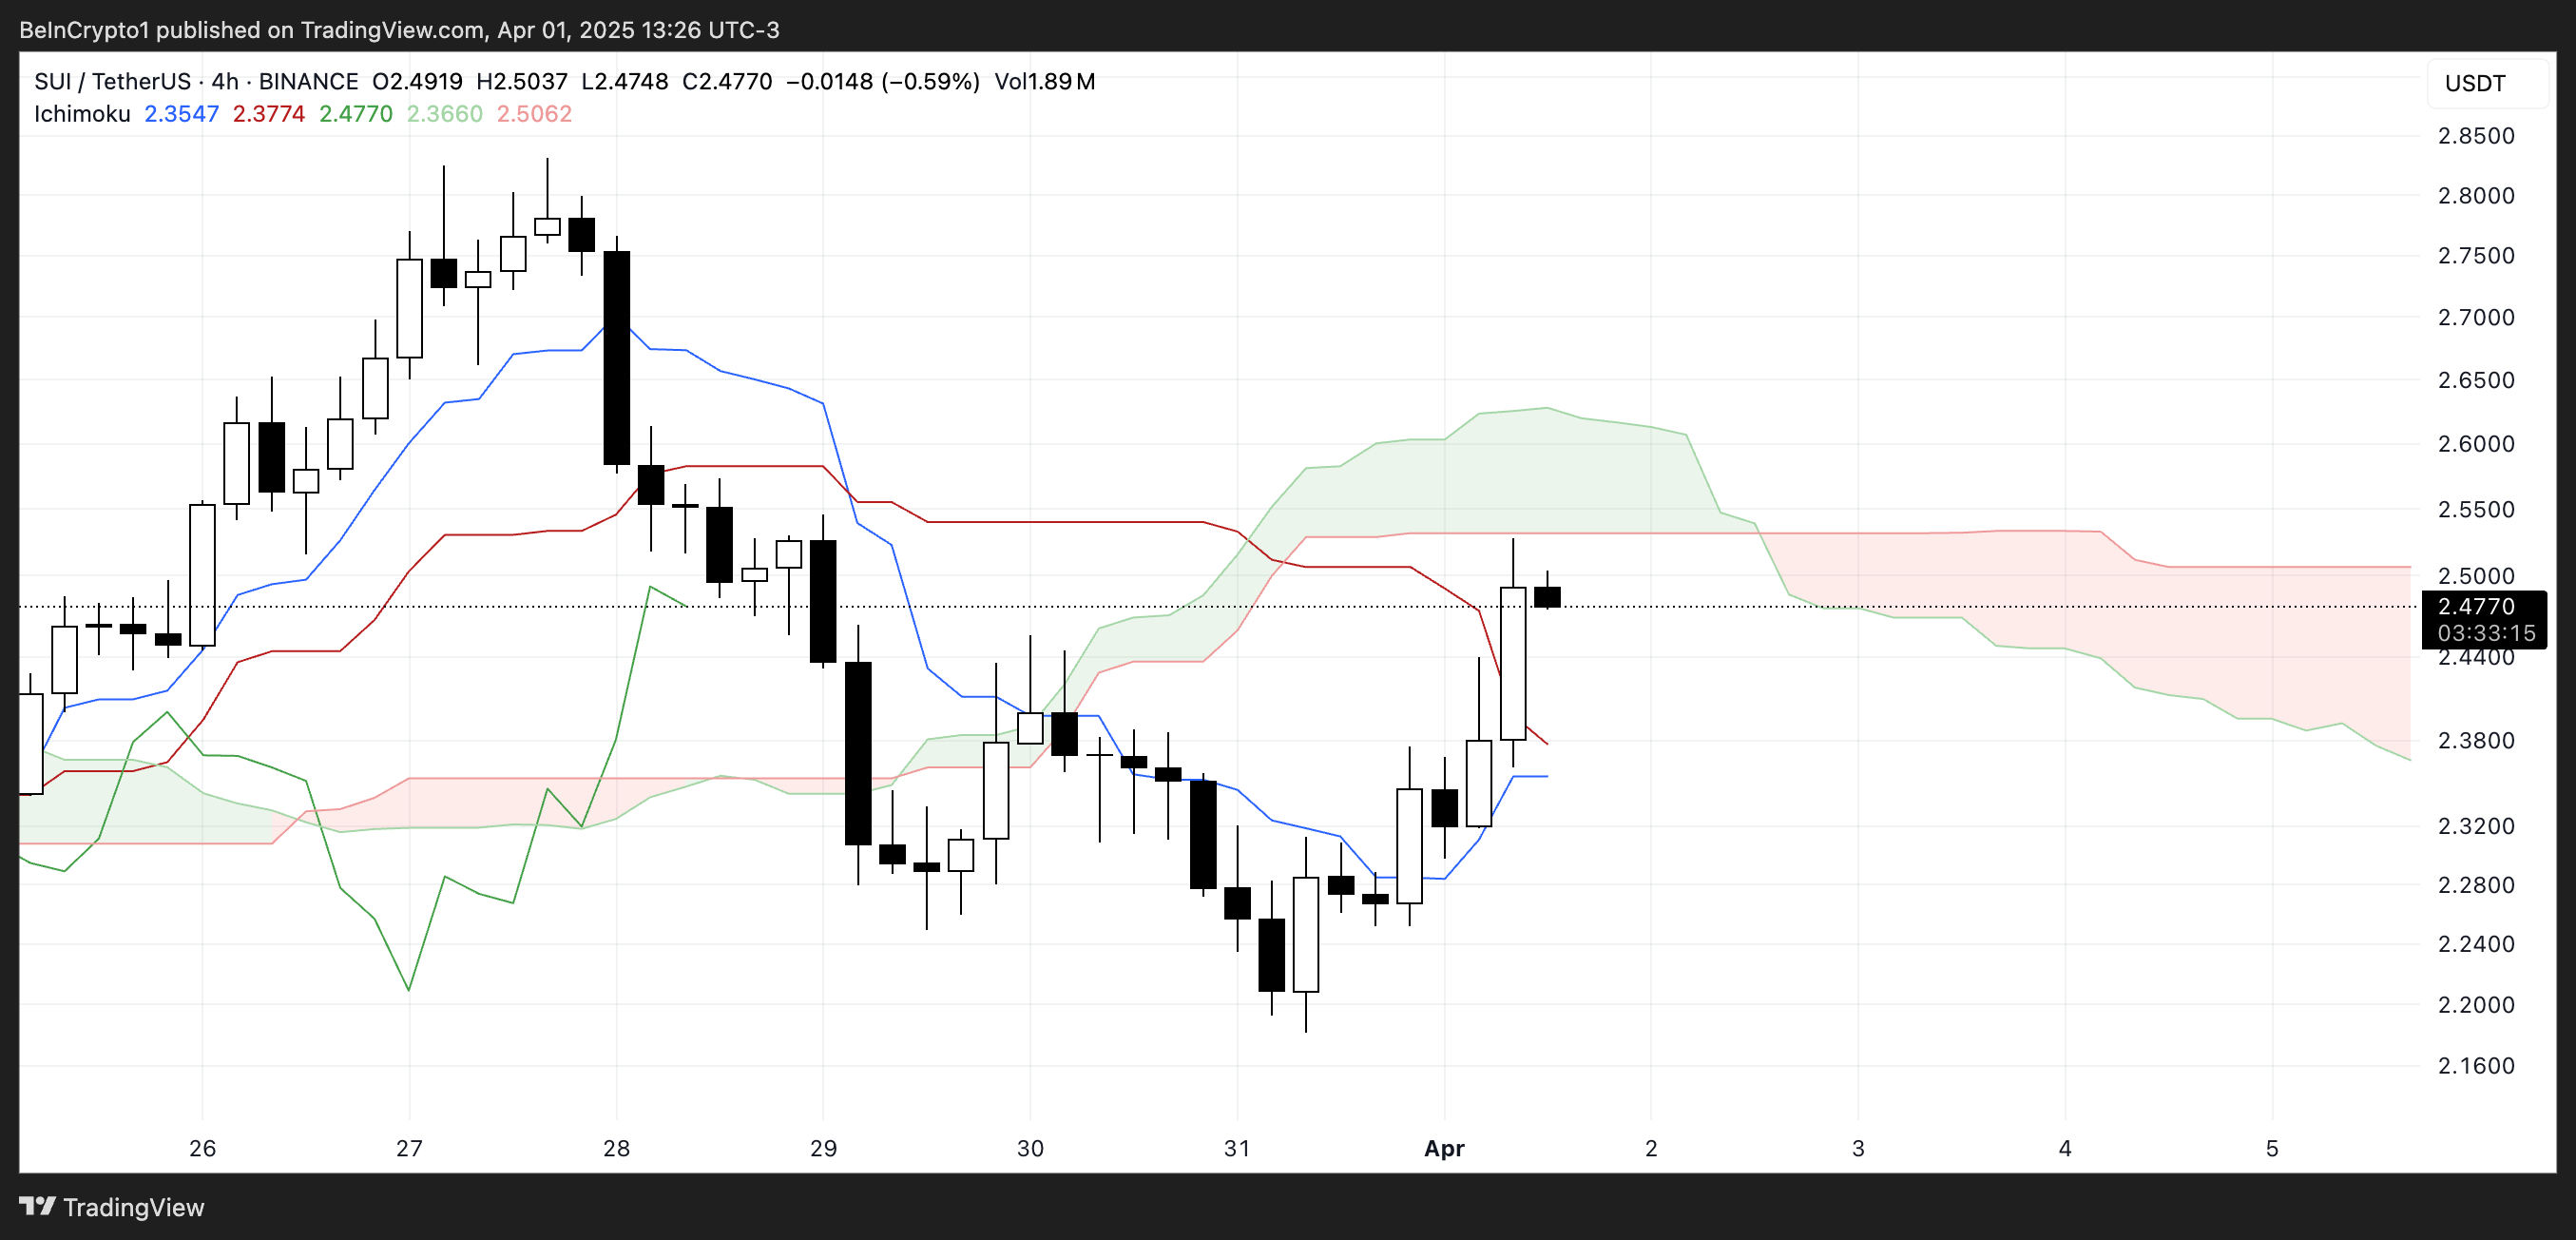
SUI blockchain Ichimoku Cloud chart shows a potential breakout attempt, as the price has surged upward and is now hovering right at the edge of the Kumo (cloud).
This movement suggests bullish momentum is trying to build. However, the resistance provided by the thick, red cloud ahead could make it difficult for SUI to sustain the uptrend without stronger confirmation.
The Tenkan-sen (blue line) is starting to rise and has crossed above the Kijun-sen (red line), which is a bullish signal. However, the price still needs to clearly break and hold above the cloud to flip the overall trend from bearish to bullish.
 SUI Ichimoku Cloud. Source: TradingView.
For now, the cloud remains bearish and flat, indicating possible resistance and a lack of strong upward conviction.
The current position suggests that SUI is at a key decision point—either break through the cloud to initiate a trend reversal or get rejected and slip back into the previous downtrend range.
If buyers can sustain the pressure and push the price above the upper cloud boundary, it could trigger a stronger rally. But without increased volume and broader market support, the price risks getting stuck in consolidation or turning back downward.
Will SUI Rise Back To $2.80?
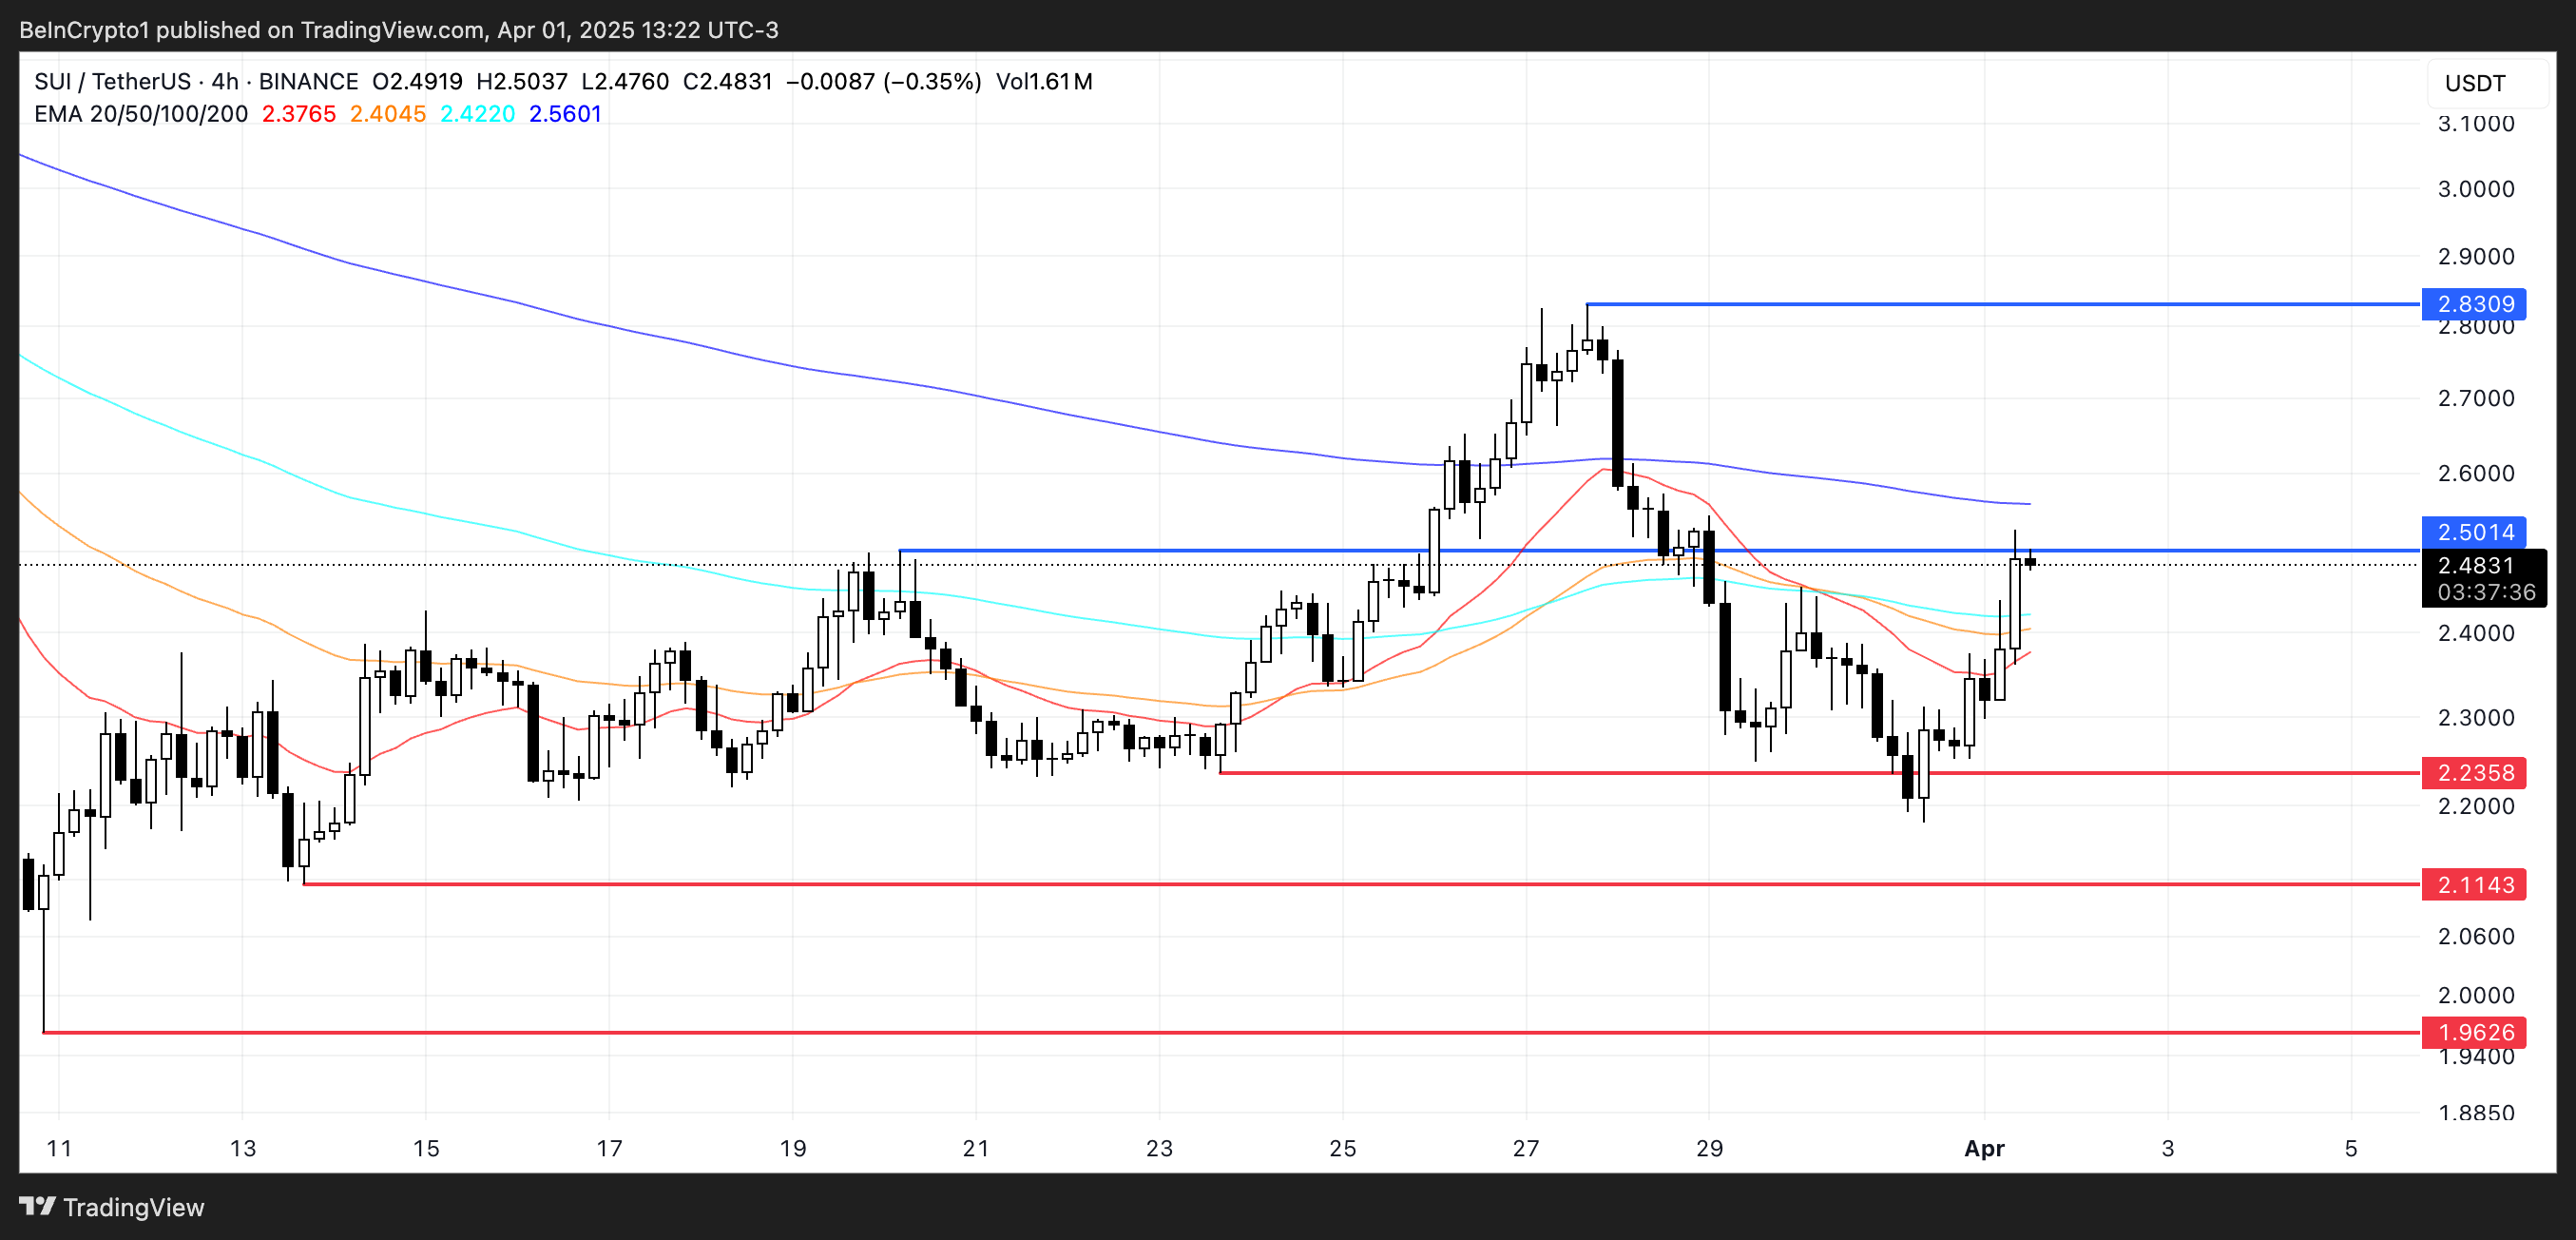
SUI’s EMA lines are tightening and showing signs of a potential golden cross. That happens when a short-term moving average crosses above a longer-term one—a classic bullish signal that often precedes upward momentum.
However, the price is currently grappling with a key resistance near the $2.50 level.
If bulls manage to break through this level, it could open the path for a move toward $2.83.
 Price Analysis for SUI. Source: TradingView.
That said, downside risks remain, particularly with today’s $147 million token unlock, which could introduce significant selling pressure. If that selling materializes, SUI price could fall back to test the support at $2.23.
A breakdown below that level would likely shift momentum back in favor of bears. This would expose deeper supports at $2.11 and $1.96.
0
0


 Manage all your crypto, NFT and DeFi from one place
Securely connect the portfolio you’re using to start.


0
0
