Bitcoin (BTC) On The Edge As “Liberation Day” Approaches And Indicators Collide

0
0


Bitcoin (BTC) enters April on shaky footing. It is caught between fading bearish momentum and rising uncertainty ahead of Wednesday’s highly anticipated “Liberation Day” tariff announcement. Technical indicators like the DMI, Ichimoku Cloud, and EMA lines show mixed signals, with early signs of buyer strength emerging.
The market remains range-bound, with both downside tests and breakout rallies on the table depending on macro developments. With the JOLTS report due today and tariff clarity still pending, Bitcoin’s next major move could be just around the corner.
BTC DMI Shows Buyers Took Control, But Will It Last?
Bitcoin’s Directional Movement Index (DMI) is flashing potential signs of a momentum shift. The Average Directional Index (ADX), which measures the strength of a trend regardless of its direction, has dropped to 28.59 from 40.38 yesterday. That indicates that the current downtrend may be losing steam.
Typically, an ADX reading above 25 signals a strong trend, while values below that suggest a weakening or sideways market. Although 28.59 still shows moderate trend strength, the drop signals fading momentum.
Meanwhile, the +DI (positive directional indicator) has surged to 23.75 from 9.35, while the -DI (negative directional indicator) has fallen to 17.88 from 34.58—suggesting bullish pressure is beginning to build.
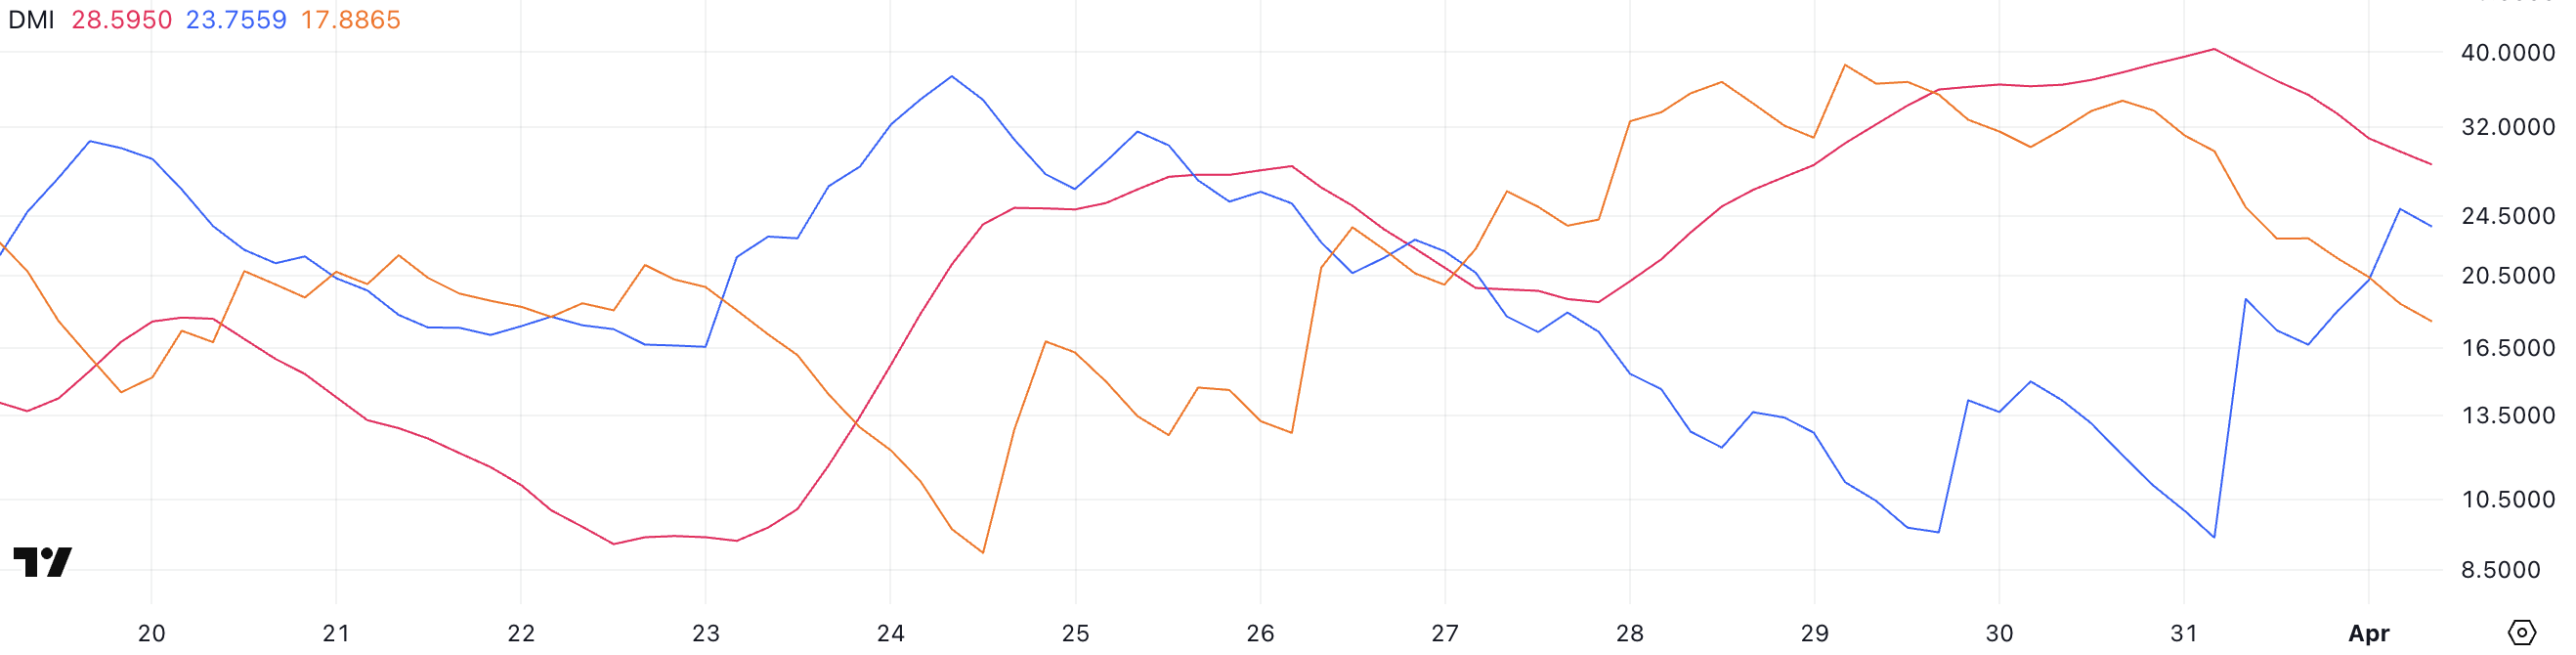 BTC DMI. Source: TradingView
This crossover between the +DI and -DI could signal an early trend reversal, especially if confirmed by further price action and volume. However, it’s important to note that Bitcoin remains in a broader downtrend for now.
Market participants are also eyeing today’s JOLTS report, a key indicator of U.S. job openings. A stronger-than-expected report could lift the dollar and apply pressure to crypto markets. On the other hand, weaker data could increase expectations of rate cuts, potentially boosting Bitcoin and other risk assets.
With directional indicators shifting and macroeconomic data in play, Bitcoin’s next move could be heavily influenced by external catalysts. Recently, BlackRock CEO Larry Fink stated that Bitcoin could take the dollar’s role as the world reserve currency.
Bitcoin Ichimoku Cloud Shows The Bearish Trend Is Still Here
Bitcoin’s Ichimoku Cloud chart reveals a market still under bearish pressure, despite recent signs of short-term recovery. The price is currently testing the Kijun-sen (red line), which acts as a key resistance level.
While the Tenkan-sen (blue line) is starting to flatten and curl upward—often a sign of momentum shift—the fact that the price remains below the Kumo (cloud) indicates that the broader trend is still bearish.
The cloud ahead is red and descending, suggesting continued downward pressure in the near term.
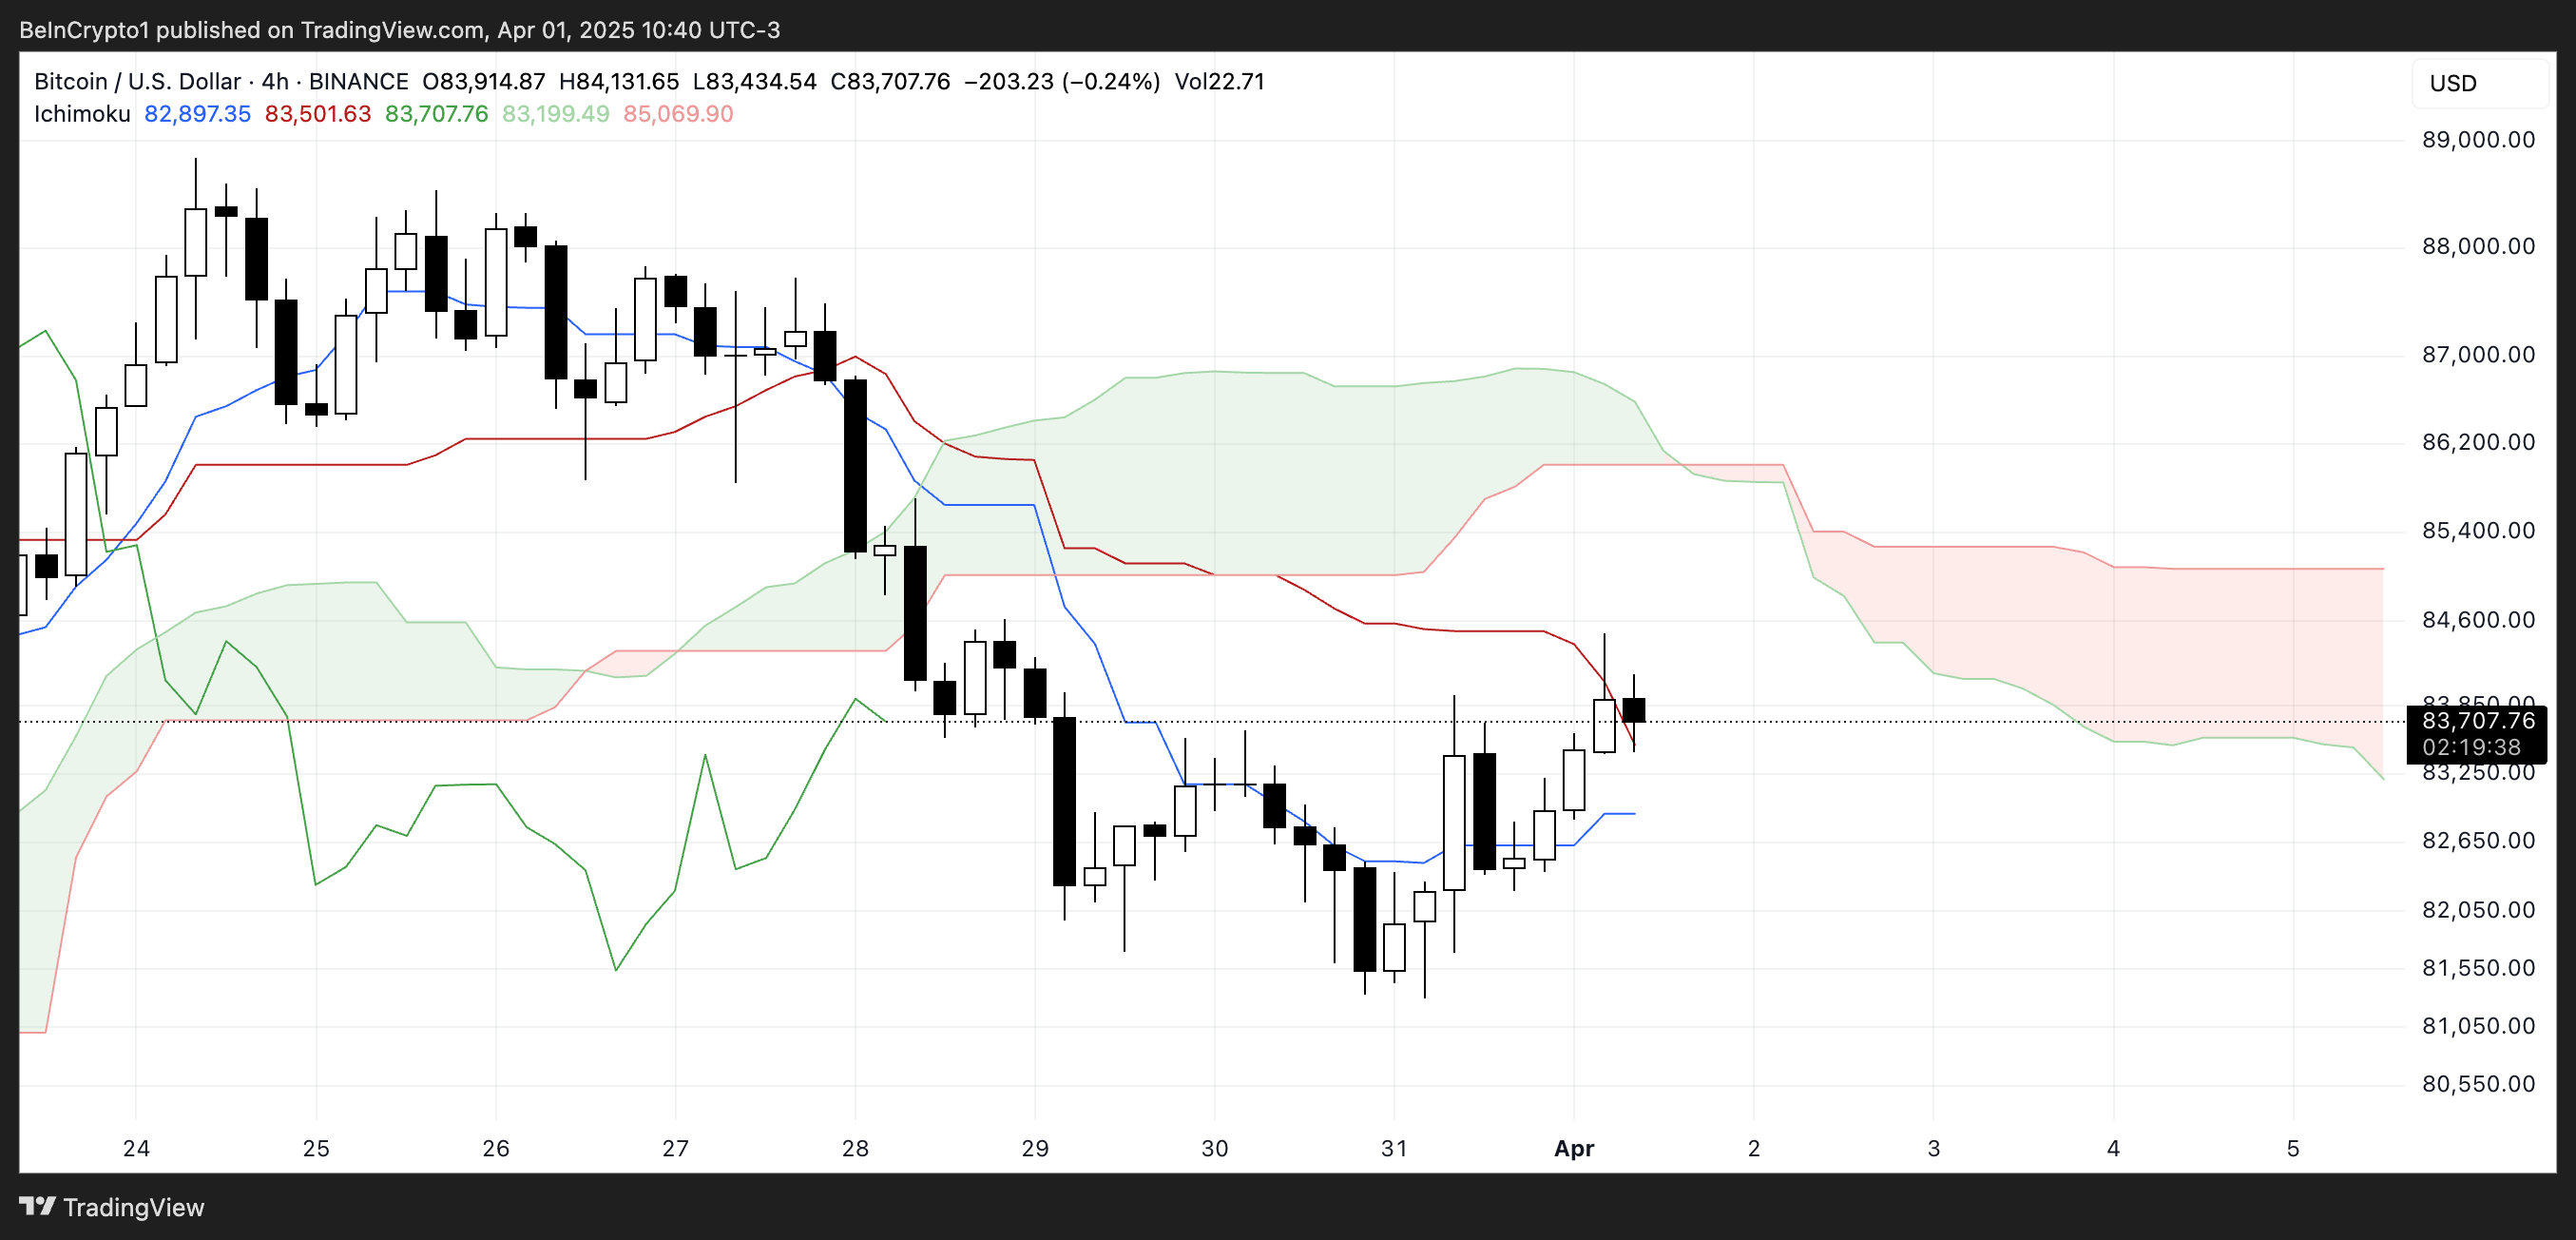 BTC Ichimoku Cloud. Source: TradingView.
However, the price has briefly pushed into the cloud’s lower boundary, indicating a potential challenge to the bearish structure.
For a stronger trend reversal signal, Bitcoin would need to break above the cloud and see a bullish Kumo twist form. Until then, the Ichimoku setup shows a cautious recovery at best.
Liberation Day Could Strongly Influence Bitcoin Price
Bitcoin’s EMA lines remain bearish. Its shorter-term averages are still below the longer-term ones, an indication that downward momentum persists.
This setup suggests sellers continue to control the trend, and unless reversed, Bitcoin price could revisit key support zones. If the current downtrend accelerates, it may first test support around $81,169. If that level fails to hold, deeper drops toward $79,069 or even $76,643 could follow.
Nic Puckrin, crypto analyst and founder of The Coin Bureau told BeInCrypto the market’s heightened uncertainty ahead of the so-called “Liberation Day” tariffs. He notes that Bitcoin is equally positioned for a sharp move in either direction. It could possibly dip to $73,000 or surging toward $88,000:
“As Liberation Day approaches, the uncertainty around the magnitude of the tariffs is keeping Bitcoin and other risk assets in limbo. (…) Until there is more clarity around tariffs, this range-bound pattern will continue, but if we get softer news than feared or some sort of concessions, we could see a breakout from the current trading pattern. If we do, $88,000 is the level to watch in the short term, but we would need to see a marked increase in volume for this to indicate an extended rally.”
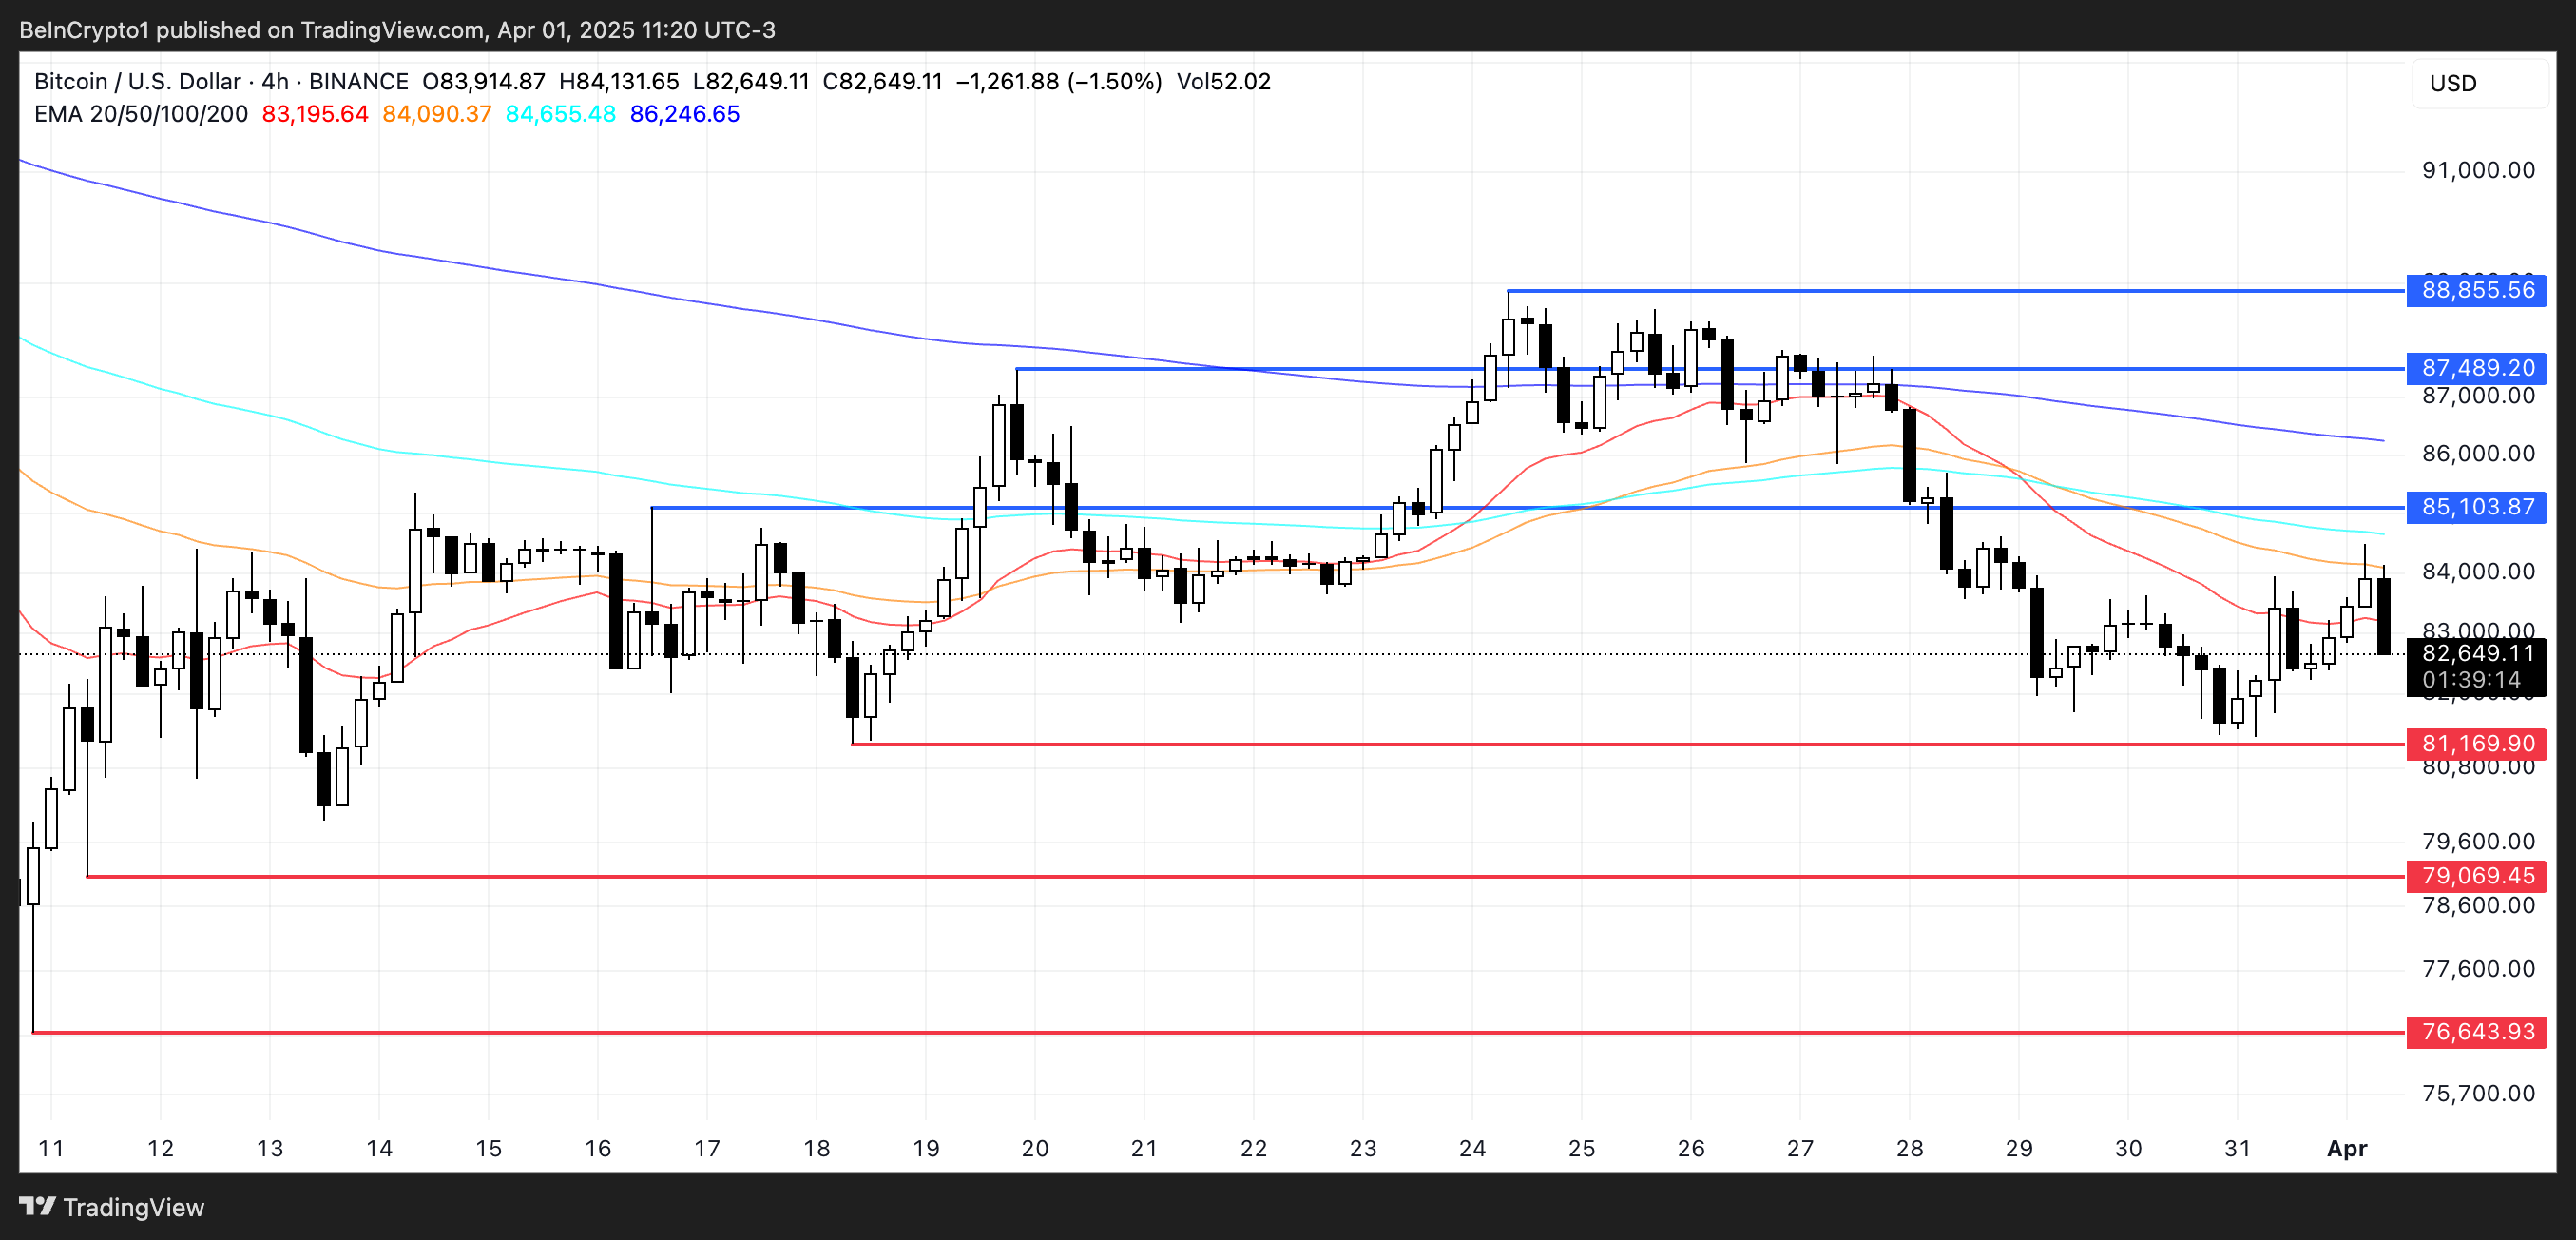 BTC Price Analysis. Source: TradingView.
He defends that a tariff shock could make BTC test levels around $73,000:
“If there is a tariffs shock, conversely, we could see BTC breaking down toward $79,000 in the short term, or even further down to the next support level at $73,000 if extreme fear grips markets.“ – Nic told BeInCrypto.
Still, if Bitcoin manages to flip the trend and gain upward momentum, a climb toward resistance at $85,103 would be the first target. Breaking above that could open the path to higher levels at $87,489 and $88,855.
0
0


 Manage all your crypto, NFT and DeFi from one place
Securely connect the portfolio you’re using to start.


