Bitcoin Price Struggles Near $111K After ETF Recovery – Analysts Warn of Weak Support

0
0
The BTC USD price is continuing to struggle, despite the ETF recovery pushing the Bitcoin price back up to $111,000. Now, analysts are warning of weak support.
Bitcoin hovered near $111,000 on Thursday after another round of withdrawals from US spot bitcoin ETFs. About $100 million flowed out of the funds over the past day, reviving concerns that institutional demand may be losing steam.
According to Coingecko data, Bitcoin fluctuated between $106,800 and $110,300 during the session, with the last trade at $110,700.
The narrow range keeps the asset close to the $107,000 zone, which many analysts view as critical short-term support.
A clear drop below that level could open the door to deeper losses, while a rebound above $112,000 would signal renewed buying strength.
Why Are Spot Bitcoin ETFs Seeing Persistent Withdrawals?
US spot Bitcoin ETFs saw roughly $101.4 million in net outflows in October 2022, marking another weak day for institutional demand.
According to Farside data, BlackRock’s IBIT still posted an estimated $73.6M in inflows, but those gains were erased by heavy withdrawals elsewhere, including about $56.6 million from Fidelity’s FBTC.
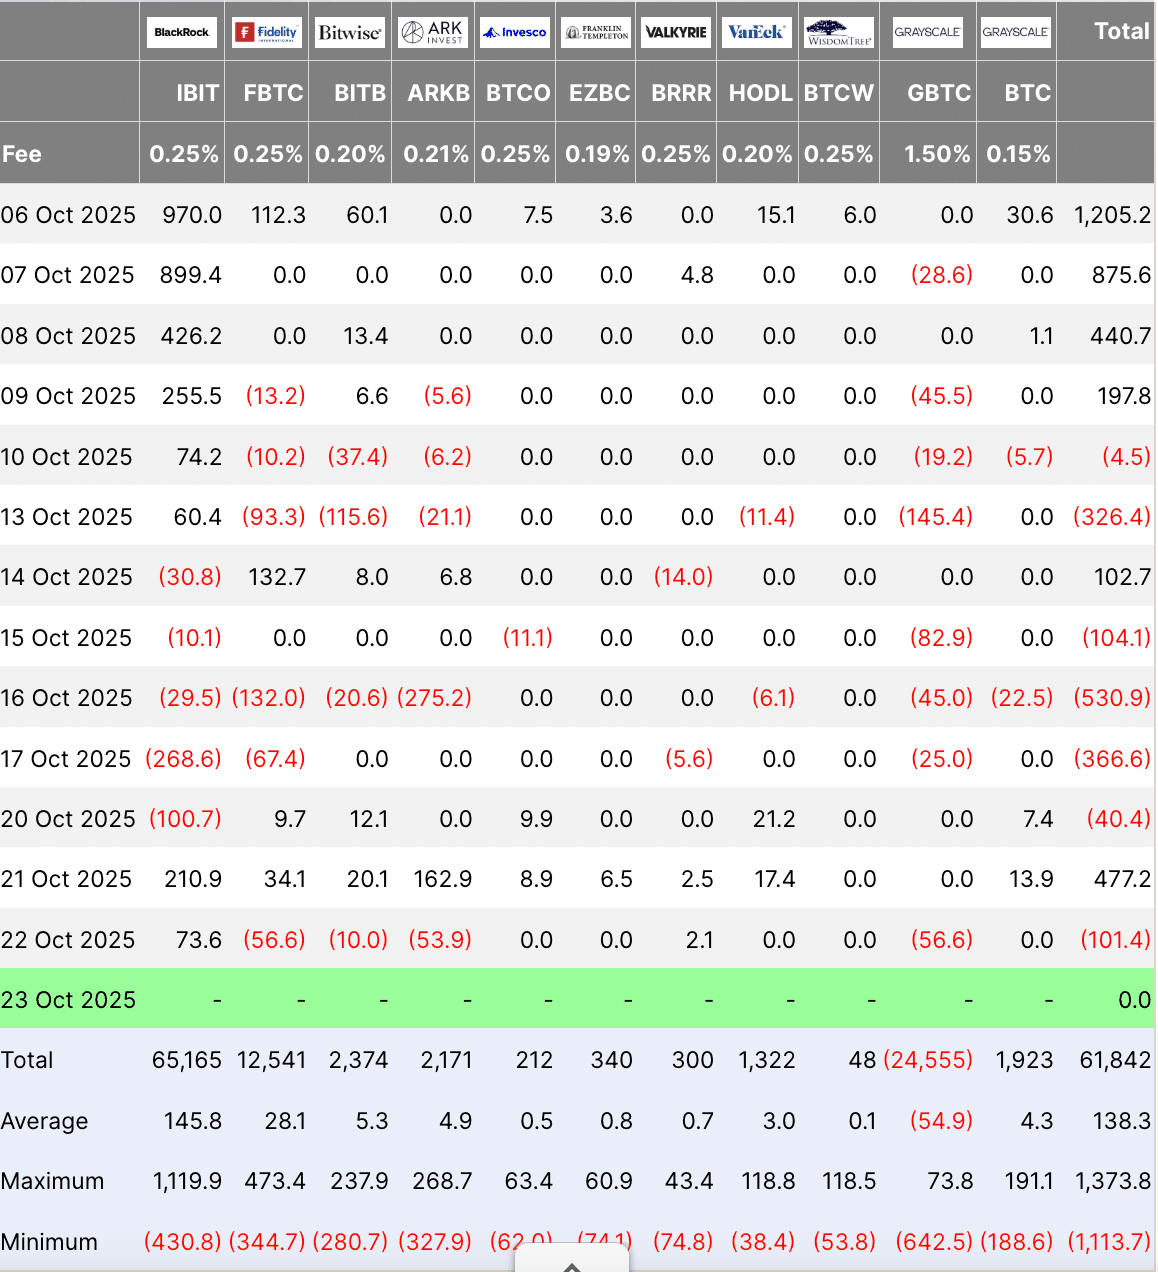
The uneven flow highlights how fragile sentiment remains after last week’s deeper redemptions.
Analysts at Bitfinex have warned that the $107,000–$108,000 price range has become shaky, noting that large buyers have largely stayed out during this correction.
Between October 13 and 17, spot Bitcoin ETFs shed over $1.23 billion, indicating an apparent decline in investor appetite.
On-chain data from CryptoQuant indicates that the 3-6 month UTXO realized price is near $108,300, a key mid-term support area.

Glassnode’s data adds that Bitcoin now trades below both the short-term holders’ cost basis ($113,100) and the 0.85 quantile level ($108,600).
These thresholds have often marked the start of mid-term bearish periods.
Options data points to a more defensive market. Traders are loading up on puts to hedge against more downside, pushing implied volatility higher.
A Market Hedged in Fear
Bitcoin trading below key cost basis levels signals demand exhaustion. Long-term holders are selling into strength, while rising put demand and higher volatility show a defensive market.
Read the full Week On-Chain below
https://t.co/2aZJU8meBX pic.twitter.com/ze4EowUPwh
— glassnode (@glassnode) October 22, 2025
Open interest also remains near record levels, a sign of nervousness across the board.
EXPLORE: The 12+ Hottest Crypto Presales to Buy Right Now
Bitcoin Price Prediction: Is the Market in a Wyckoff Accumulation Phase?
According to crypto analyst Gordon, Bitcoin may be building strength for its next move. He believes the recent pullback fits within a broader accumulation phase.
Imagine being bearish when $BTC is going through an accumulation phase.
Panic sellers now will be panic buyers in a few months. pic.twitter.com/CIOtFibWyC
— Gordon (@AltcoinGordon) October 23, 2025
“Imagine being bearish when $BTC is going through an accumulation phase. Panic sellers now will be panic buyers in a few months,” he said.
Gordon’s 12-hour BTC/USDT chart outlines a textbook Wyckoff re-accumulation structure. It maps out each stage from Preliminary Support (Psy) to the Spring and Test phase.

Bitcoin has reached a Selling Climax (SC) of roughly $106,500 and has since recovered, currently ranging between $107,000 and $111,000.
This range exercise is an indication that spring may be setting up a breakout that is frequently anticipated.
The second major opposition is between $123,000 and $125,000, close to the Automatic Rally (AR) and Secondary Test (ST) levels.
When Bitcoin rises above $112,000, this could mark the beginning of the Markup Phase, which typically indicates that bullish momentum is developing.
The setup is indicative of a probable reaccumulation process, in which long-term holders further buy as short-term traders exit.
Provided that the Wyckoff construction remains firm, Bitcoin could be accumulating towards a medium-term recovery in the range of $120,000-$126,000.
Crypto analyst Titan of Crypto published a weekly chart indicating that the long-term parabolic trend of Bitcoin is still in effect and that it has recorded consistent bullish dynamics despite its recent fluctuations.
The curve connects a sequence of higher lows extending from the beginning of 2023 to the end of 2025, indicating that the larger uptrend remains intact.

Each retest of the curve has sparked renewed buying and sharp recoveries.
The latest rebound between $105,000 and $110,000 mirrors earlier support reactions, adding weight to the view that Bitcoin’s parabolic structure continues to hold.
Bitcoin’s price structure continues to reflect a parabolic trend, one where each rebound starts from a higher base.
This pattern indicates that momentum is still building as long as the price remains above the rising curve. If that support were to break, it could mark a change in sentiment.
However, if the curve holds, Bitcoin may continue to climb toward the $140,000 to $150,000 range.
EXPLORE: Next 1000X Crypto – Here’s 10+ Crypto Tokens That Can Hit 1000x This Year
The post Bitcoin Price Struggles Near $111K After ETF Recovery – Analysts Warn of Weak Support appeared first on 99Bitcoins.
0
0

 Manage all your crypto, NFT and DeFi from one place
Securely connect the portfolio you’re using to start.


0
0

