HBAR Faces Final Hurdle After Explosive Rally; Are Bulls Tiring Out?

0
0
After rallying more than 28% over the past week, HBAR is now staring at a major resistance level, raising a critical question: Can the bulls keep this run alive, or is exhaustion setting in?
The push came shortly after HBAR was added to Grayscale’s Smart Contract Fund, a move that stirred new optimism and volume. But HBAR price is now hovering around the $0.20430 mark, a technically significant level tied to recent Fibonacci extensions, and momentum appears to be slowing, at least on the surface.
Bull Power and Netflows Still Favor the Upside
On-chain metrics, however, tell a more nuanced story. The Elder-Ray Bull Power Index, which gauges the strength of buyers over sellers, has ticked up four days in a row. This suggests that despite some visible wicks on recent candles (sellers taking profit), bullish conviction remains in play.
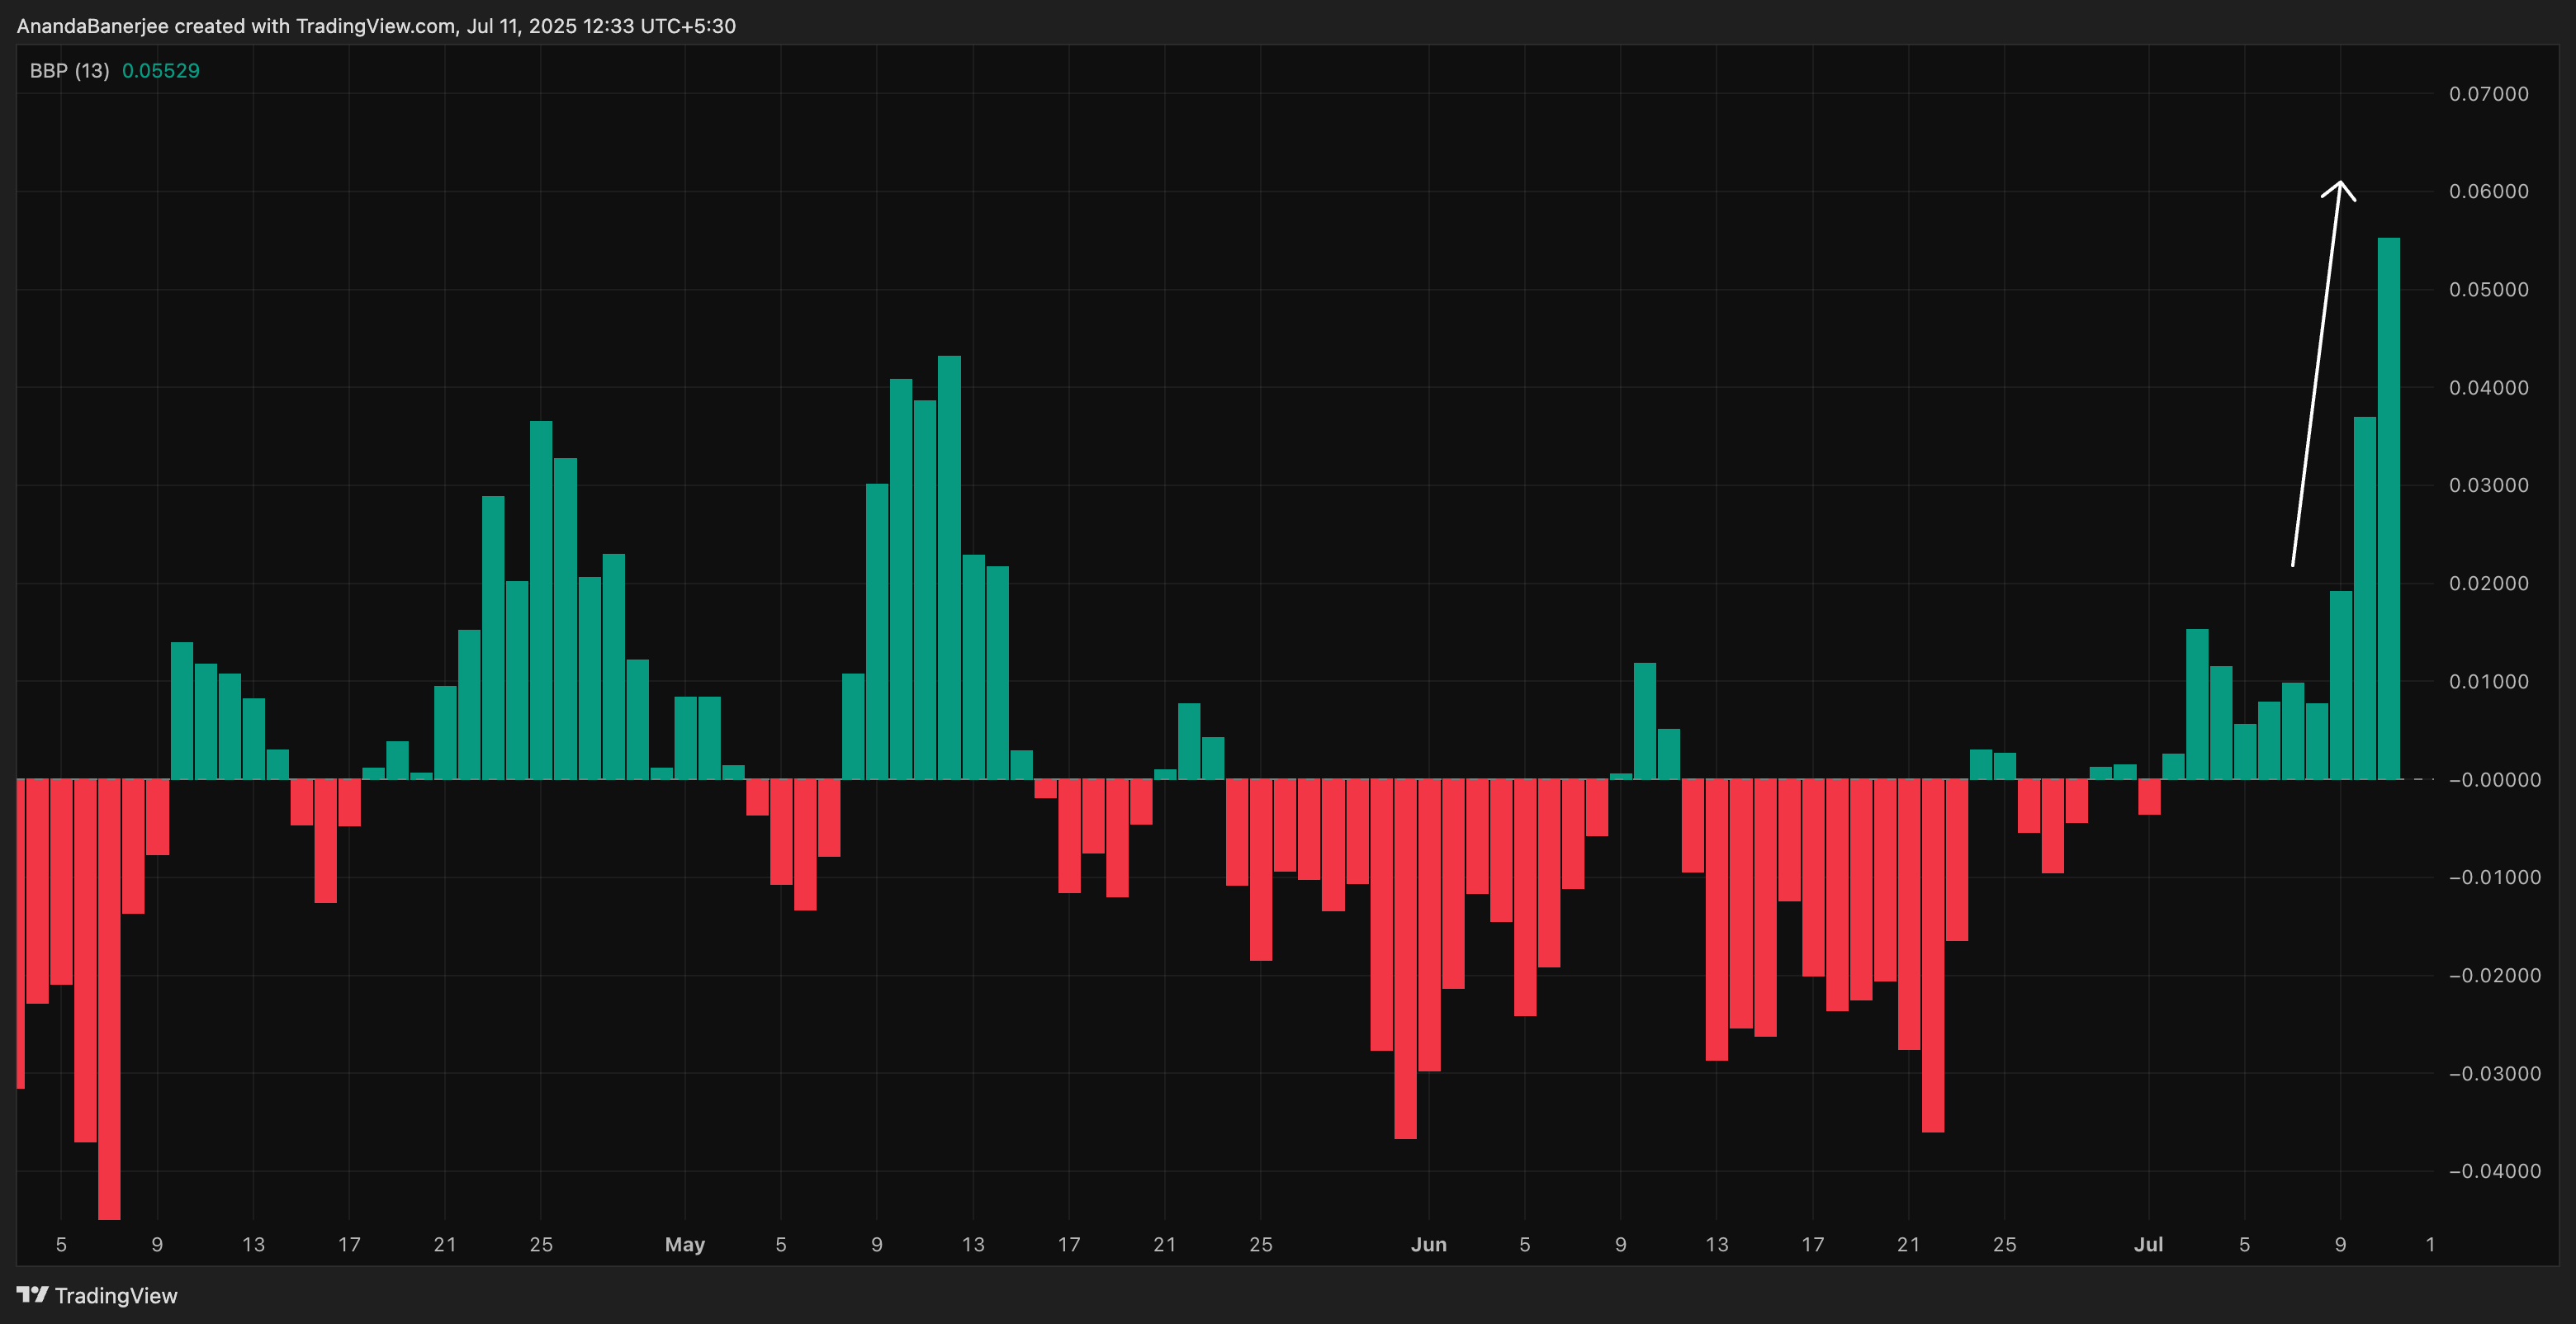 Bulls are in charge of the HBAR price for now: TradingView
Meanwhile, exchange netflows confirm a cooling off in weekly outflows. While earlier rallies were accompanied by sharp exits from whales and short-term holders, the pace has now moderated, typically a sign that fewer traders are rushing to lock in profits at current levels. It’s not a wave of accumulation, but it does indicate that selling pressure is no longer massive.
 HBAR price and outflows: Coinglass
Open Interest Signals Market Confidence
Perhaps the most telling bullish sign comes from Open Interest, which tracks the number of open futures contracts. A sustained rise here typically means new money is entering the market, not exiting. Right now, the OI uptrend suggests traders are still betting on more upside — or at the very least, not ready to fade this move yet.
 HBAR price and Open Interest: Coinglass
How’s the HBAR Price Action Looking?
This structural backdrop is reinforced by the standard Fibonacci indicator, with levels drawn from the last $0.12540 swing low to the $0.22867 high. The previous swing levels were used as the latest swing is currently under development. Price is now pressing against the 0.618 level at $0.20430; a level HBAR hasn’t managed to cross recently.
A move above $0.20430 can take HBAR to $0.22867, the previous swing high. HBAR price is currently trading at $0.19914, closer to this key zone.
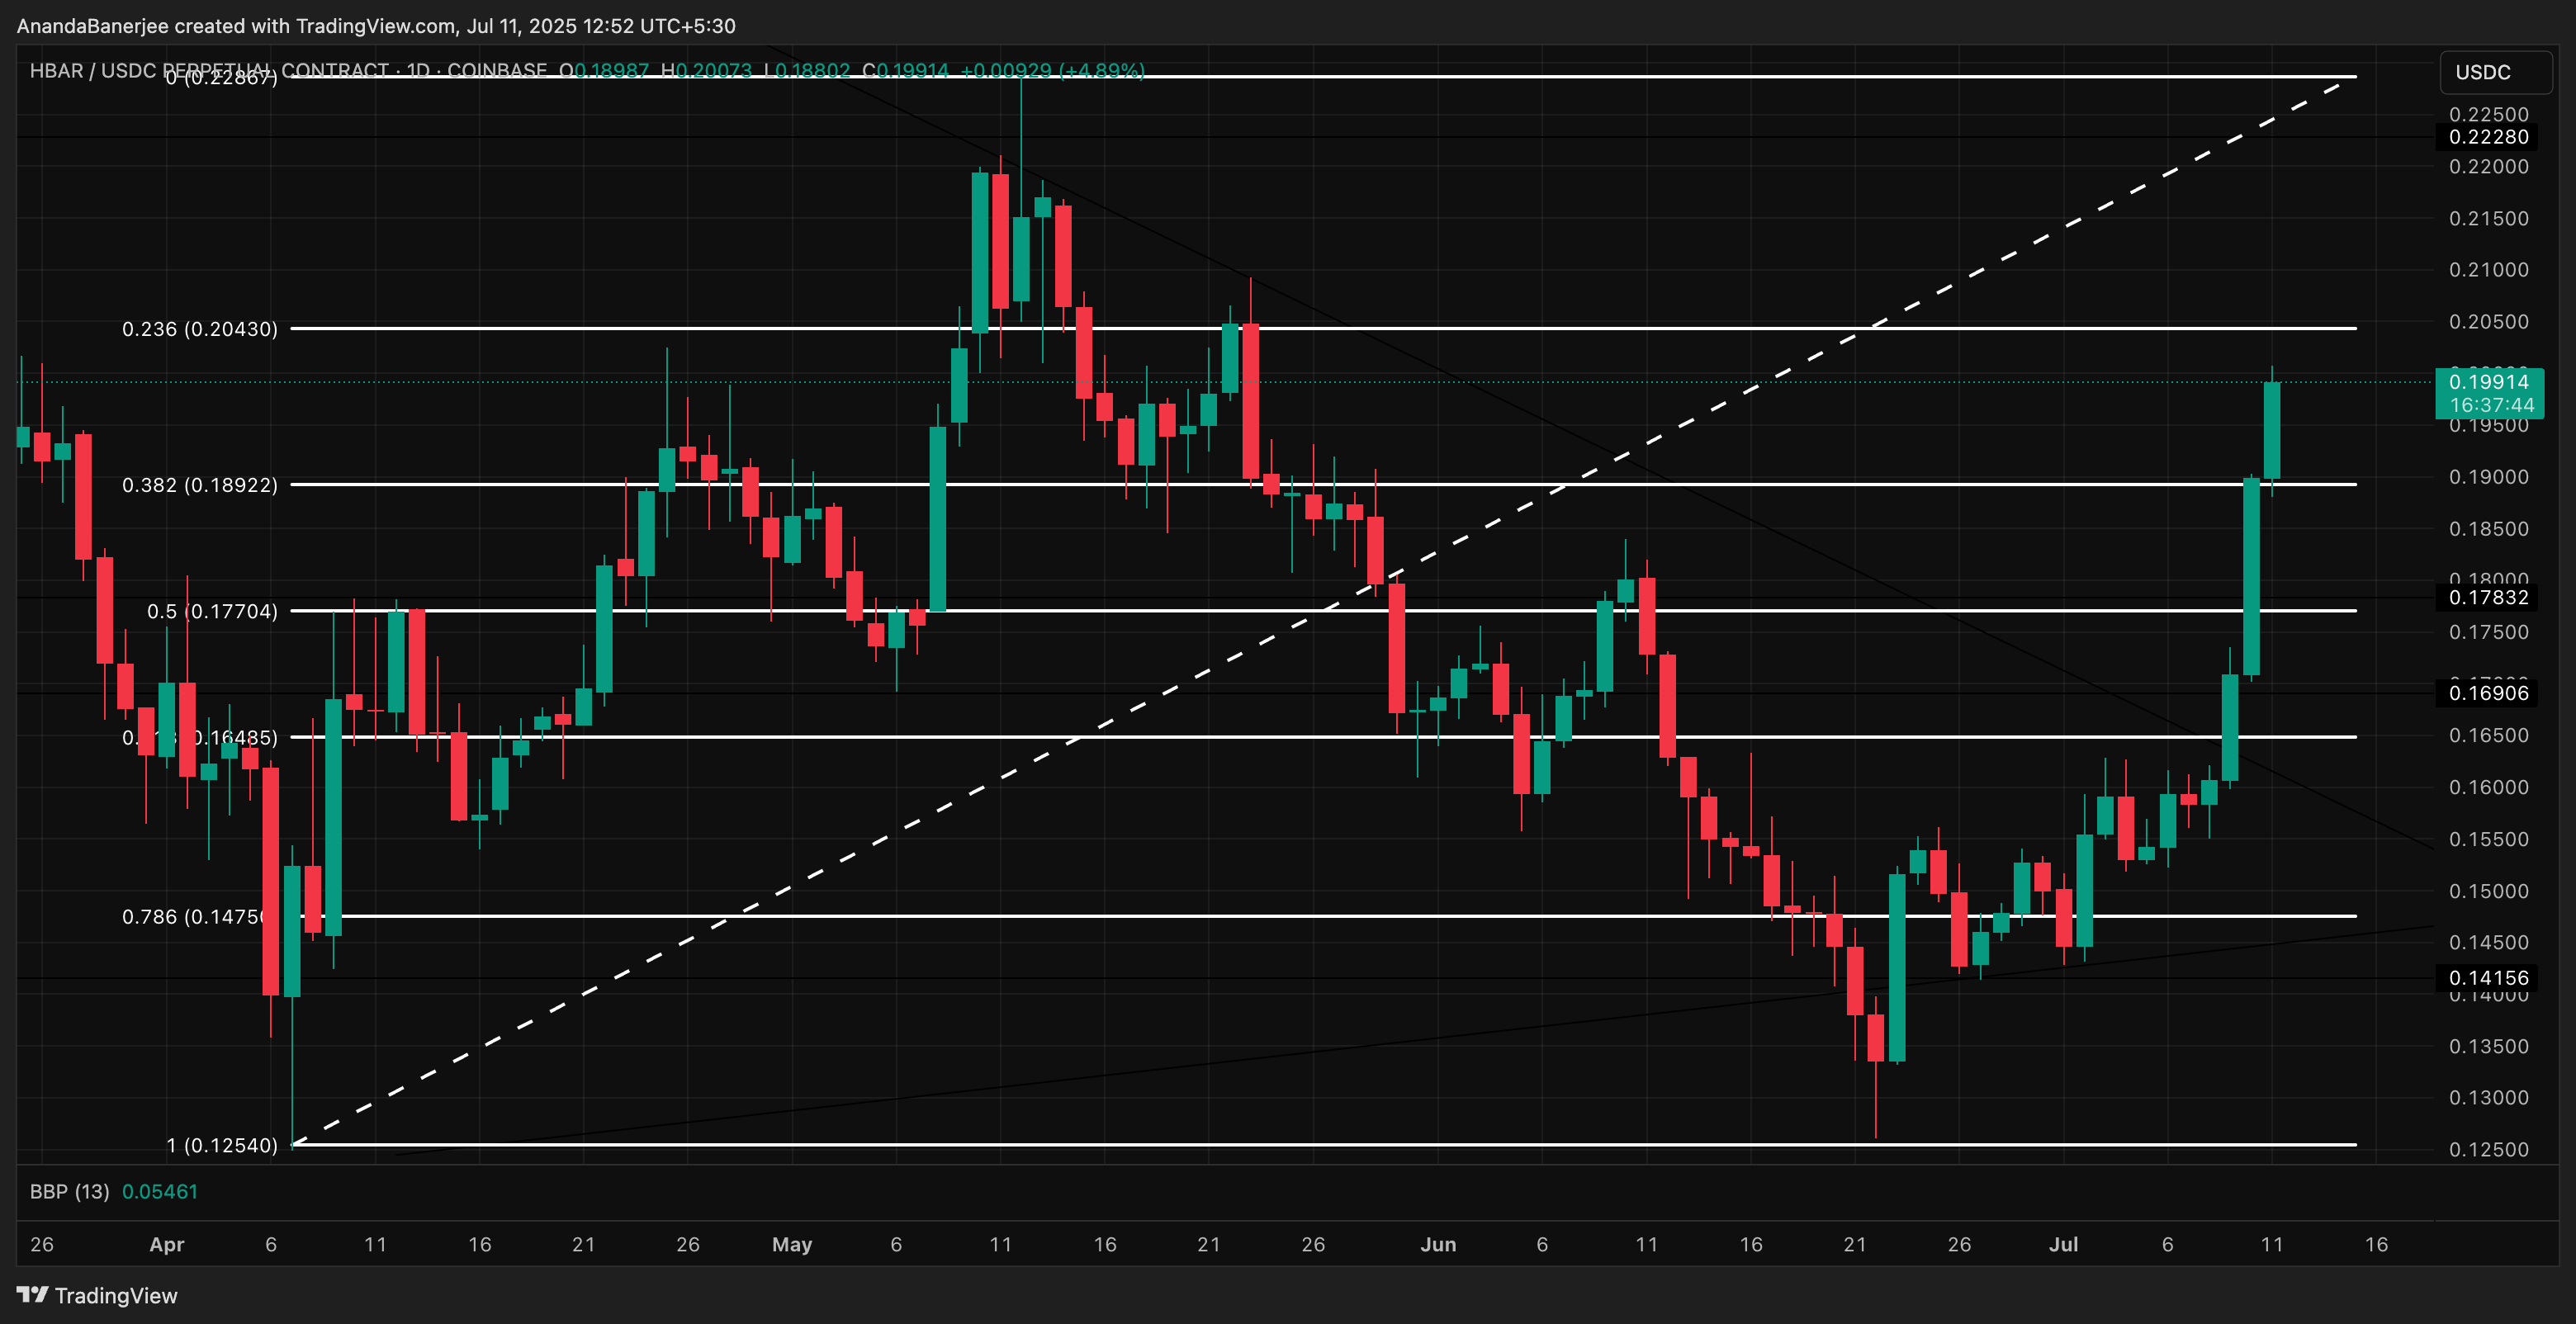 HBAR price analysis: TradingView
Zooming in, the daily chart shows a mix of momentum and hesitation. The previous two green candles had strong bodies and minimal wicks, classic signs of trend strength. But the latest daily candle reveals a long upper wick (under formation), hinting at rejection and potential exhaustion.
Longer wicks simply mean that bulls are tiring out!
If this candle closes with a longish upper wick, it could mark a short-term local top. If the wick fizzles out, we can expect the trend to continue.
A failure to close convincingly above $0.20430 would validate that exhaustion and likely push HBAR back toward the $0.17704–$0.16485 support zone, invalidating the current bullish trend.
0
0


 Manage all your crypto, NFT and DeFi from one place
Securely connect the portfolio you’re using to start.


