Decoding the Crypto Fear and Greed Index: Why 71 in ‘Greed’ Zone Signals Caution

0
0
BitcoinWorld
Decoding the Crypto Fear and Greed Index: Why 71 in ‘Greed’ Zone Signals Caution
Navigating the volatile world of digital assets requires more than just watching charts; understanding the collective mood of the market is crucial. This is where the Crypto Fear and Greed Index comes into play, offering a snapshot of prevailing crypto market sentiment.
Understanding the Crypto Fear and Greed Index
Provided by Alternative, the Crypto Fear & Greed Index is a unique tool designed to measure the emotional state of the cryptocurrency market. Emotions like fear can lead to impulsive selling, while greed can push investors towards buying sprees, potentially leading to market bubbles. By quantifying these emotions, the index aims to help investors make more informed decisions rather than being swayed purely by sentiment.
The index operates on a simple scale from 0 to 100:
- 0-24: Extreme Fear – Indicates significant undervaluation and potential buying opportunities.
- 25-49: Fear – Suggests market participants are worried, potentially suppressing prices.
- 50: Neutral – The market is balanced between fear and greed.
- 51-74: Greed – Points to increasing optimism and potentially overvalued conditions.
- 75-100: Extreme Greed – Often signals a market top or bubble, where a correction might be imminent.
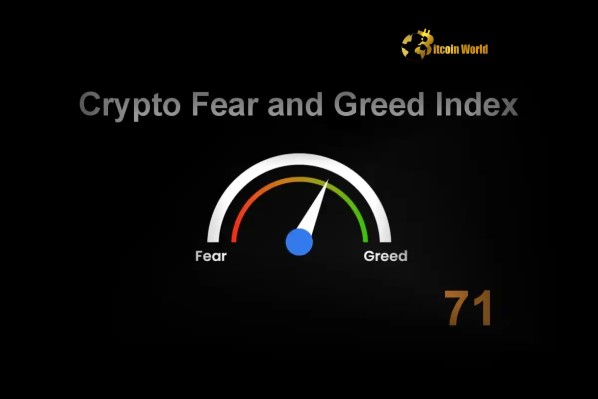
As of May 28th, the index stands at 71, firmly placing it in the ‘Greed’ zone, although it saw a slight dip of three points from the previous day. This suggests that while optimism remains high, there might be a minor cooling or consolidation occurring.
What Factors Influence the Index?
The index is not based on a single metric but aggregates data from six key factors, each weighted differently to provide a comprehensive view of cryptocurrency news and sentiment:
- Volatility (25%): Measures the current volatility and max drawdown of Bitcoin compared to its average values over the last 30 and 90 days. Higher volatility driven by price pumps often indicates a greedy market.
- Market Momentum/Volume (25%): Compares the current volume and market momentum (price action) to average values. High buying volume in a positive market suggests greedy or bullish behavior.
- Social Media (15%): Analyzes specific hashtags and sentiment analysis on platforms like Twitter. High engagement and positive sentiment around certain coins can indicate growing greed.
- Surveys (15%): Gathers data from weekly sentiment surveys (currently paused). This factor captures direct opinions from market participants.
- Bitcoin Dominance (10%): Measures Bitcoin’s share of the total crypto market cap. Rising Bitcoin dominance can sometimes signal fear (as investors move to the perceived safety of BTC) or, conversely, increasing greed (as BTC leads a bull run).
- Google Trends (10%): Looks at search queries related to Bitcoin and other cryptocurrencies. Spikes in search terms like “Bitcoin price manipulation” or “Bitcoin bubble” can indicate fear, while terms like “buy Bitcoin” or specific altcoin searches can signal greed.
Interpreting ‘Greed’ at 71: What Does it Mean for the Market?
A reading of 71 signifies that market participants are generally optimistic and confident. In the context of Bitcoin price and other cryptocurrencies, this level of greed can indicate several things:
- Bullish Momentum: Prices have likely been trending upwards, fueling positive sentiment.
- Increased Buying Pressure: More people are willing to buy, potentially even at higher prices, driven by fear of missing out (FOMO).
- Potential for Correction: Historically, periods of extreme greed have often preceded market pullbacks or corrections. A high reading suggests the market might be getting ahead of itself.
The slight drop from 74 to 71 could suggest a minor pause in this upward sentiment, perhaps due to short-term price fluctuations or specific news events. It’s a reminder that sentiment can shift quickly.
How Can the Crypto Fear and Greed Index Inform Your Investing Strategy?
While the index is a valuable sentiment tool, it should not be the sole basis for your investing strategy. Think of it as a complementary indicator:
- Contrarian Approach: Some investors use the index contrarianly – buying during extreme fear (when prices are low) and considering selling or reducing positions during extreme greed (when prices are high). A reading of 71 is in the ‘Greed’ zone, suggesting caution might be warranted rather than aggressive buying.
- Confirmation Tool: Use the index to confirm signals from other analysis methods (e.g., technical analysis, fundamental analysis). If technical indicators suggest a potential pullback and the index shows high greed, it strengthens the case for caution.
- Risk Management: A high greed score can be a reminder to manage risk, perhaps by taking some profits, setting stop-losses, or avoiding over-leveraging.
It’s crucial to remember that the crypto market is influenced by numerous factors, and sentiment is just one piece of the puzzle. Economic news, regulatory developments, technological advancements, and global events all play significant roles.
Challenges and Limitations
No single indicator is perfect. The Crypto Fear & Greed Index has its limitations:
- Lagging Indicator: Sentiment often follows price action rather than predicting it perfectly.
- Simplification: It boils down complex market dynamics into a single number.
- Data Sources: The weighting and specific data sources used by Alternative are proprietary, making it difficult to independently verify its accuracy or anticipate shifts.
- Not a Crystal Ball: A high greed score doesn’t guarantee a crash, just as extreme fear doesn’t guarantee a bottom.
Conclusion: Staying Informed in a Greedy Market
The Crypto Fear & Greed Index currently sitting at 71 in the ‘Greed’ zone reflects a market buoyed by optimism and positive momentum. While this can be encouraging for holders, it also serves as a valuable reminder to approach the market with prudence. High levels of greed have historically coincided with periods where market corrections become more likely. By understanding the factors that drive the index and using it in conjunction with other analysis tools, investors can better navigate the emotional tides of the crypto market and refine their investing strategy. Stay informed, stay analytical, and avoid letting pure emotion dictate your decisions.
To learn more about the latest crypto market trends, explore our article on key developments shaping Bitcoin price action.
This post Decoding the Crypto Fear and Greed Index: Why 71 in ‘Greed’ Zone Signals Caution first appeared on BitcoinWorld and is written by Editorial Team
0
0
 Manage all your crypto, NFT and DeFi from one place
Securely connect the portfolio you’re using to start.


0
0