Ethereum Overtakes Bitcoin in Crypto Derivatives Market with $111B in Contract Volume

0
0
Ethereum ETH $2 788 24h volatility: 4.1% Market cap: $336.87 B Vol. 24h: $33.96 B has broken out of a month-long consolidation phase, sustainably closing above the key $2,700 resistance level. At the time of writing, ETH is trading around $2,794, marking a 5% gain in the past 24 hours.
The cryptocurrency’s 24-hour trading volume has jumped by over 40% to $33.67 billion, reflecting renewed interest in the market.
This surge comes as Ethereum overtakes Bitcoin in terms of contract trading volume. Data suggests that ETH contract volume soared past $111 billion in the last 24 hours, eclipsing BTC’s $87.5 billion.
ETH’s liquidation volume has also hit $131 million, more than twice the amount seen in Bitcoin, suggesting increased leveraged trading activity around Ethereum.
Additionally, the Ethereum network recorded a new all-time high of 17.4 million unique addresses earlier this month. Growthepie noted an over 70% rise in ETH addresses interacting across chains since the beginning of Q2.
Institutional and whale accumulation has played a major role in Ethereum’s price surge. On-chain data reveals that wallet address 0xc097 withdrew 13,037 ETH worth around $35.5 million from Binance within the last 24 hours.
Whales are accumulating $ETH.
Whale 0xc097 withdrew 13,037 $ETH($35.5M) from #Binance in the past 24 hours.
Abraxas Capital withdrew 44,612 $ETH($123M) from #Binance and #Kraken in the past 14 hours.https://t.co/vZTxLPd2zqhttps://t.co/Ba4gK9aZIc pic.twitter.com/Lx0NSHzXt2
— Lookonchain (@lookonchain) June 11, 2025
Moreover, crypto hedge fund Abraxas Capital recently pulled 44,612 ETH (roughly $123 million) from both Binance and Kraken.
ETH Price Outlook
On the daily ETH chart, the price has decisively broken above its upper Bollinger Band near $2,782, a bullish signal suggesting strong upward momentum. The Bollinger Bands are also widening, indicating potential for further gains.
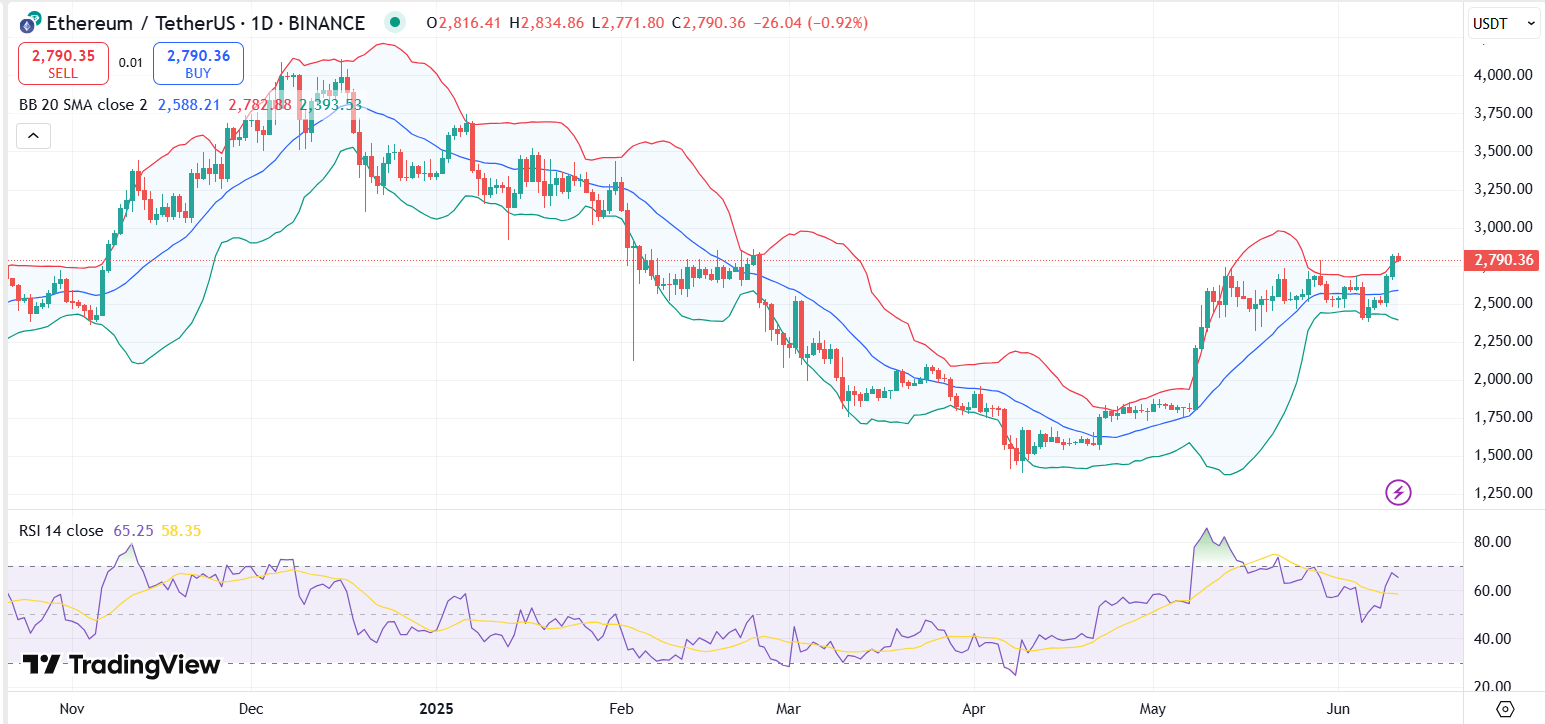
ETH price chart with RSI and Bollinger Bands | Source: TradingView
The RSI currently sits around 65.25, close to overbought territory but it is not signaling exhaustion yet. If the bullish trend continues, immediate resistance lies at $2,835, followed by the psychological barrier of $3,000.
Meanwhile, MACD shows a bullish crossover above the signal line, with the histogram flipping positive. This indicates a favorable trend for bulls.
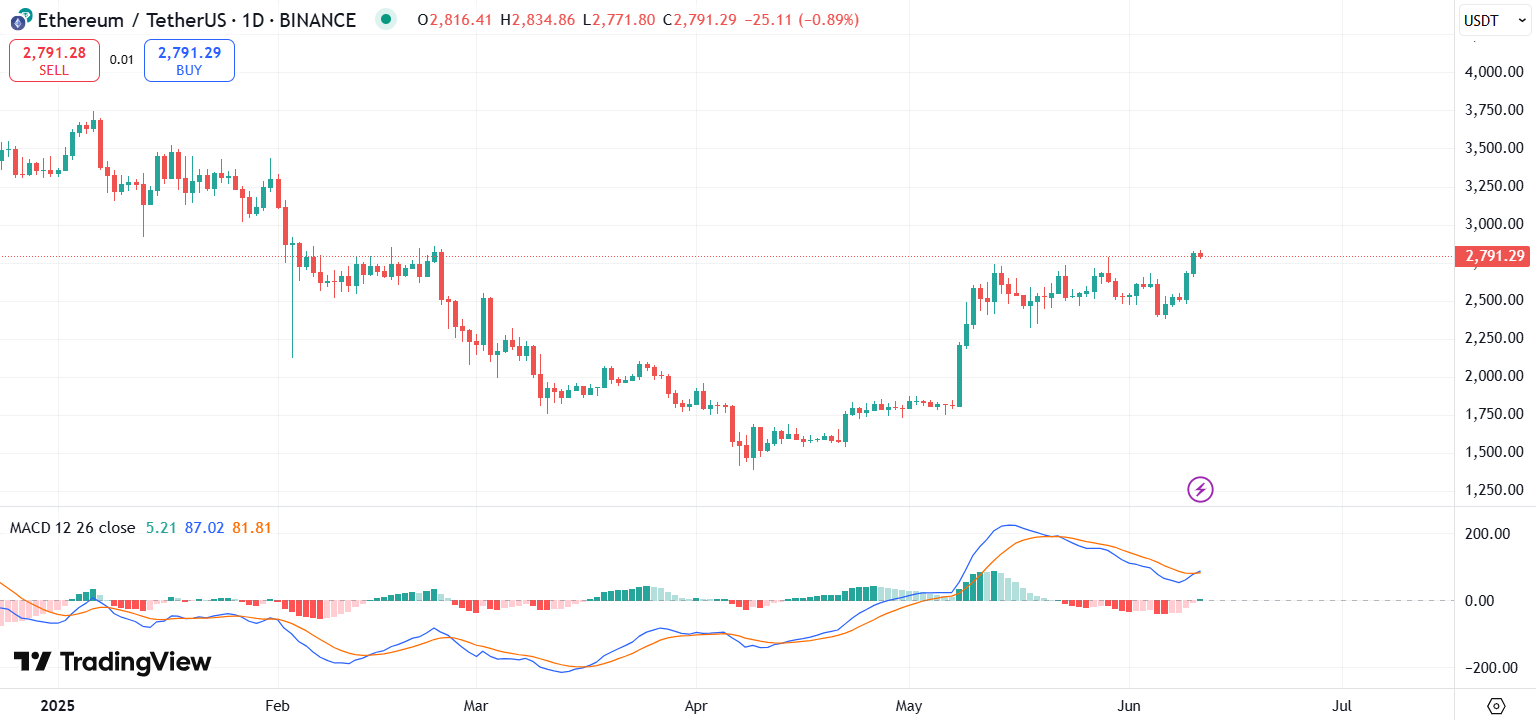
ETH price chart with MACD | Source: TradingView
However, traders should keep an eye on any signs of weakening momentum or resistance near overbought levels. In case of a price drop, immediate support is seen at $2,585 near the 20-day SMA.
Popular crypto trader Merlijn recently stated on X that ETH is back in “beast mode.”
Ethereum is back in beast mode.$ETH smashed through $1.5K and $2.2K like paper.
Now it’s staring down $4K.Next stop? Price discovery.
$10K isn’t a dream it’s a setup. pic.twitter.com/ldU1wLFeVx
— Merlijn The Trader (@MerlijnTrader) June 10, 2025
He predicted that the second-largest cryptocurrency could surge to $4,000 and even $10,000 in the long run.
The post Ethereum Overtakes Bitcoin in Crypto Derivatives Market with $111B in Contract Volume appeared first on Coinspeaker.
0
0


 Manage all your crypto, NFT and DeFi from one place
Securely connect the portfolio you’re using to start.

0
0


