Will PEPE Price Breakout Soon, Technicals Flash Bullish Formation?

0
0

PEPE coin price showed several signs of a possible breakout, technical patterns turned bullish, and whale activity increased at press time. Traders and analysts were closely watching this meme coin’s price movement.
Pepe price has started to trend upward. A breakout above key resistance zones could drive the token to new price levels.
Technical Indicators Near Overbought Zone as Market Watches Key Levels
PEPE price has displayed gains on the price charts in recent days. The RSI is moving towards the overbought region. The RSI of the 4-hourly chart has hit 62, and it is near 70 levels, which most traders use for reversal signals.
This index is usually above 70, and if it moves beyond that figure, it means an overbought zone. So, factors that lead to a correction may kick in.
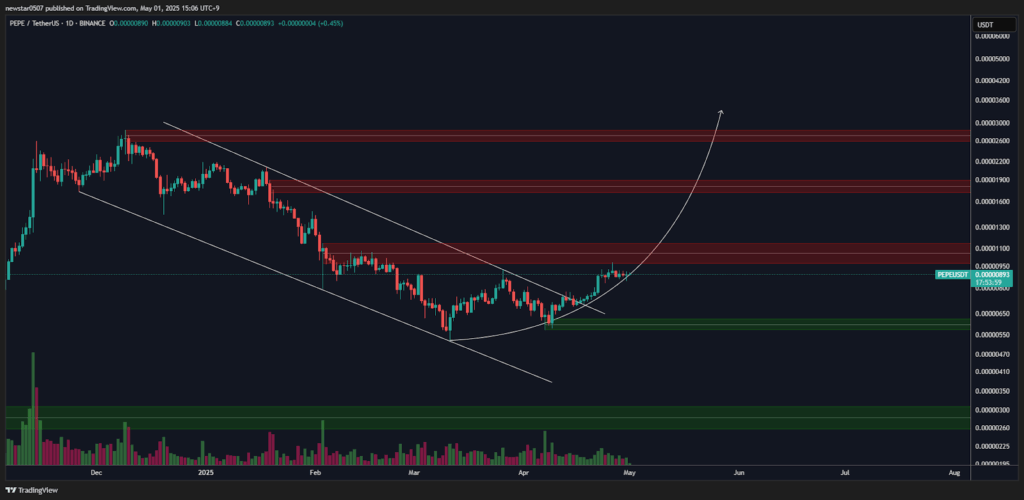
However, the daily bar reveals that there are consistently active demand-side activities. PEPE has set up the support around $0.00000041 – $0.00000065. This area has been retested several times.
The same chart showed several levels of resistance above the support. Those levels include $0.00000095 and $0.00000110 to $0.00000130. So, if a clean break occurs at $0.00000950, there will be enthusiasm towards $0.000010 and above.
On the other hand, a breakdown of the price below $0.00000850 may be interpreted as a sign of weakness. It would challenge the bullish setup, especially if sentiments on the wider market turn negative.
However, all technical patterns remained well, and the market participants awaited confirmation of the next levels of resistance.
Short Liquidation and Rising Volume Suggest Growing Bullish Pressure
CoinGlass liquidation data showed a shift in trading behavior over the past few weeks. From February to April, the market experienced lower overall liquidations.
During the last week of April, a steady price climb has triggered minor but consistent short liquidations. Such events occur when short sellers are forced to exit as the price rises.
This pattern supports the bullish case, as short squeezes can accelerate upside moves. Increasing buy-side volume suggests that buyers are regaining control. PEPE’s trading volume surged 18% in the past 24 hours, reaching $1.2 billion. Binance accounted for about 35% of the global activity.

Notably, a whale recently withdrew 1.5 trillion PEPE coins from Binance, equal to around $13.3 million. This activity reduced the available supply on the exchange and likely contributed to the price increase.
LookOnChain reported that the withdrawal came from a wallet holding around $147 million in assets.
Retail traders responded quickly to the whale move, with PEPE/USDT buy orders rising by 15% in just two hours.
Binance’s total PEPE holdings dropped by 7% after that transaction. A decrease in exchange reserves typically points to a holding strategy, which may reduce immediate selling pressure.
Bullish PEPE Chart Patterns Strengthen the Case for an Uptrend
PEPE price has broken out of a falling wedge pattern, regarded as a bullish reversal setup. This breakout was confirmed by a close above the wedge’s upper resistance line.
Following this move, a rounded bottom formation began to form, signaling a shift from a downtrend to a potential uptrend.
These formations suggest growing buyer accumulation over time. The rounded bottom also indicated that price action was stabilizing before a possible move higher.
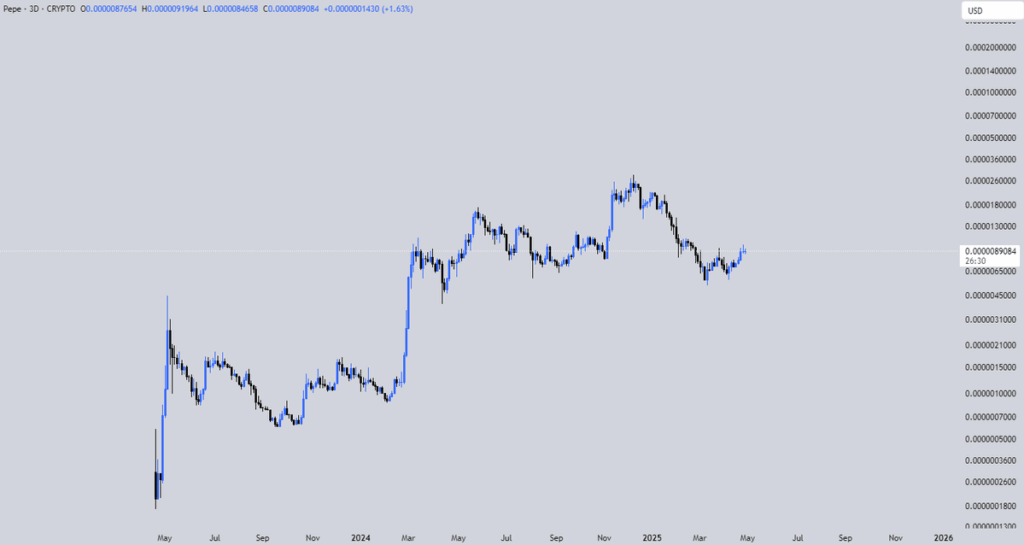
Short-term targets were set between $0.00000095 and $0.00000110, with mid-term goals reaching up to $0.00000190 as of press time.
If the price maintains upward momentum and confirms strength above $0.00000950, analysts are watching for a longer-term target of $0.00000260.
The price levels correspond to resistance zones, whereas ongoing escalating investor demand could prove these zones.
Strong trading volume and improved sentiment have put PEPE price into a bullish position, according to the current chart configuration. Technical indicators and onchain data now indicate PEPE coin has high potential for breaking out from its current levels.
Market observers carefully watch the PEPE coin development to take advantage of emerging opportunities.
The post Will PEPE Price Breakout Soon, Technicals Flash Bullish Formation? appeared first on The Coin Republic.
0
0


 Manage all your crypto, NFT and DeFi from one place
Securely connect the portfolio you’re using to start.


