
0
0

The cryptocurrency market appears flat on the surface, but there seems to be some underlying pressure. The total crypto market capitalization is holding near $3.04 trillion, yet it remains down roughly 0.95% from yesterday’s high, erasing close to $29 billion in value before stabilizing.
Bitcoin is nearly unchanged over the past 24 hours, down just 0.2%, while Ethereum has gained about 0.7%. Despite the calm price action, both assets remain weaker on a 30-day basis, with Bitcoin down nearly 8% and Ethereum down around 2%.
Losses are sharper across select large caps, with Zcash among the biggest laggards, down over 9%, reflecting its negative correlation during periods of Bitcoin stagnation.
In the news today:-
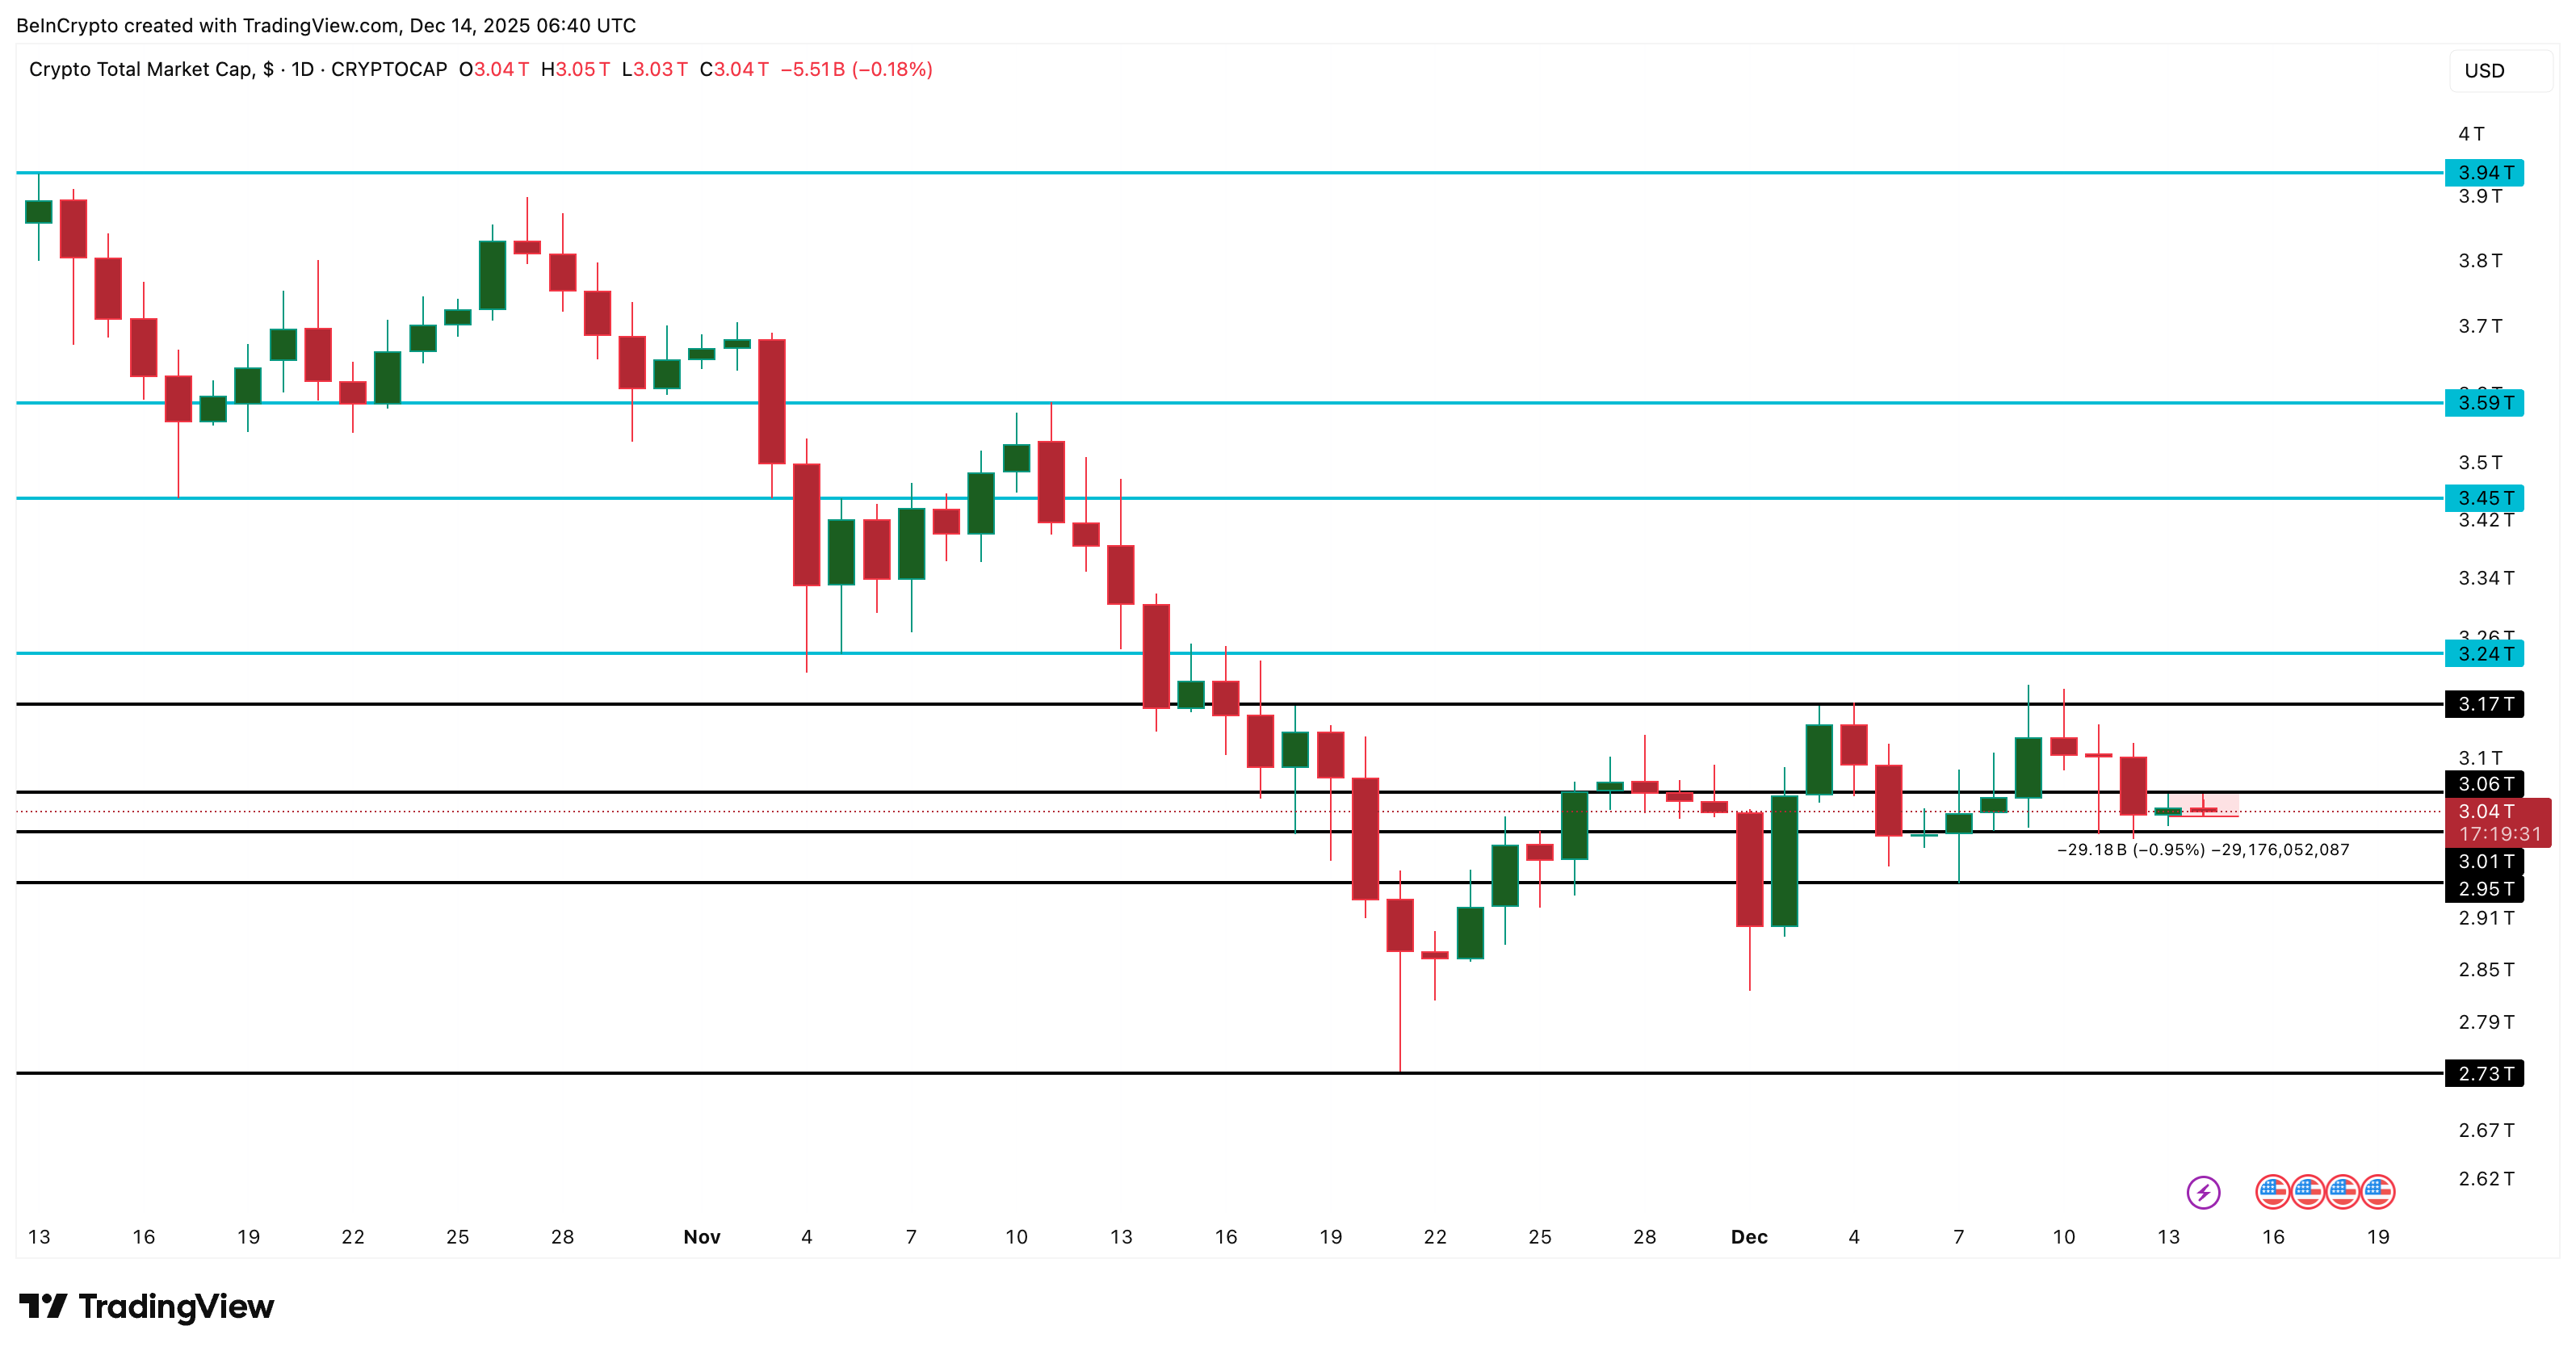
The crypto market looks calm on the surface, but the structure underneath tells a more cautious story. Total crypto market capitalization is holding near $3.04 trillion, down roughly 0.95%, or about $29.18 billion, from yesterday’s highs.
For a market of this size, that move is not meaningful on its own. What matters more is where the price is getting stuck.
Over the past several sessions, the total market cap has repeatedly failed to close above $3.06 trillion. This level has now emerged as a new resistance zone, something that was not previously in place.
Each push toward it has been met with selling, signaling a growing buyer-seller standoff rather than a clear trend.
 TOTAL Price Analysis: TradingView
Want more token insights like this? Sign up for Editor Harsh Notariya’s Daily Crypto Newsletter here.
This price behavior, alongside Bitcoin’s rangebound move, explains why the market appears weak despite minimal price movement. It is not experiencing heavy selling pressure. Instead, momentum is stalling as buyers struggle to regain control above the resistance level.
From here, the levels are obvious. A daily close above $3.06 trillion would ease near-term pressure and open the path toward $3.17 trillion. Failure to reclaim that level keeps the market vulnerable.
On the downside, a break below $3.01 trillion would weaken the structure and expose $2.93 trillion, with $2.73 trillion acting as deeper support if selling accelerates.
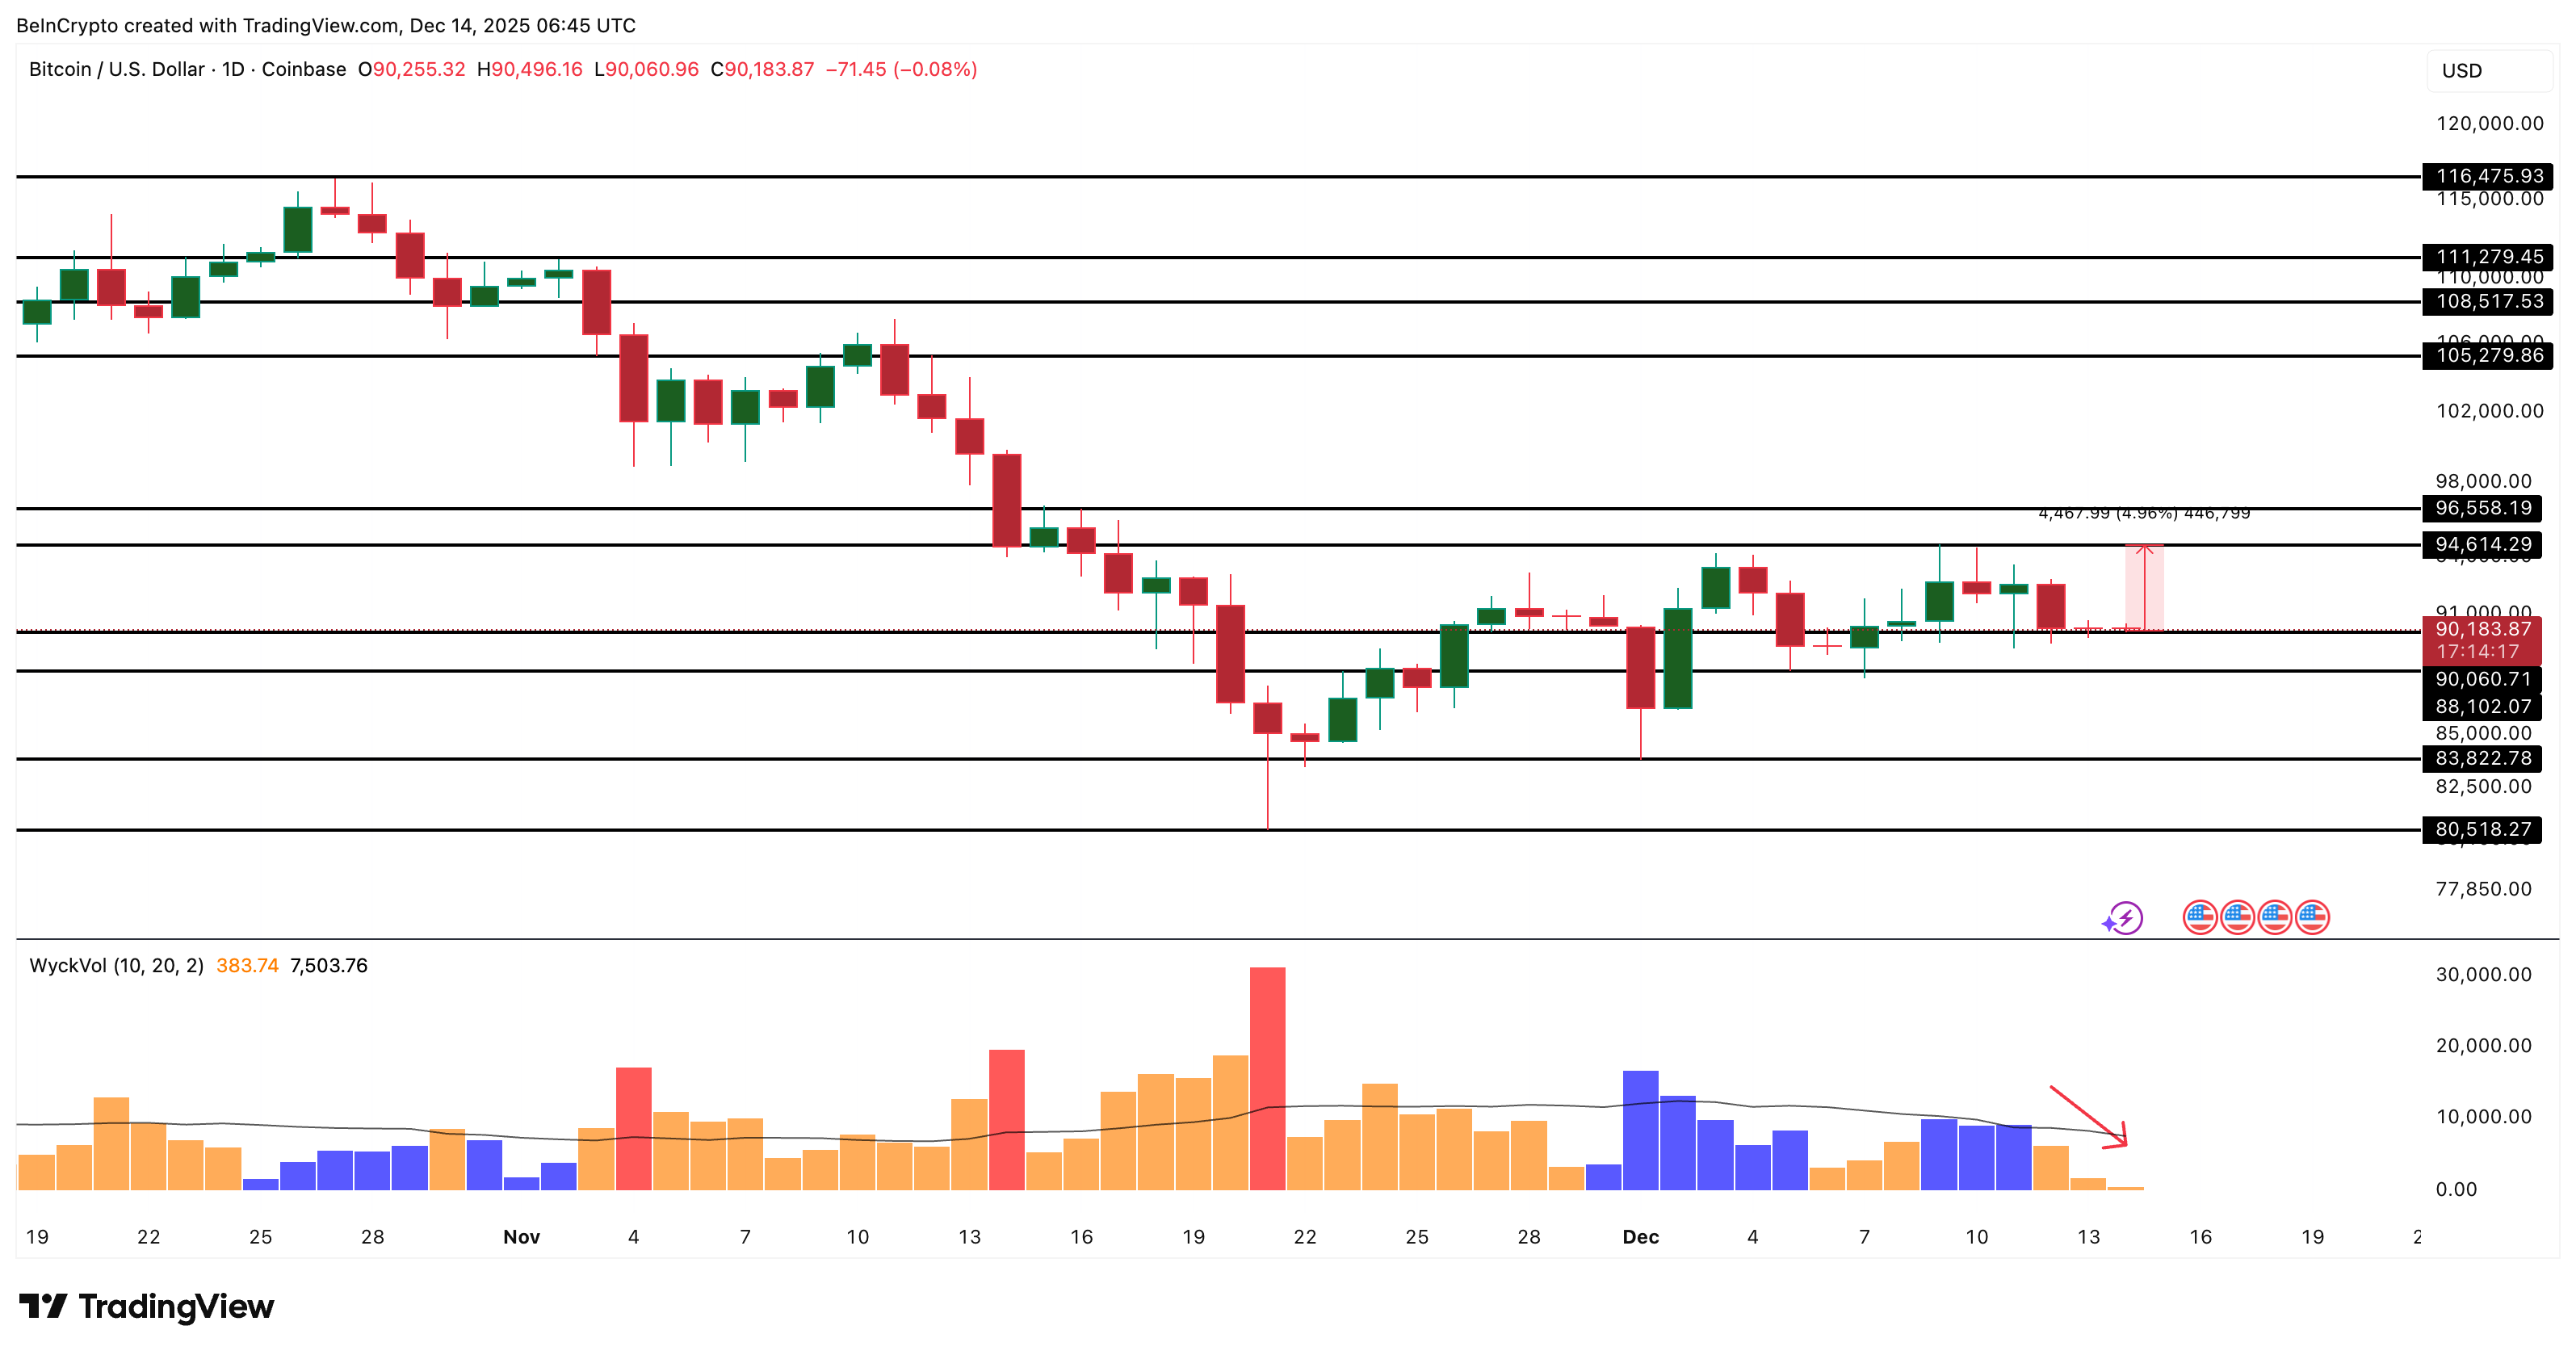
Bitcoin has barely moved over the past 24 hours, and the daily chart makes that clear. Two small, doji-like candles show hesitation, with price hovering near $90,200 and posting only a marginal 0.2% decline. On the surface, Bitcoin looks stuck. Under the hood, however, conditions are slowly shifting.
The key signal comes from volume behavior. Using Wyckoff-style volume colors, yellow bars represent seller-led activity, while blue bars indicate buyer control.
Over the past several sessions, these yellow bars have been shrinking, signaling that selling pressure is losing strength. Sellers are still present, but they are no longer pushing prices lower with conviction.
This does not confirm a breakout yet, but it changes the balance. When selling weakens without price collapsing, it often sets the stage for a directional move once buyers step in.
 BTC Price Analysis: TradingView
For the Bitcoin price, the first level that matters is $94,600. A daily close above it would mark roughly a 5% move from current levels and signal that buyers have regained control of the short-term structure. That kind of move would likely provide support to the broader crypto market.
Until then, Bitcoin remains range-bound. But the volume trend suggests pressure is easing.
Zcash has emerged as one of the weakest large-cap performers, sliding over 9% while the broader crypto market remains mostly flat. On the surface, that divergence looks concerning. But the reason behind the move suggests the weakness may be more structural than bearish.
Over the past year, Zcash has maintained a negative correlation with Bitcoin, meaning it often moves opposite to BTC.
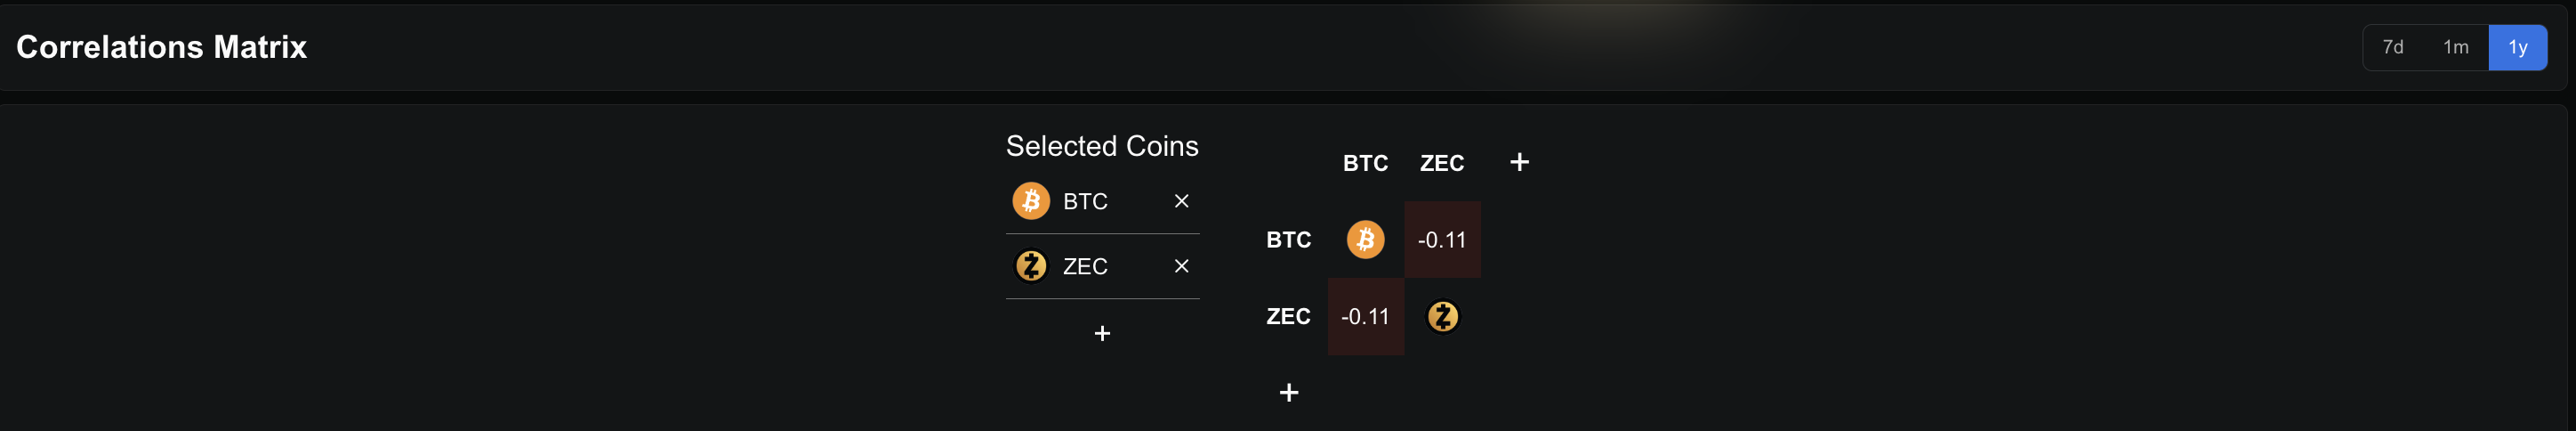 Zcash-BTC Correlation: DeFillama
Pearson correlation, which measures how closely two assets move together, confirms this inverse relationship. When Bitcoin stalls and volatility compresses, Zcash has historically been prone to sharper pullbacks. That dynamic helps explain why Zcash is lagging during a period of market quietness.
Importantly, the price chart does not yet show breakdown behavior. Instead, Zcash appears to be consolidating after a strong rally (24% week-on-week), with price action compressing into what looks like the early formation of a bull flag. While the pattern is not confirmed, it suggests the asset is digesting gains rather than entering a new downtrend.
For momentum to return, Zcash needs to reclaim $475, an 11.5% move from current levels. A sustained break above $434 would strengthen the bullish case and open a projected path toward $685, roughly 57% higher than the breakout base.
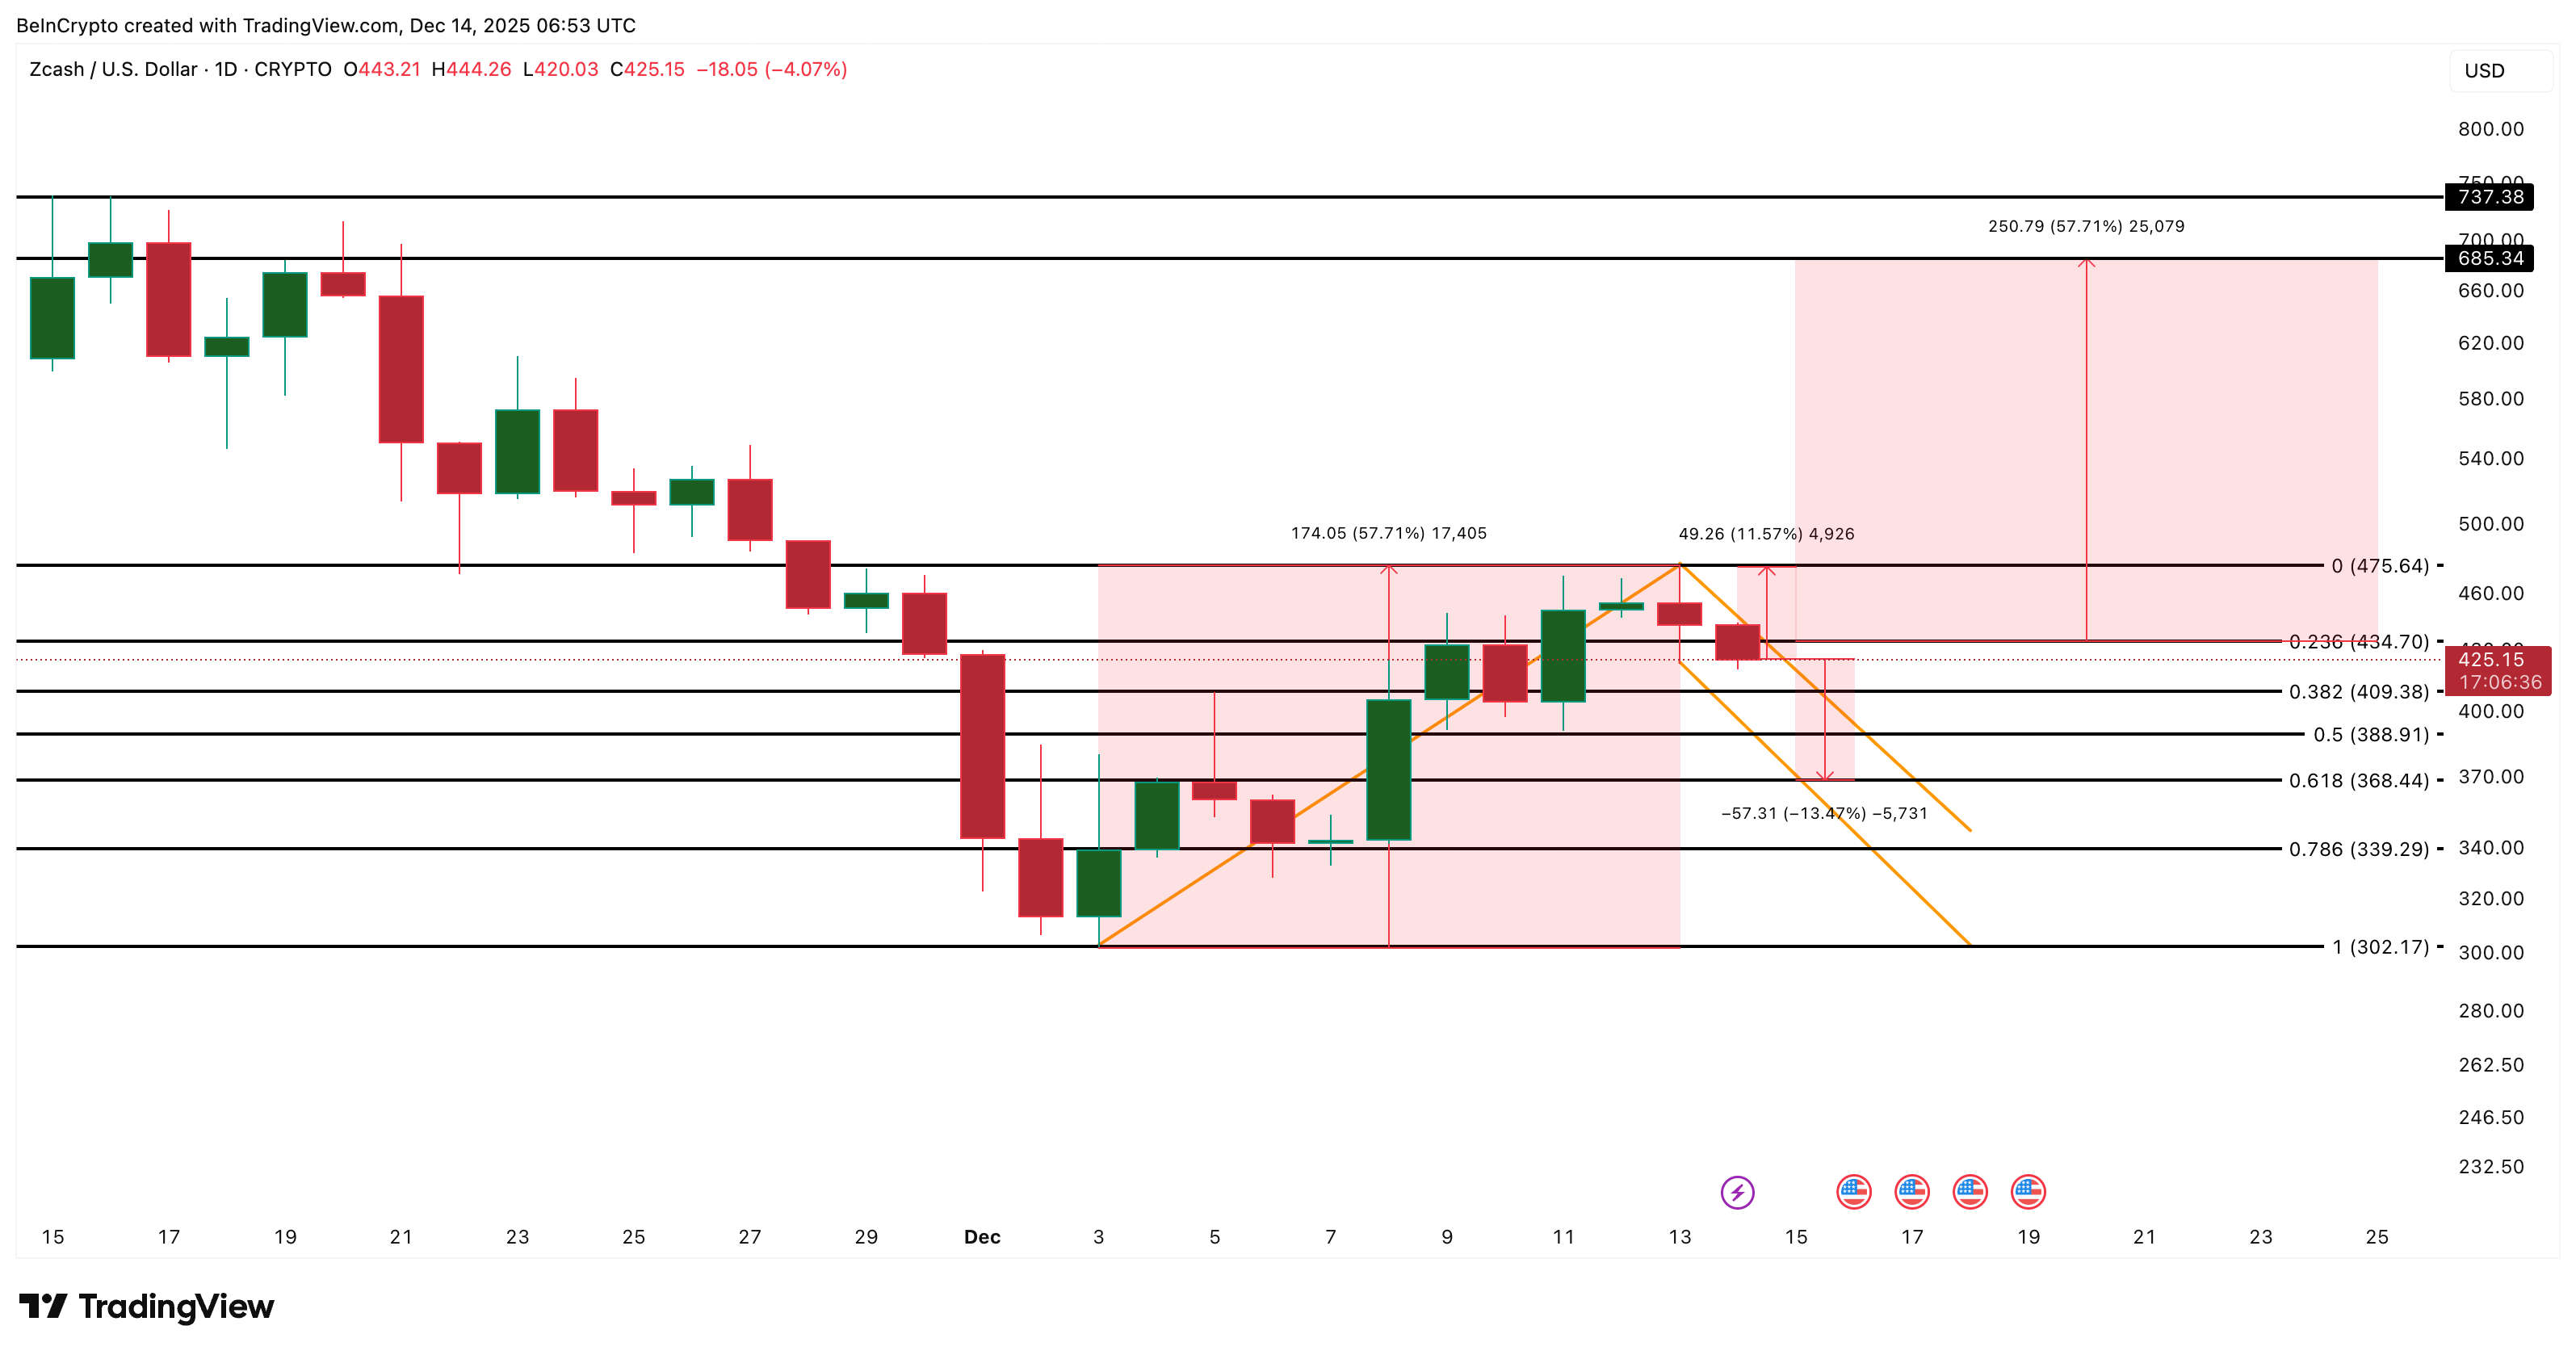 Zcash Price Analysis: TradingView
A loss of the $368 level would weaken the structure and favor sellers again. For now, Zcash is leading losses, but the pullback itself does not invalidate the broader bullish setup.
0
0
 Manage all your crypto, NFT and DeFi from one place
Securely connect the portfolio you’re using to start.

0
0


0
0


