
Bitcoin Nears $67K as ETF Inflows Hit $1 Billion and the CLARITY Act Reaches the "1-Yard Line"

0
0

Bitcoin is having its best week in more than a month. A wave of institutional ETF buying, a regulatory breakthrough in Washington, and a shift out of "fear" sentiment have combined to push BTC back toward $67,000. Bitcoin crossed the important $65,000 resistance level as ETF inflows accelerated and the Crypto Fear and Greed Index exited the fear zone, trading at $66,267 on Wednesday — up nearly 15% from its lowest level this year. Here's what's actually moving the market.
How Much Have Bitcoin ETFs Bought This Week?
The headline number circulating on X is close to accurate. Spot $Bitcoin ETFs added $203 million in inflows on Tuesday, marking the sixth consecutive day of inflows and bringing the six-day total to over $928 million. That's nearly $1 billion in fresh institutional demand in less than two weeks.
The buying is heavily concentrated in the usual leaders. On July 21, Bitcoin hit $66,400 — its first time above $66,000 since June 17 — alongside five straight days of net inflows into US spot Bitcoin ETFs, the longest streak since early May, with roughly $727.3 million entering over five sessions and the final session alone bringing in $226.9 million, the best since July 6. Total Bitcoin ETF assets have surpassed $79 billion, up from about $71 billion in late June.
Why Does the ETF Flow Data Matter?
Because ETF flows are no longer just a sentiment gauge — they're a structural driver of price. The recent inflow run is meaningful precisely because of how deep the hole was. June 2026 alone saw $4.7 billion in outflows from Bitcoin ETFs, the largest monthly exodus since these products came to market, part of $8.2 billion in cumulative outflows during the early summer streak. Set against that backdrop, a six-day, near-billion-dollar reversal represents a genuine shift in institutional posture, not just noise.
Still, it's worth keeping perspective. Even after the recent inflows, 2026 ETF flows remain net negative at about $5.2 billion. The recovery is real, but it's filling a hole rather than breaking new ground — at least for now.
What Did Treasury Secretary Bessent Say About the CLARITY Act?
The second catalyst is regulatory. Bitcoin rose 2.5% at one point on Tuesday, inching toward $67,000, while shares of Coinbase climbed as much as 13% after Treasury Secretary Scott Bessent said lawmakers were at the "1-yard line" on the CLARITY Act, urging Congress to pass the landmark bill before leaving for recess.
The CLARITY Act is the market-structure bill crypto has been waiting on for over a year. It would split oversight of digital assets between the SEC and the CFTC, set disclosure rules for certain tokens, and extend anti-money-laundering and sanctions rules to crypto exchanges. The House passed its version a year ago, and the measure has waited in the Senate since.
Is the CLARITY Act Actually Going to Pass?
This is where the on-chain optimism meets political reality. Despite Bessent's football metaphor, the path is not clear. The bill needs 60 votes to pass the Senate, and Republicans only have 53 — meaning at least seven Democrats must cross over. Democrats have named their price: rules preventing the president and other senior officials from profiting off crypto.
The betting markets remain skeptical. Polymarket's contract on the CLARITY Act being signed into law in 2026 traded near 47% on Tuesday, up from a record low of 31% earlier this month but still short of a coin flip, while Galaxy Research had cut its passage odds to 50-50, citing the shrinking Senate calendar. With only 14 working days remaining before the recess, even supportive senators are hedging on timing.
What About the Macro Backdrop?
The broader risk picture is more mixed than the bullish crypto posts suggest. Oil has been climbing on geopolitical tension, with US-Iran friction pushing WTI crude to multi-week highs — the kind of energy-price and geopolitical stress that has historically weighed on risk assets, even as Bitcoin has so far shrugged it off this week. Traders should watch whether that resilience holds if tensions escalate further.
Bitcoin Price Analysis: Key Levels to Watch
With $BTC near $66,000–$67,000, analysts are watching the next resistance band closely. For a sustained uptrend, Bitcoin needs to hold above the $65,000–$65,500 range. Above current levels, the technical picture is unusually clean: Glassnode data shows only about 1% of Bitcoin supply last changed hands between here and $70,685 — meaning little overhead supply stands in the way of a move higher.
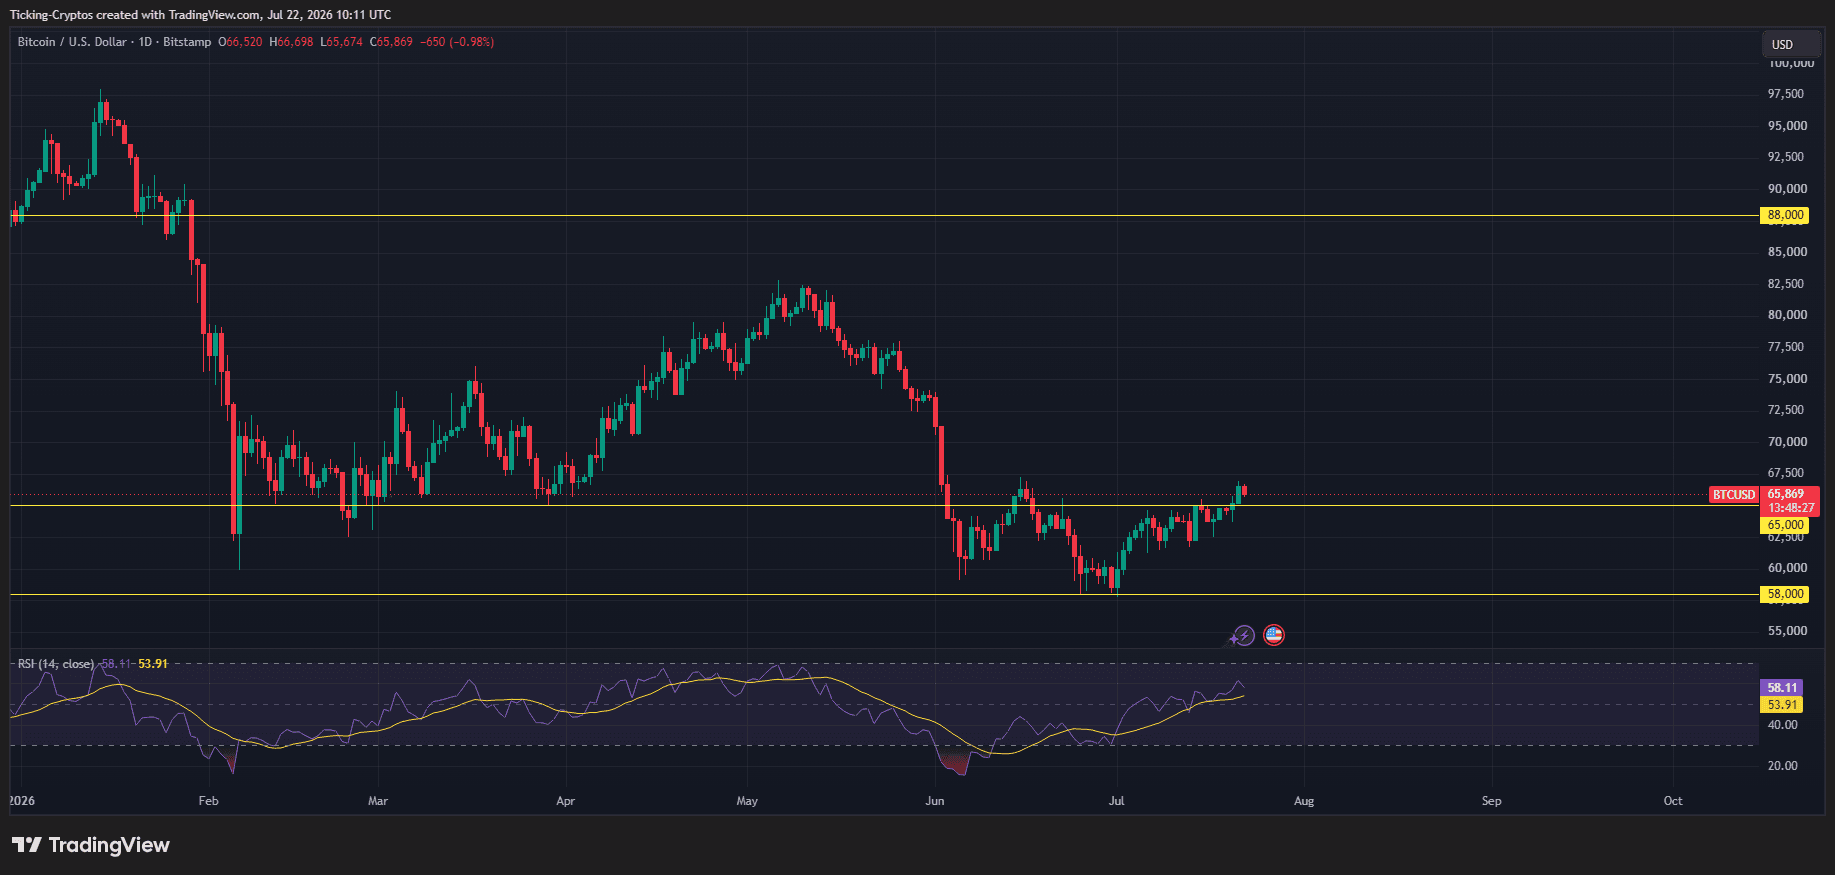
Bottom line: Two catalysts are firing at once — a near-billion-dollar ETF inflow streak and a regulatory bill inching toward the finish line. Both are genuinely bullish. But the ETF recovery is still net-negative year-to-date, and the CLARITY Act's Senate math remains unsolved. The momentum is real; the follow-through is not yet guaranteed.
0
0

 Manage all your crypto, NFT and DeFi from one place
Securely connect the portfolio you’re using to start.

0
0


