Quant Eyes $124 Target After Smashing Through EMA Resistance Levels

0
0

- Quant (QNT) price is showing bullish signs on the technical chart, heading in an upward direction.
- QNT price has surged by 7% in the last 24 hours, suggesting buyers presence.
Based on the technical charts of the Quant (QNT) price, it appears to be building a bullish base after a period of mild correction. As per CMC data, it is currently trading at the price of $105 with an intraday surge of 7% indicating bullishness. QNT has shown a number of positive technical signs that indicate the possibility of a robust bullish rally in the near future sessions.
The most important one is the recent breakout of QNT above both major exponential moving averages. The price has already broken the 50-day EMA at $100.42 and the 200-day EMA at $92.70, forming a bullish crossover pattern, which is usually a precursor of a price increase. This breakout above the two EMAs means that the buyers are taking charge, and the past bearish trend might be changing.
What’s Next For Quant Price?
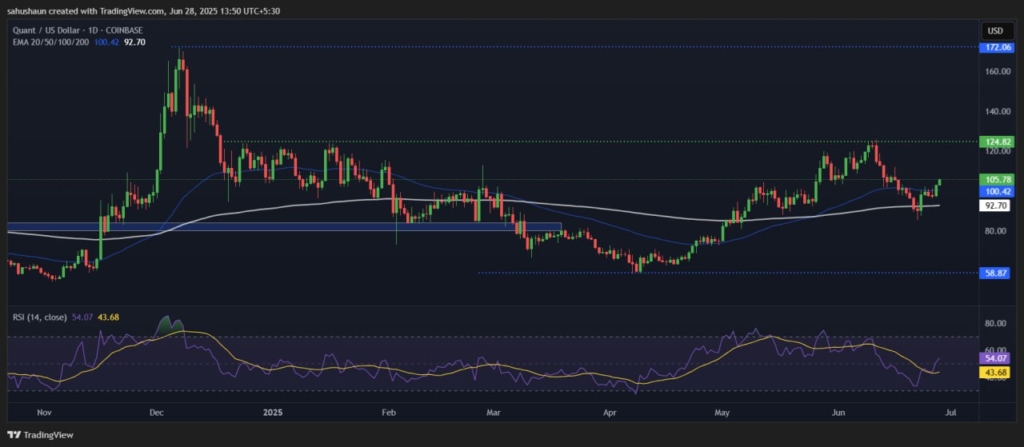
The Relative Strength Index (RSI) is at 54.19 and has been in an upward trend, indicating that there is accumulating buying pressure but not yet overbought. This gives it more room to appreciate in price before it meets momentum-related resistance. The increasing trend of the RSI above the oversold levels in the first half of the year shows that investors are becoming confident about QNT.
The MACD indicator is heading in the positive zone, and the histogram is starting to display mild green bars, indicating bullish momentum is gaining pace. This convergence pattern is usually followed by a long-term price rally, especially when accompanied by the EMA breakout. The bullish technical set-up is supported by the fact that the MACD has moved out of negative territory and is heading into the positive region.
The bullish thesis is also backed by social sentiment analysis, as the metrics are improving, indicating that retail investor interest and confidence in QNT are increasing. This underlying background usually adds more fire to technical breakouts.
The main support areas have been set at $100, which is also the 50-day EMA and $92.70 at the 200-day EMA. The levels are supposed to cushion any short-term pullbacks. On the other side, the nearest resistance is at the level of $124.82, which is the next major obstacle that bulls will have to overcome.
The technical conditions, such as EMA breakout, the RSI momentum improvement, positive MACD indicators, and the increased social sentiment, form a very bullish picture of QNT. The traders are advised to keep an eye on whether the price will be able to hold above the support level of $100 as the price approaches the resistance zone of $124.82, where profit-taking can be expected.
Highlighted Crypto News Today:
Livepeer (LPT) Volume Jumps 462% as Bulls and Bears Battle for Control
0
0


 Manage all your crypto, NFT and DeFi from one place
Securely connect the portfolio you’re using to start.

0
0

0
0

