Bitcoin Price Analysis: Double Top Pattern Hints $100K Reversal as Saylor Reacts

0
0
Bitcoin price consolidated around the $109,500 mark on Sunday, Sept 28, as market liquidity thinned out over the weekend. Strategy CEO Michael Saylor issued another rallying cry, as BTC derivatives trading metrics and technical indicators pointed to more downside risks ahead.
The underwhelming 25 basis point US Fed rate cut on Sept 18 triggered a seven-day sell-off that pushed BTC below $110,000 on Friday, Sept 25, for the first time in 20 days. Since then, Bitcoin has struggled to reclaim the $110,000 level, while another 33% decline in trading volumes on Sunday signals weak conviction for the week ahead.
Always ₿e Stacking pic.twitter.com/XMT5rA0DYL
— Michael Saylor (@saylor) September 28, 2025
However, Bitcoin-reserve firm Strategy CEO Michael Saylor reaffirmed his bullish stance on X, urging his 4.5 million followers to buy more BTC despite recent volatility.
Amid the ongoing BTC price correction phase Strategy’s total BTC reserves, 639,835 coins, fell 5% in value, from $74 billion after its last purchase on Sept 22, to $70 billion at press time.
Bitcoin Price Tests $109K as Double Top Signals $100K Reversal Risk
Bitcoin price action has taken a downward trajectory since the recent Fed decision. Since then, bears have mounted strong resistance near $110,000, confirmed by repeated rejections over the weekend.
From a technical standpoint, BTCUSD daily chart shows a double top formation around the $111,000 to $112,000 range, with a clear downside target at $100,780. The Relative Strength Index (RSI) has also remained near oversold territory over the past week, signaling a persistent decline in buying pressure.
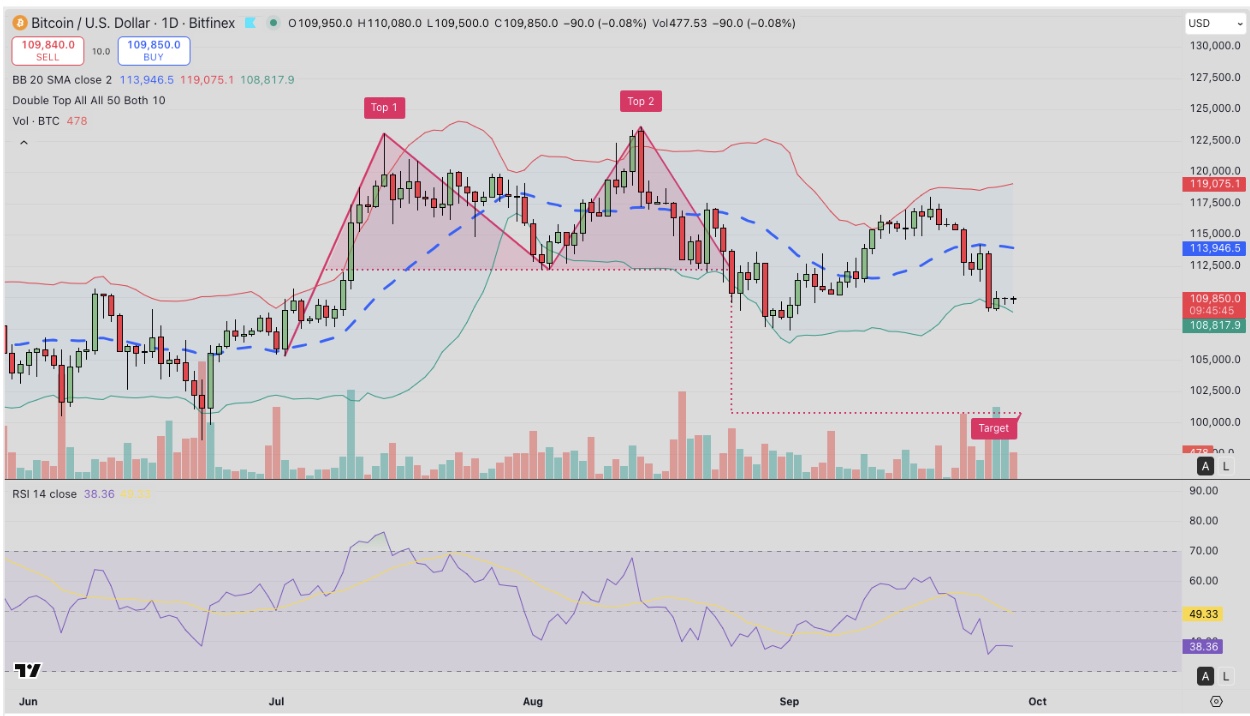
Bitcoin (BTC) Technical Price Analysis | Source: TradingView
If BTC fails to reclaim $110,000 in the coming sessions, the next critical support lies at $106,500. A decisive break below that level would expose psychological support at $100,000. Conversely, reclaiming $112,000 would invalidate the bearish outlook and open room for a retest of $119,000 resistance, which aligns with the upper Bollinger Band.
In summary, Bitcoin’s price outlook remains fragile for the week ahead. Technicals warn of a potential retracement toward $100,000 unless liquidity improves and demand strengthens. Traders will closely watch whether Saylor’s renewed buy calls incentivize significant action from other US-based corporate actors to stabilize price action as September winds to a close.
The post Bitcoin Price Analysis: Double Top Pattern Hints $100K Reversal as Saylor Reacts appeared first on Coinspeaker.
0
0

 Manage all your crypto, NFT and DeFi from one place
Securely connect the portfolio you’re using to start.

0
0


