Key XRP Metrics Flips to Bullish – Here’s What the Chart Shows
0
0

- XRP charts reveal TD Sequential flipping bullish after extended decline.
- Key technical metric signals potential reversal as XRP shows strength.
- Analyst highlights buy setup, suggesting XRP may stabilize soon.
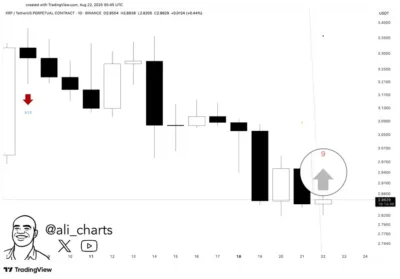
According to Ali, a crypto analyst known for technical market calls, the TD Sequential indicator on XRP has flipped to a bullish signal. The change occurred just after the indicator indicated the recent top, which was followed by a sharp decline in the token’s price.
The latest chart shows XRP trading near $2.86 on Binance’s perpetual contract. Following a chain of successive bearish candles, the TD Sequential has now issued a nine-count that usually indicates the possibility of a price reversal.
Chart Highlights the Turning Point
The indicator, which measures trend exhaustion, first aligned with the previous peak before the subsequent decline in XRP’s value. Its new reading has now crossed over to a buy signal, and this could mean short-term relief.
Also Read: Prepare Your Bags: Something Huge Coming For XRP Holders on August 25 – Gemini
On the chart, the nine-count buy setup is marked at the lower end of the recent price action. The growth is after back-to-back selling pressure, which strengthens the view that the current downtrend could be weakening.

Source: Ali_charts
Analysts tend to pay attention to such signals to understand how momentum is changing. In this case, the emergence of a buy formation has attracted the attention of traders who are scrutinizing the possibility of XRP stabilizing at the current prices.
Broader Market Context
Besides the individual signal, the chart demonstrates how XRP has remained under volatility during the recent market cycle. The downward momentum, which had supported prices, has now crossed with a technical indicator that has turned bullish.
Notably, the correlation of this indicator with price levels has strengthened the analysis. Technical reversals are of great interest to many traders because they tend to influence the short-term positioning of highly traded assets such as XRP.
Key XRP metrics have flipped to bullish as the TD Sequential indicator signaled a nine-count buy setup. According to Ali, the chart shows that XRP may be approaching a turning point after sustained downside pressure.
Also Read: Bitcoin Dips Below Momentum as XRP, Solana, Dogecoin, and Other Top Altcoins Lose Ground
The post Key XRP Metrics Flips to Bullish – Here’s What the Chart Shows appeared first on 36Crypto.
0
0
 Manage all your crypto, NFT and DeFi from one place
Securely connect the portfolio you’re using to start.


