ETH Price Drops below MVRV, Suggesting Bullish Breakout Potential
0
0

The ongoing Ethereum bearish market has triggered increased attention on on-chain metrics to completely understand the downtrend behind the scenes. Today, crypto analyst Ali Martinez shared his outlook on Ethereum’s market performance, basing his perspective on the MVRV ratio.
ETH creates an ideal buying opportunity
As per data shared by Martinez, ETH’s price has dropped below the lower MVRV price Band, an event that has created a perfect buying opportunity in the market. Historically, this drop shows that purchasing tokens at this level normally generates the best profitability. This buying trend has been happening since 2016 whenever Ethereum’s price drops below MVRV.
Thanks to this decline, it appears that investors are heightening token accumulations at current lower price levels. An evidence of this purchasing behaviour is seen in the current ETH outflows from exchanges. These outflows show that buyers are prevailing in the market, with more capitals moving out from exchanges than those coming in.
Whales are behind this buying activity. Data from Lookonchain shows that Ethereum whales have recently changed their strategy and resumed accumulation. As per metrics from Lookonchain, an institutional whale by the name ‘Metalpha’ has bought $50 million worth of Ethereum since the beginning of this month. Another whale also withdrew $100 million in ETH from Gate.io. Another whale also recently moved 10,000 ETH from Bybit. These are indications that whales have started accumulating ETH – a positive outlook as this activity decreases selling pressure and could drive FOMO among small investors.
Ethereum price updates
This enthusiastic sentiment is further confirmed by the surging Open Interest (OI). According to metrics from Coinglass, OI for Ethereum increased by 3.88% from yesterday to $18.52 billion. This rise in IO suggests that traders are paying premiums to maintain long positions, an indicator of a growing buying activity and increased confidence in the token. As sellers seem to be decreasing, Ethereum appears preparing for a recovery.

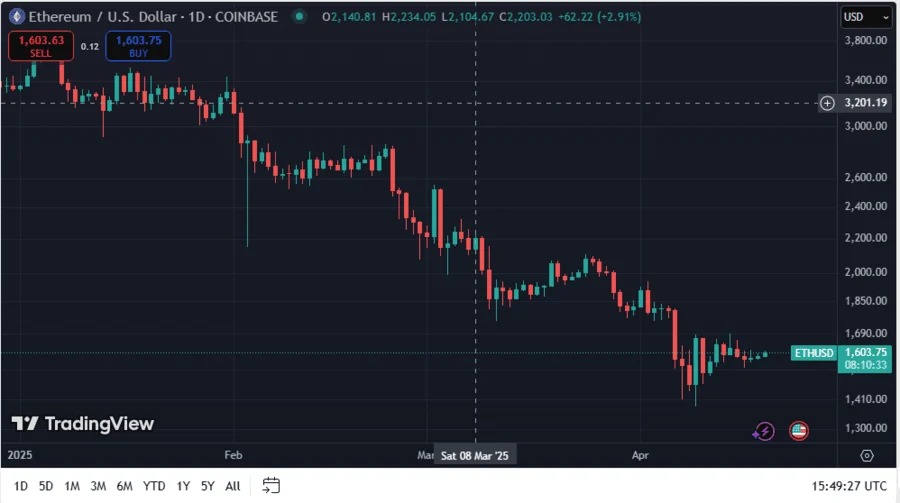
The fourth positive sign for Ether’s future price movement is the formation of a falling wedge. Ethereum is currently trading in a falling wedge, a bullish chart pattern suggesting a potential breakout from the ongoing downtrend. This points out that the current declining price is beginning to lose strength and buyers are beginning to enter the market.

The asset is currently trading at $1,604, up 1.3% over the past 24 hours. Therefore, if the demand noticed during these recent days is maintained, Ethereum is set to break the resistance levels of $1,615 and $1,633 in the coming days.
0
0
 Manage all your crypto, NFT and DeFi from one place
Securely connect the portfolio you’re using to start.


