
Aurora Price Prediction 2026–2030: Can AURORA Reclaim Resistance?

0
0

Aurora price prediction work starts with one fact: $AURORA is the NEAR-based token, not a random look-alike asset sharing the same ticker. Traders checking crypto presale and IDO listings often confuse this token with unrelated projects using similar branding.
As of 12:50 UTC on September 22, 2026, $AURORA trades near $0.0511, sitting inside a fresh breakout structure after months of range-bound trading. This article walks through the setup, the levels, and the scenarios. None of it is a guarantee.
Aurora Price Prediction Snapshot
Metric | Data |
Current price | $0.0511 |
24H change | Roughly +125% to +131% depending on source |
Market cap | Around $36M–$48M |
Volume (24H) | Near $13M |
Circulating supply | ~737.8M AURORA |
RSI (14, daily) | 80.06 |
Trend | Bullish, short-term overheated |
Support | $0.0144–$0.0370 |
Resistance | $0.0644 |
Next target | Scenario-based, see below |
CoinMarketCap snapshots differ right now. That's normal during a violent move. The live CoinMarketCap listing is worth checking before publishing anything final.
Aurora Technical Analysis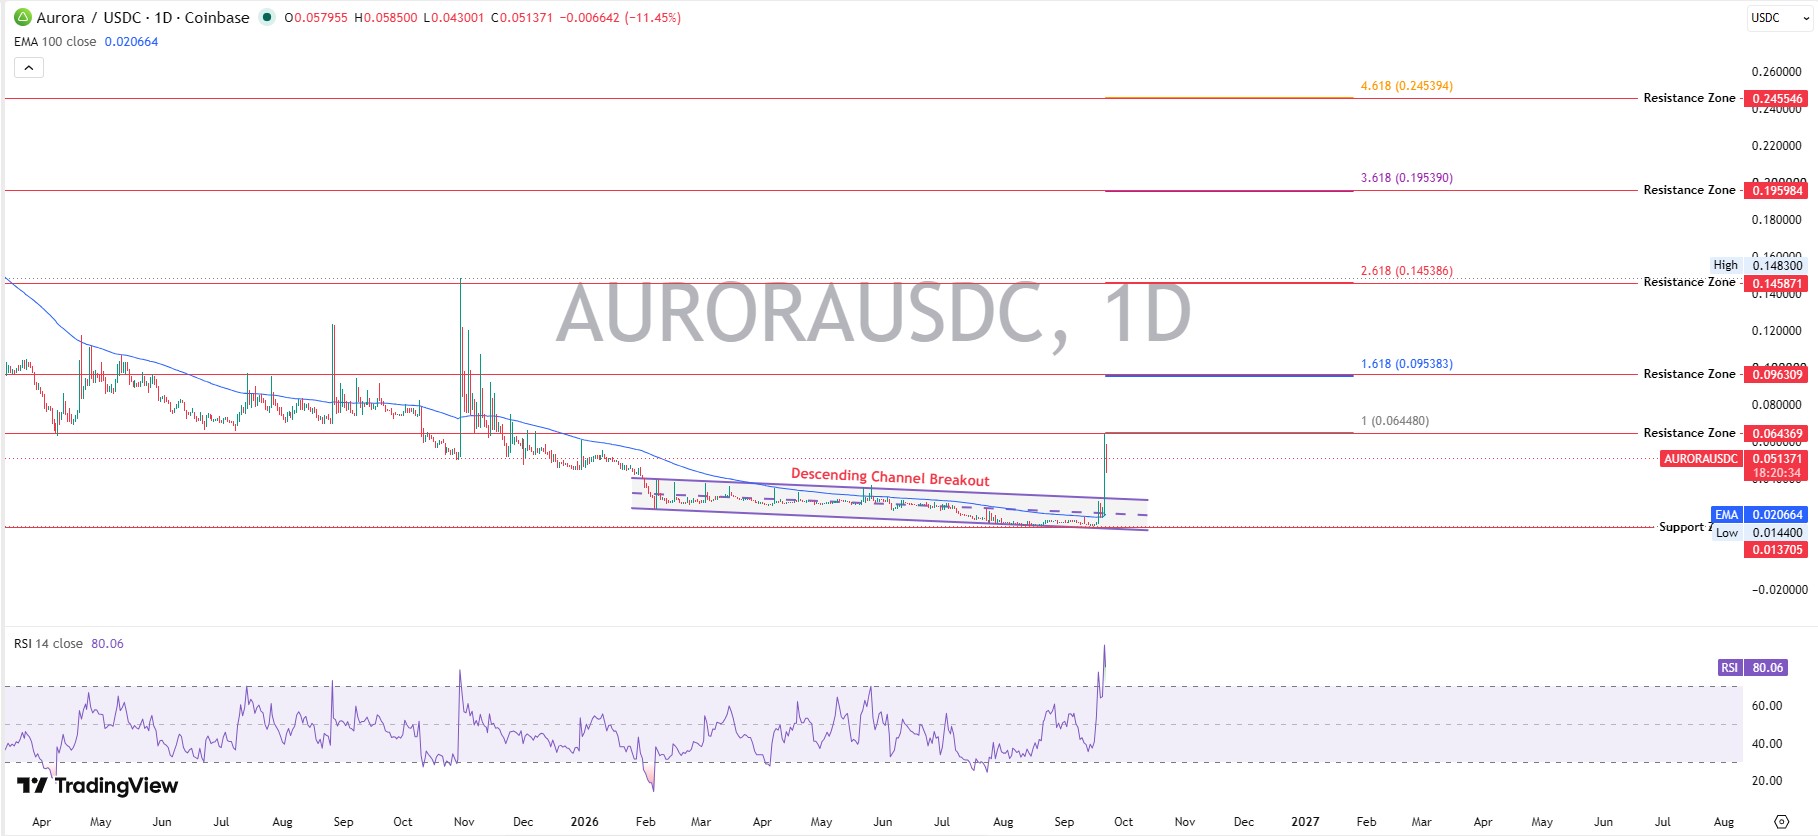
$AURORA Trend and Market Structure
$AURORA spent close to a year inside a descending channel, printing lower highs and lower lows on the daily chart. That channel just broke. The trading range compressed near $0.02 before this week's expansion. Timeframe matters here: this is a daily-chart breakout, not an intraday spike.
$AURORA Support Levels
The nearest support sits around $0.0370, the base of the old channel. Below that, $0.0144 marks the multi-month low and acts as a harder floor. These aren't arbitrary lines. Each one held trading activity multiple times before the price moved away.
$AURORA Resistance Levels
Immediate resistance sits at $0.0644, the first Fibonacci extension zone above trades right now. Breakout resistance stretches to $0.0964. Major overhead supply builds near $0.1459 and again at $0.1960, both untested since early in the chart's history.
RSI and Momentum
The daily RSI reads 80.06. That's deep overbought territory. It confirms strength in the current push. But it also raises the odds of a pullback before any further advance. Momentum and price are aligned for now. No divergence shows up yet.
Volume Confirmation
Volume expanded sharply alongside the trading range breakout. A breakout without volume confirmation is less convincing than one accompanied by expanding volume, and this one has the latter. Nearly $13M changed hands in 24 hours. That's a real shift, not noise.
Aurora Price Prediction for 2026
Scenario | Price Range | Conditions | Invalidation |
Bear | $0.020–$0.035 | Support failure, weak broader market | Break below $0.0144 |
Base | $0.045–$0.065 | Range recovery, moderate adoption | Loss of $0.0370 |
Bull | $0.096–$0.146 | Breakout confirmed, volume holds, catalyst hits | Failed retest of $0.0644 |
No single number here is inevitable. Treat the table as a range, not a promise. Traders comparing this setup against other assets can browse broader crypto price prediction coverage for added context.
Aurora Price Prediction 2027
Longer-term direction depends on Aurora Intents adoption, cross-chain volume, and how the broader altcoin cycle behaves. CMC AI specifically flags Aurora Intents adoption, competition, and network reliability as the three swing factors for the multi-year thesis. Supply unlocks continue through this window too, which caps upside unless demand outpaces new circulating tokens.
Scenario | Market Cap | Assumed Circulating Supply | Implied Price |
Bear | $40M | ~800M AURORA | ~$0.050 |
Base | $90M | ~800M AURORA | ~$0.113 |
Bull | $180M | ~800M AURORA | ~$0.225 |
These are rough projections built on a circulating supply estimate, not a guarantee.
Aurora Price Prediction 2028–2030
2028 Scenario
A market-cap framework works better than a guessed number. If $AURORA captures a modest slice of Layer 2 infrastructure demand, a market cap between $70M and $400M becomes plausible, implying meaningful multiples from current levels.
Scenario | Market Cap | Assumed Circulating Supply | Implied Price |
Bear | $70M | ~850M $AURORA | ~$0.082 |
Base | $150M | ~850M $AURORA | ~$0.176 |
Bull | $400M | ~850M $AURORA | ~$0.470 |
2029 Scenario
Ecosystem expansion and broader crypto liquidity drive this stretch. And a lot depends on whether ongoing crypto news around NEAR-based infrastructure stays favorable through the cycle.
Scenario | Market Cap | Assumed Circulating Supply | Implied Price |
Bear | $100M | ~900M $AURORA | ~$0.111 |
Base | $250M | ~900M $AURORA | ~$0.278 |
Bull | $600M | ~900M $AURORA | ~$0.667 |
2030 Scenario
Max supply sits at 1B AURORA, with roughly 738M already circulating. A market-cap assumption between $150M and $900M, rather than a fixed price target, gives a more honest range for this far out.
Scenario | Market Cap | Assumed Circulating Supply | Implied Price |
Bear | $150M | ~950M $AURORA | ~$0.158 |
Base | $400M | ~950M $AURORA | ~$0.421 |
Bull | $900M | ~950M $AURORA | ~$0.947 |
Circulating supply keeps climbing toward the 1B cap through this window, so these price figures assume most of the remaining unlock schedule has played out.
What Could Drive $AURORA Higher?
Aurora Intent Adoption
More chains integrating Intents Connect means more routed volume and more reasons to hold the token. A recent update on Sui integration shows the team shipping new destinations at a steady pace.
Cross-Chain Activity
Recent volume through Aurora Intents crossed $19M in a single campaign window, with 1,200 new wallets touching the system. That's real traction. Some of that wallet growth mirrors patterns seen around crypto airdrops, where incentives pull in first-time users fast.
Developer and dApp Growth
More builders on the chain generally means more transaction fees and more utility for the token long-term.
Token Buyback/Burn Mechanics
Any formalized burn or buyback tied to protocol revenue would tighten circulating supply pressure.
Broader NEAR Ecosystem Growth
CMC AI currently identifies Aurora Intents and its associated integrations as an important catalyst for the wider NEAR ecosystem. $AURORA benefits when NEAR benefits. Coverage tracking these shifts shows up regularly in AI-driven crypto news roundups.
What Could Push $AURORA Lower?
Weak TVL
CMC AI specifically highlights Aurora's comparatively small TVL (total value locked) against larger Layer 2 ecosystems as a structural weakness.
L2 Competition
Dozens of Layer 2 networks compete for the same liquidity and the same developers. Aurora isn't alone in this fight.
Network Reliability
Any downtime or bridge issue erodes trust fast in this market. Trust, once lost, takes months to rebuild.
Weak Altcoin Liquidity
If Bitcoin dominance rises, altcoins, including $AURORA, tend to bleed regardless of their own fundamentals. New crypto exchange listings can offset some of that pressure by widening access to the token.
Supply Pressure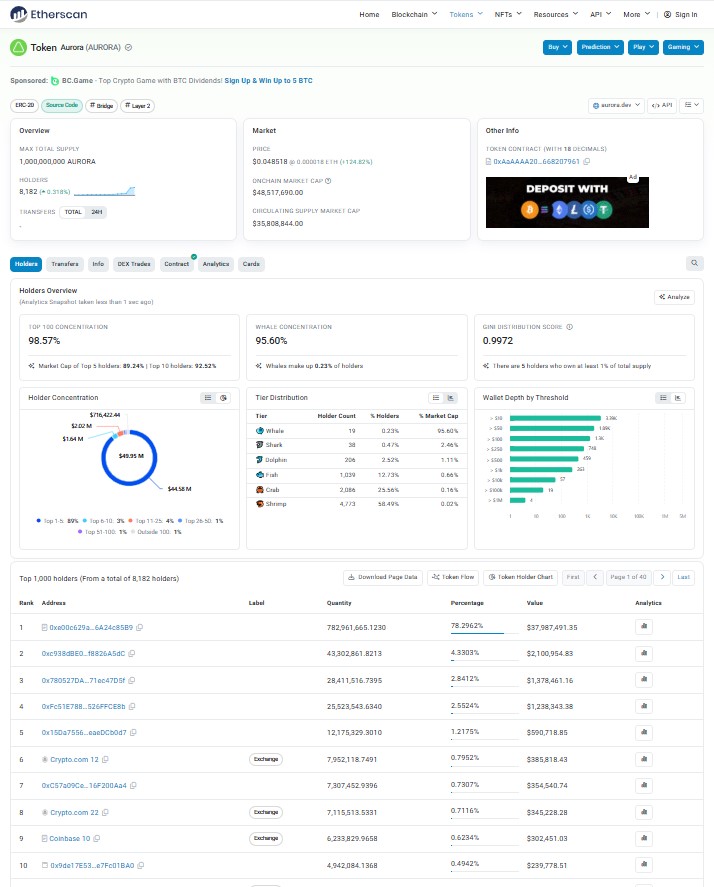
With 99% of total supply expected to unlock by month 132 from the Token Generation Event, dilution remains a background risk through this decade. Holder concentration data on Etherscan's token page shows the top ten wallets still hold a large share of supply.
$AURORA Breakout and Breakdown Levels
Breakout condition: a close above $0.0644 with confirmation on the next trading session, paired with volume staying above recent averages.
Breakdown condition: loss of $0.0370 support, a failed reclaim attempt, and rising sell-side volume on the way down.
This framework is more useful than simply calling the setup "bullish" or "bearish." It gives traders something to actually watch.
Can $AURORA Reclaim Resistance?
The breakout already happened. Whether it holds is a different question entirely. RSI at 80 says buyers are in control right now. But overbought conditions don't last forever, and a cooldown toward $0.037 wouldn't break the larger structure. Reclaiming $0.0644 with volume would confirm this isn't a one-week wonder.
Aurora Bull, Base and Bear Scenarios
Scenario | Technical Condition | Fundamental Condition | Target Zone | Invalidation |
Bull | Resistance breakout holds | Adoption accelerates | $0.096–$0.146 | Failed breakout retest |
Base | Range recovery, consolidation | Gradual, steady growth | $0.045–$0.065 | Structural support loss |
Bear | Support breakdown | Weak adoption, weak market | $0.020–$0.035 | Reclaim of broken support |
Aurora Price Prediction Methodology
Current market structure, support and resistance zones, RSI, moving averages, and volume all factor into this analysis. Market-cap scenarios rely on supply assumptions drawn from Aurora's own tokenomics documentation. Fundamental catalysts, the Bitcoin and altcoin environment, and clear invalidation conditions round out the framework. Analysis timestamp: 12:50 UTC, September 22, 2026.
Traders tracking upcoming catalysts can check a crypto events calendar for scheduled unlocks or announcements tied to NEAR-based projects.
Disclaimer
This content is for informational purposes only and does not constitute financial advice. Cryptocurrency markets are volatile, and prices can move sharply in either direction. Anyone considering a position should conduct independent research and consult a qualified financial advisor before making decisions.
0
0

 Manage all your crypto, NFT and DeFi from one place
Securely connect the portfolio you’re using to start.