Solana Hits 400B Transactions—Is a Price Surge to $145 Next?
0
0

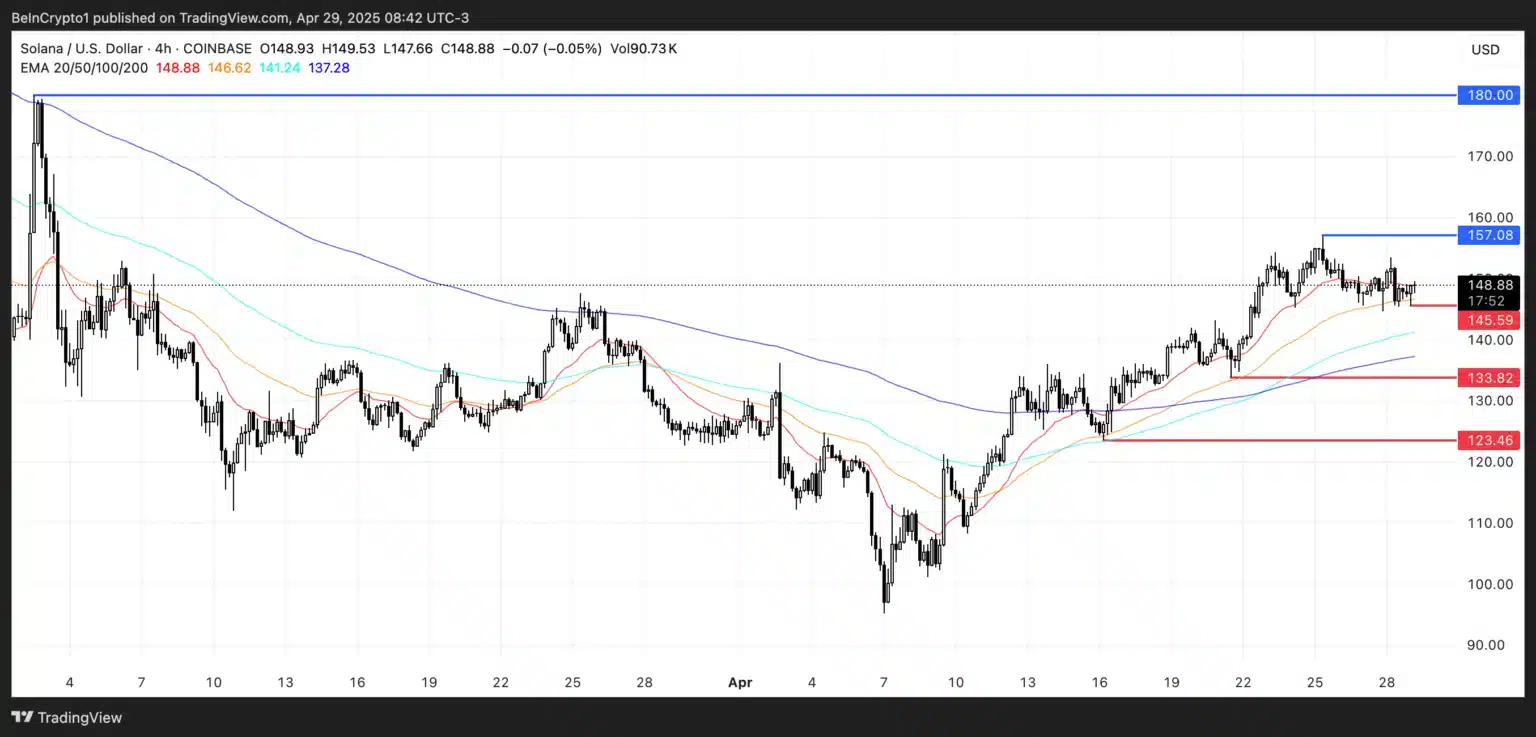
Solana (SOL) has now processed over 400 billion transactions, marking a new milestone for the blockchain network. This achievement comes as SOL trades near a key support level at $145 after retreating from $157.
The asset moves through an important time, operating within distinct resistance and support points. Strong fundamental conditions create long-term optimism but technical signals present conflicting indications about future short-term value. Consequently, investors remain divided on whether SOL can rebound or face further correction.
Despite facing strong resistance at $150, Solana’s fundamentals remain solid, bolstered by rising transaction volumes and decentralized finance activity. Bullish sentiment exists because the platform continues to attract more users as its ecosystem expands. Market participants maintain a cautious approach because they need to understand the impacts of recent price chart formation and capital movement trends.
Solana’s Technical Setup Signals Caution
Solana trades within a narrow range, consolidating between $145 and $155 after a failed breakout attempt past $157. On the 4-hour chart, SOL remains supported by the 50 EMA, which cushions near-term downside risk. A straightforward rejection of $150 indicates that sellers still maintain control over that resistance area.

A bearish head-and-shoulders pattern has formed on the short-term chart, with its neckline resting at approximately $145. If SOL price breaks below this neckline, a move toward the $137 area becomes likely, increasing the risk of a broader correction. A price breakdown from this level risks damaging the market outlook, particularly when investors increase their trading activity.
If bulls succeed in defending both $145 and returning above $155, the market could experience an upward trend, with prices increasing toward $165. The anticipated reversal would become valid when purchasing pressure develops near the support zone. The technical indicators currently show mixed results, so traders should exercise caution when executing short-term trades.
Solana Network Hits 400B Transactions, DEX Volume Soars
The Solana blockchain achieved a major milestone by surpassing 400 billion transactions across its network. The increase in on-chain usage demonstrates that the platform operates smoothly to fulfill growing demand. The total trading volume across DEX platforms rose 44% to reach $21 billion weekly.
These fundamentals reinforce confidence in Solana’s utility, especially amid broader market uncertainty and competition among Layer 1 blockchains. User participation metrics and developer demographics growth data confirm optimistic projections for Solana’s extended network performance. The consistent increase in system usage presents a powerful bullish case while short-term price shifts fail to influence this positive trend.
Furthermore, long-term holders continue to find value in Solana’s technical advancements and expanding ecosystem. Past network outages have demonstrated no impact on the sustained demand for blockchain transactions and the continuous growth of throughput, which increases user trust. This resilience helps position Solana as a leading blockchain platform in a crowded and volatile crypto market.
Hot Capital Inflows Reflect Renewed Speculation
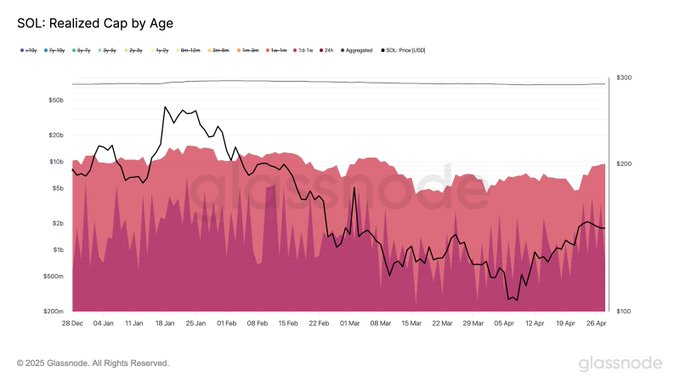
Capital inflows into SOL surged sharply, with hot capital reaching $9.46 billion on April 28. Such capital inflows became the largest weekly boost since January 23, bringing $4.72 billion into the seven days. Because of this climbing trend, market participants showed growing interest and started speculating on SOL again.

A rise in the density of young coins across the chart indicates numerous temporary SOL investors engaging in market trades during the current period. These movements occur frequently before the market shows increased volatility, suggesting that rising price movements are ahead. Buying pressure could lift SOL above resistance levels if capital continues flowing at this pace.
Despite the short-term volatility, long-term indicators remain favorable, especially as SOL maintains higher lows since its recovery from $95. Long-term price stability depends on elevated on-chain activity and capital inflows, which form a basis for ongoing upward market trends. For the bullish scenario to remain valid, price stability must persist around $145.
FAQs
What does Solana’s 400 billion transactions milestone mean?
It shows high blockchain usage and confirms Solana’s scalability and adoption across its ecosystem.
Why is $145 important for SOL?
$145 is the key support level; if broken, it could trigger a bearish move toward $137.
What could push SOL above $150?
Strong buying volume, bullish sentiment, and sustained capital inflows could lead to a breakout above $150.
Glossary of Key Terms
Hot Capital – The value of coins moved within a short period, indicating active trading interest.
DEX (Decentralized Exchange) – A platform that enables peer-to-peer cryptocurrency trading without centralized intermediaries.
EMA (Exponential Moving Average) – A technical indicator used to assess market trends based on price averages.
Head-and-Shoulders Pattern – A chart pattern signaling a potential trend reversal, often seen in technical analysis.
Cup-and-Handle Pattern – A bullish continuation pattern suggesting potential for price breakout over the long term.
Sources
Read More: Solana Hits 400B Transactions—Is a Price Surge to $145 Next?">Solana Hits 400B Transactions—Is a Price Surge to $145 Next?
0
0
 Manage all your crypto, NFT and DeFi from one place
Securely connect the portfolio you’re using to start.


