Pudgy Penguins (PENGU) Jumps 9% as Buyers Push for Higher Targets

0
0

- Pudgy Penguins price has jumped by 9% in the last 24 hours, suggesting bullishness.
- PENGU indicators turned green and support the bullish trend.
Pudgy Penguins (PENGU) is showing strong bullish signs on various technical indicators, which implies that it might be on an upward trend in the short term. The memecoin has been showing powerful momentum features in the recent past, which should be of great interest to both short-term traders and medium-term investors. As per CMC data, PENGU is trading at $0.01329 with an intraday surge of 9% showcasing bullishness.
The most important event on the technical chart of PENGU is the appearance of the golden cross pattern on the four-hour timeframe. This will be the case when the 50-day EMA at $0.01061 cuts above the 200-day EMA at $0.01037.
Golden crosses are regarded as one of the most dependable bullish reversal patterns in technical analysis, and in many cases, they are used to signal the start of a long period of increasing prices. The fact that the two moving averages are close to each other indicates that the crossover has just taken place, and this signal is highly applicable to the current market situation.
In support of this bullish argument, the Relative Strength Index (RSI) is at 72.37, which is well within the positive territory. Although this reading is near the overbought levels that are usually experienced above 80, the current level shows that there is a lot of buying power, but not to the extreme levels. This RSI positioning indicates that buyers are in control, but there is still the potential of further upside before facing a substantial resistance level of momentum indicators.
What’s Next For Pudgy Penguins (PENGU) Price?
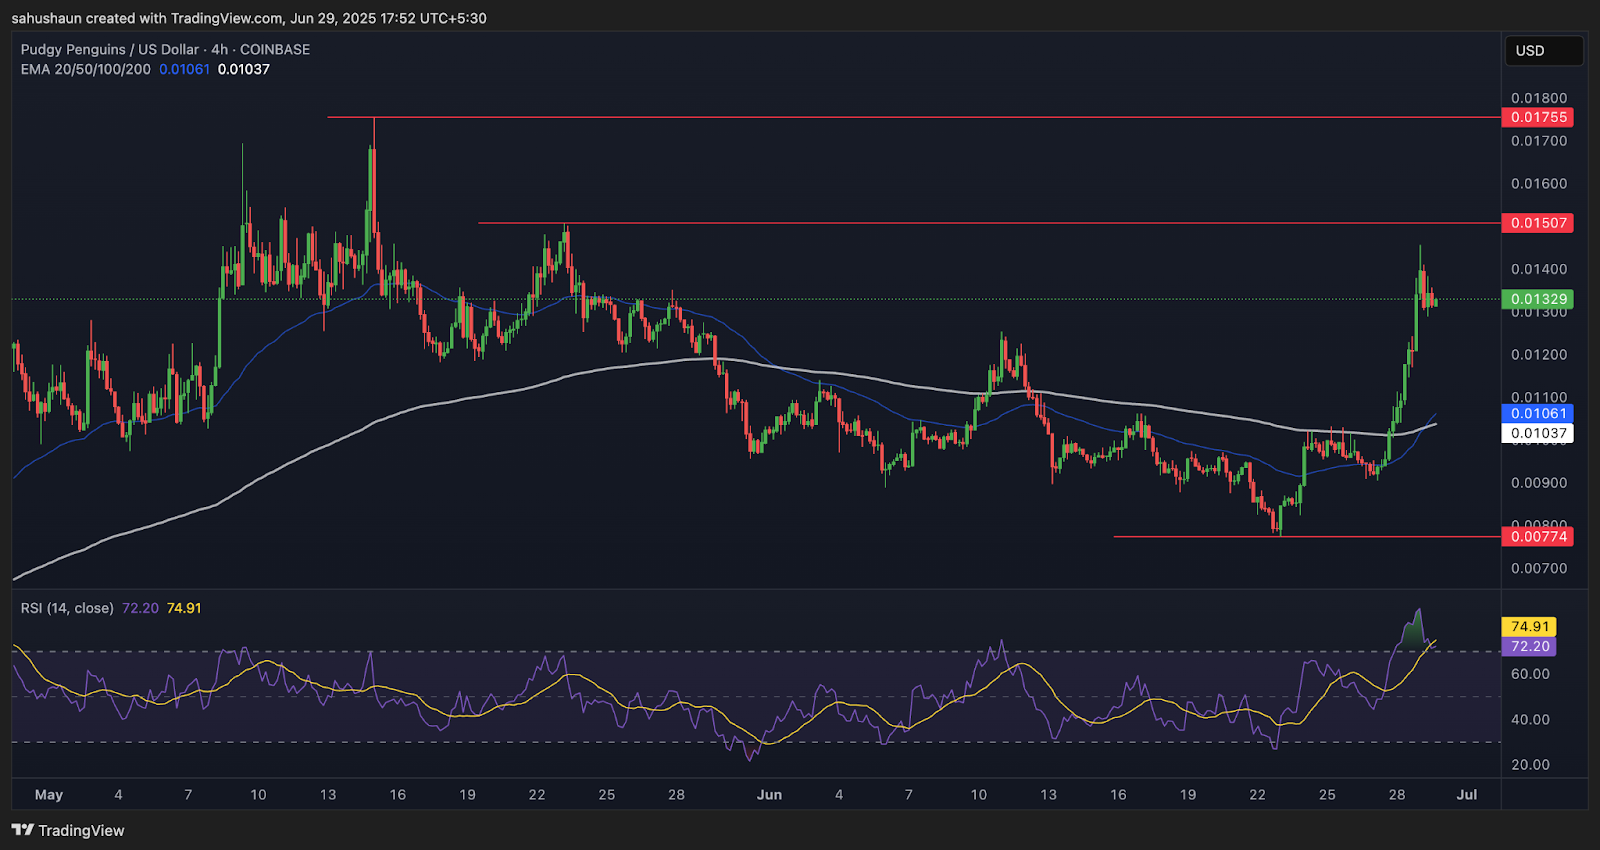
Source: Tradingview
The Supertrend indicator also supports the bullish trend as it shows a green signal, which indicates the overall positive direction of the trend. The green signal shows that the existing trend is in favour of long positions and that pullbacks are to be treated as possible buying signals and not as reversal signals.
In terms of support and resistance, PENGU has already defined important levels that will probably determine future price movement. Short-term support is located at 0.01300 and 0.01200, which can be used by traders who want to find good risk-reward ratios.
On the other side, the resistance levels at 0.01400 and 0.01507 are major obstacles that have to be broken to keep the bulls running. A break above these resistance zones successfully may cause further buying pressure and even a faster price increase. The combination of several bullish signals indicates that PENGU has a good chance to break these resistance points during the next sessions.
Highlighted Crypto News Today:
Metaplanet Bought Another 1,234 Bitcoin (BTC), Can This Trigger Little Pepe Presale?
0
0


 Manage all your crypto, NFT and DeFi from one place
Securely connect the portfolio you’re using to start.


0
0