
Bitcoin Is Stuck Under $80,000. What Does That Mean for XRP, Ethereum

0
0

Bitcoin, XRP, and Ethereum price action is stuck this week as BTC struggles to hold gains above $80,000.
Bitcoin slipped toward $78,700 on Tuesday, stuck in a corrective phase after last week's run to $81,500. XRP hovers near $1.40, and Ethereum sits below $2,500, both waiting on Bitcoin to pick a direction.
Traders are now watching two big dates. The Senate votes on the CLARITY Act on September 15. The Fed makes its rate call on September 16.
Both events could move Bitcoin, XRP, and Ethereum prices sharply in either direction.
What Does the Crypto Fear and Greed Index Show Today?
The Fear and Greed Index sits at 69 today, in Greed territory. That is down slightly from yesterday's 71 but close to last week's reading of 69.
Just last month, the index showed a Fear score of 31. The shift points to a notable jump in investor confidence over the past few weeks.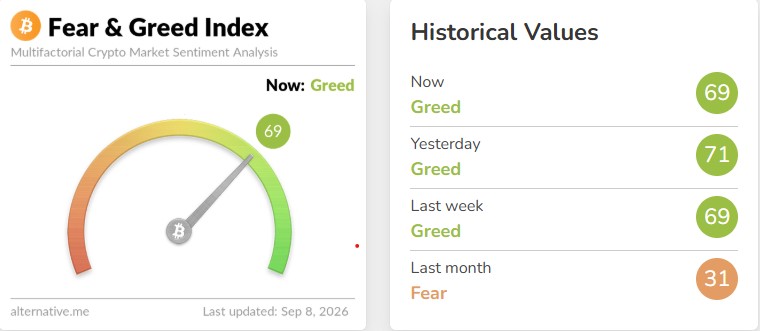
CoinGlass data shows the mood hasn't stopped liquidations, though. Over the past 24 hours, traders lost a combined $193.02 million, with 72,847 positions wiped out.
Ethereum led the losses at around $3.78 million, followed by Bitcoin near $2.79 million. Other coins hit include SOPH ($697.90K), SOL ($475.15K), ZEC ($392.07K), and DOGE ($287.03K). The single largest order was a $1.80 million BTC-USD liquidation on Hyperliquid.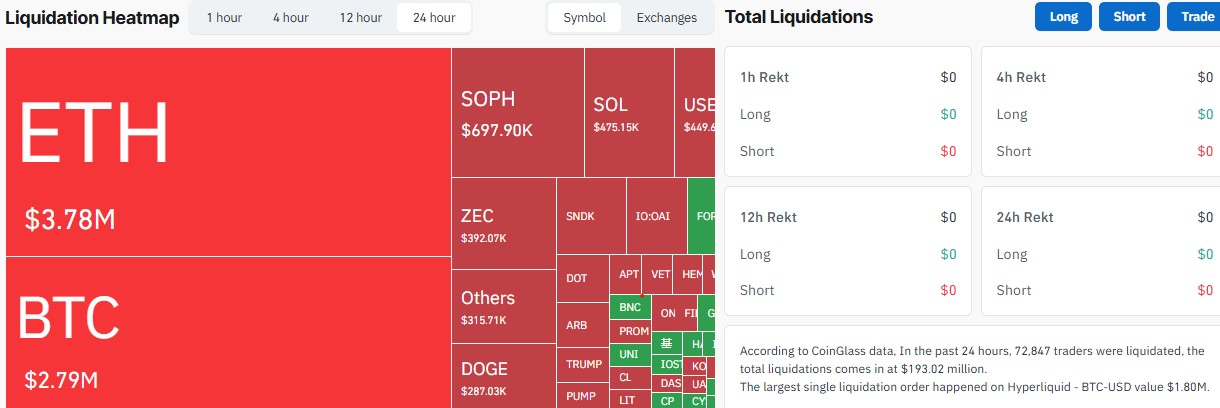
Why Is Bitcoin Price Down Today?
Bitcoin has failed to clear $82,000 twice since May. It hit that level in the second week of May and again in the first week of September. Sellers pushed it back down both times.
The coin trades near $78,700 as of September 8, 2026. That is well off its recent high.
Rising Fed rate hike odds are a big reason for the pullback. The current target rate sits at 350-375 basis points, and markets now price a 58.4% chance of a hike to 375-400 basis points on September 16, up from 34.6% just a week ago.
Higher rates make bonds and cash more attractive. That pulls money away from risk assets like crypto.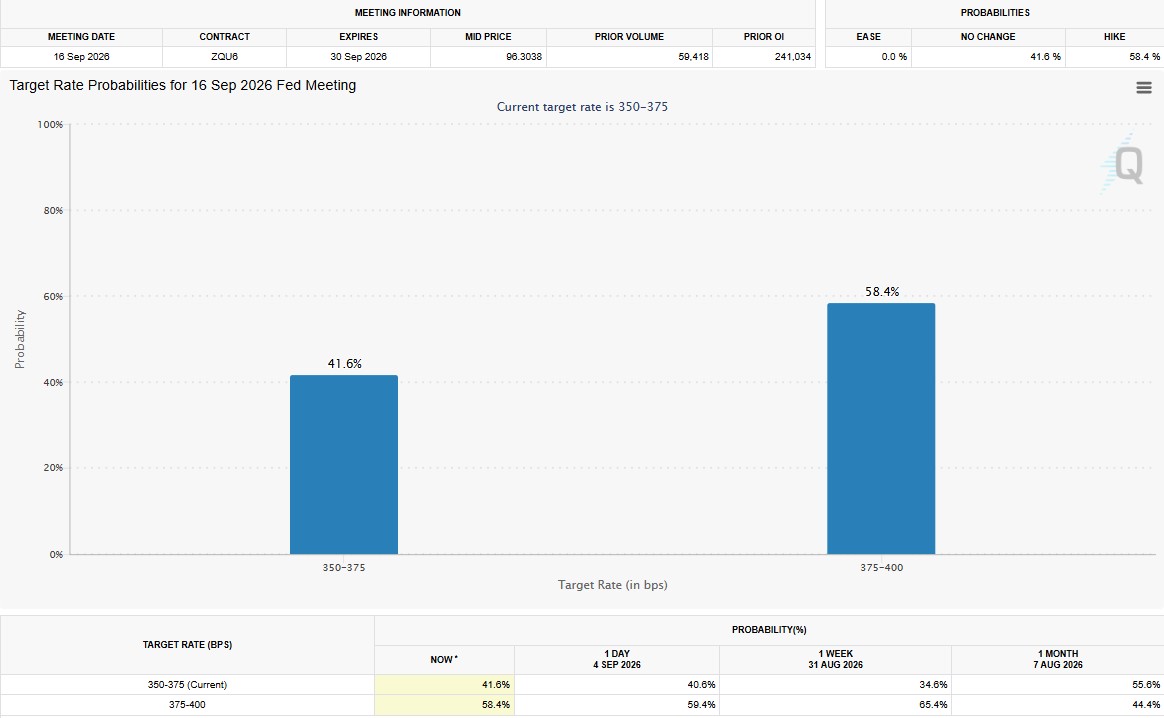
Bitcoin Price Levels to Watch This Week
Level | Price Zone | Meaning |
Support | $75,000 – $76,000 | First downside test; bulls need to defend this |
Resistance | $81,500 – $84,400 | May high zone, key breakout area |
Bull Target | $86,000 – $88,000 | Possible move if $84K clears |
Bear Target | $70,000 – $72,000 | Possible move if $75K breaks |
A four-hour close below $79,500 would shift focus to the $77,200 moving-average zone. A deeper break could bring $76,000 or even $70,500 into play, according to chart watchers tracking Bitcoin's fractal pattern.
On the upside, a daily close above $84,000 would open the door to $86,000 and then $88,000.
The golden cross that triggered recently is a mild long-term positive sign. But options data shows traders are hedged, not confident. Nobody wants to get caught off guard by the Fed.
What Is the Next Ethereum Price Target?
Ethereum is holding below $2,500, still trying to keep its broader uptrend alive.
On-chain data from Glassnode shows a support zone near $2,475, where roughly 2.86 million ETH previously traded hands. That is the level bulls need to defend.
If it holds, $2,722 becomes the next stop. Above that sits a heavy supply zone between $2,723 and $2,822, where more than 10 million ETH changed hands in the past. That zone could slow any rally.
On the four-hour chart, ETH is boxed inside a range between about $2,350 and $2,550. Chart watchers call this a symmetrical triangle, a pattern that often ends with a breakout move once price leaves the range.
A close above $2,550 could open a path toward $2,600 to $2,650. Losing $2,350 would weaken the bullish case and could send ETH back toward $2,430 or lower.
Some traders are eyeing much bigger long-term targets near $4,811 and even $8,500. These remain speculative levels tied to older chart patterns, not confirmed paths.
Is XRP Price Going to $60?
XRP trades around $1.40 in early September, still well below its 2025 high.
The token climbed nearly 30% in August, moving from about $1.06 to an intra-month high near $1.50 on August 24, before settling around $1.35 by month-end.
Resistance now sits between $1.47 and $1.53. A close above that zone could open the door toward $1.80 to $2.30, according to short-term analysis from chart watcher ChartNerdTA.
Analyst Ali Martinez has pointed to a longer-term pattern he calls a massive ascending triangle building on XRP's monthly chart for nearly ten years.
He flags $3.66 as the key resistance level. A monthly close above that price, he says, would confirm a breakout and open a technical target near $60.
That is a bold call. XRP would need to more than double just to test $3.66 first. The $60 figure is a long-term projection, not a promise.
On shorter time frames, Martinez has also flagged a descending triangle on the hourly chart. An hourly close above $1.40 could trigger a smaller move toward $1.46.
Separately, on-chain researcher EGRAG Crypto studied XRP's three past market cycles. Those cycles saw gains of 2,405%, 1,002%, and 1,250%.
The arithmetic average works out near 1,552%, with a geometric mean around 1,444%. EGRAG was careful to note this is a historical study, not a guarantee of a repeat.
How Will the Fed Decision Affect Crypto Prices?
The Fed meets on September 16, one day after the Senate's CLARITY Act cloture vote. That bill needs 60 votes to move forward in the Senate.
Polymarket now prices the bill becoming law in 2026 at about 18%, a sharp drop from 90% back in February. Part of the recent rally was built on bets the bill would pass, so a failed cloture vote could take away buyers' main reason to hold.
A quarter-point rate hike would likely push bond yields higher. When government bonds pay close to 5%, some savers move money out of coins that pay no yield at all.
Research from the IMF has found that Fed tightening tends to weaken crypto prices through what's called the risk-taking channel. In simple terms, investors pull back when borrowing costs more.
XRP and other altcoins could see bigger swings than Bitcoin, since they tend to have thinner liquidity.
Still, a hike does not guarantee a crash. Since most traders already expect the move, some of it may already be priced in. If Fed Chair Kevin Warsh signals no more hikes are coming after this one, markets might shrug it off or even rally on relief.
Bottom Line
Bitcoin remains stuck in a holding pattern below $80,000, caught between a bullish golden cross signal and a nervous bond market.
Watch $75,000 on the downside and $84,000 on the upside. Whichever level breaks first will likely set the tone for the rest of September.
Ethereum's next move depends on whether it can clear $2,550, while XRP faces its own test at $1.47 to $1.53 in the short term and $3.66 much further out.
The Fed's September 16 decision and the Senate's September 15 cloture vote on the CLARITY Act stand out as the two biggest catalysts on the calendar. Both could decide which direction Bitcoin, Ethereum, and XRP head next.
Disclaimer
This article is for informational purposes only and should not be considered financial, investment, or trading advice. Cryptocurrency markets are highly volatile and carry significant risk. Price levels, targets, and analyst opinions mentioned in this article are speculative and not guaranteed outcomes. Always conduct your own research and consult a licensed financial advisor before making any investment decisions.
0
0


 Manage all your crypto, NFT and DeFi from one place
Securely connect the portfolio you’re using to start.


