
Price Prediction 9/22: BTC, ETH, BNB, XRP, SOL, ZEC

0
0

ZEC gained an impressive 20% last Wednesday despite bearish expectations. Interestingly, the uptick was not limited to this asset, as several altcoins also recorded notable gains during the session.
These assets have maintained their uptrend over the last few days, reaching levels not seen in months. For example, NEAR gained a striking 90% over the last seven days, reaching levels last seen in January 2025.
At the time of writing, ZEC is recovering from a recent decline. It flipped green on Tuesday following a red performance the previous day. It remains to be seen how high the asset can go in the coming days.
Away from ZEC, the total crypto market cap is down by a few percent. Following a more than 5% surge on Monday, the recent decline appears relatively healthy. Indicators such as the Moving Average Convergence Divergence (MACD) and Relative Strength Index (RSI) remain positive, suggesting that upward momentum could resume.
Meanwhile, the global economy is grappling with considerable uncertainty about what lies ahead. Tensions between world leaders are reaching a boiling point, raising concerns that they could spill over into broader economic disruption. Many are wondering how cryptocurrencies will react to these conditions.
Let’s see what the charts say.
BTC/USD
BTC retested its eight-month high on Monday, flipping $84K and $87K in quick succession. Both levels were expected to be difficult to break, considering they had previously acted as strong support zones.
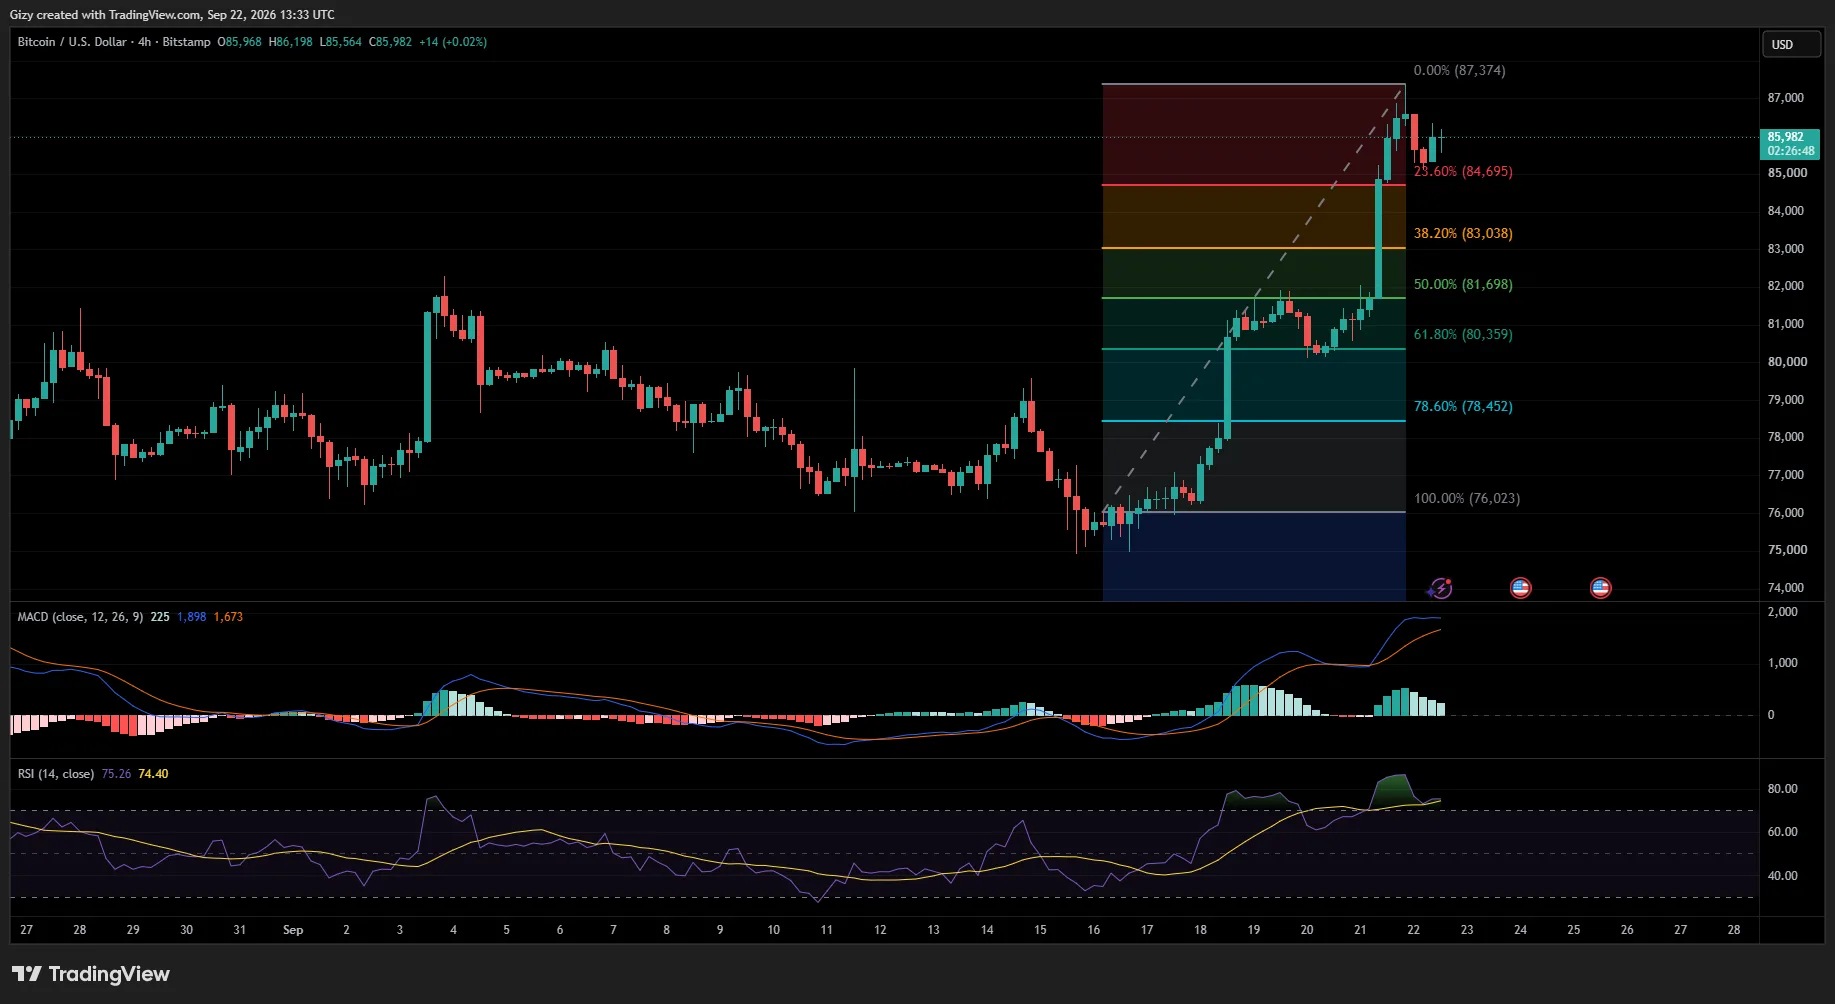
After breaking above these levels, however, the upward momentum waned. The apex coin is currently facing significant selling pressure below $86K. Meanwhile, the 4-hour chart warns of potentially steeper declines ahead.
The Relative Strength Index (RSI) is currently above 70, meaning the asset remains overbought amid the ongoing selling pressure. Based on the RSI reading, further declines could occur in the coming hours.
Adding to the concerns is the MACD, which is displaying a bearish convergence. Taken together, both metrics suggest that further downside could be ahead.
Amid these signals, the Fibonacci retracement levels place the first line of defense at $84,700. The likelihood of this level failing remains high given the relatively slight demand concentration around it. Nonetheless, the 50% Fibonacci level at $81,700 is a stronger level to watch.
ETH/USD
Ethereum recently failed to hold above the first pivot resistance on the 4-hour chart. After briefly flipping the level on Monday, it succumbed to notable selling pressure. A closer look at the chart indicates that ETH is not far from R1, suggesting that another attempt to break above the level could be likely..
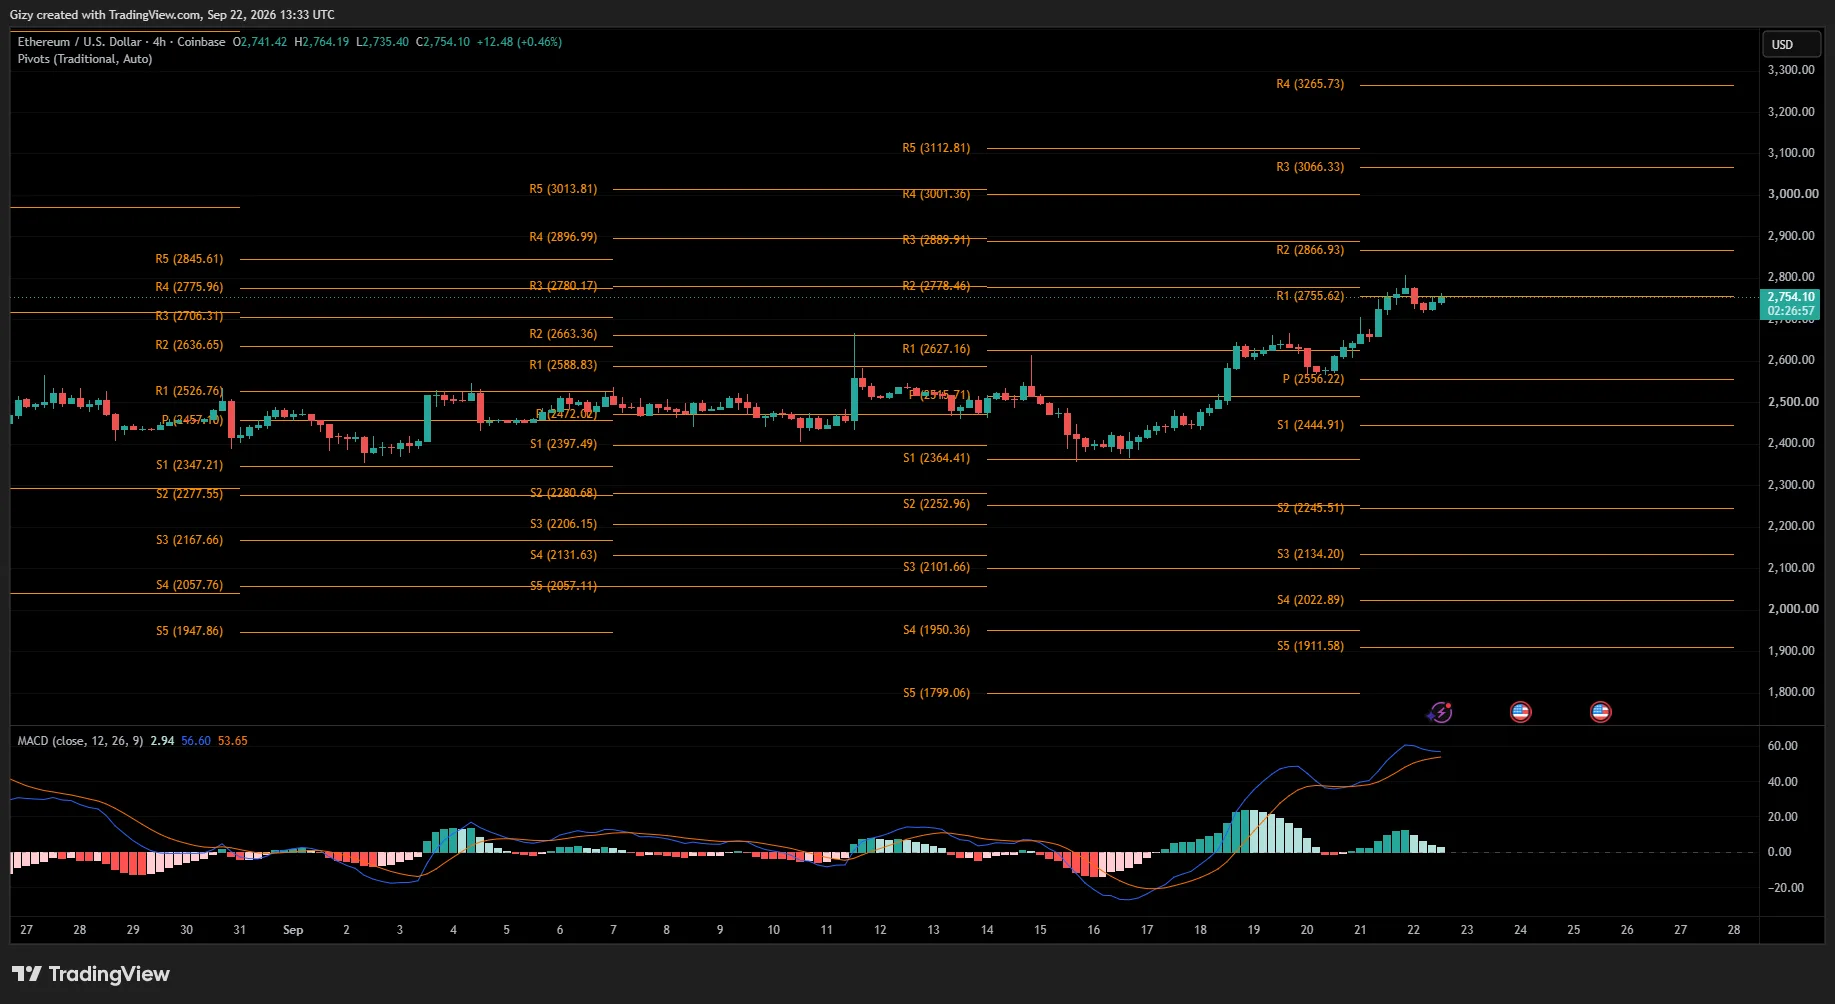
Meanwhile, the standard pivot points indicate what could happen if ETH loses $2,720. The asset could continue downward toward the pivot point at $2,550.
The MACD also points to a high probability of this scenario playing out. The indicator is showing an impending bearish crossover, which could herald further declines.
Away from the current readings, the previous intraday session was one of the most bullish for ETH. The asset gained almost 5%, surging above $2,800 for the first time in months.
Interestingly, while the short-term outlook remains bearish, the 1-day chart still shows room for further upside. It remains to be seen which scenario plays out first.
BNB/USD
BNB has given up more than half of what it gained on Monday. Like other assets, it reached levels not seen in months before facing a notable pullback alongside the broader crypto market.
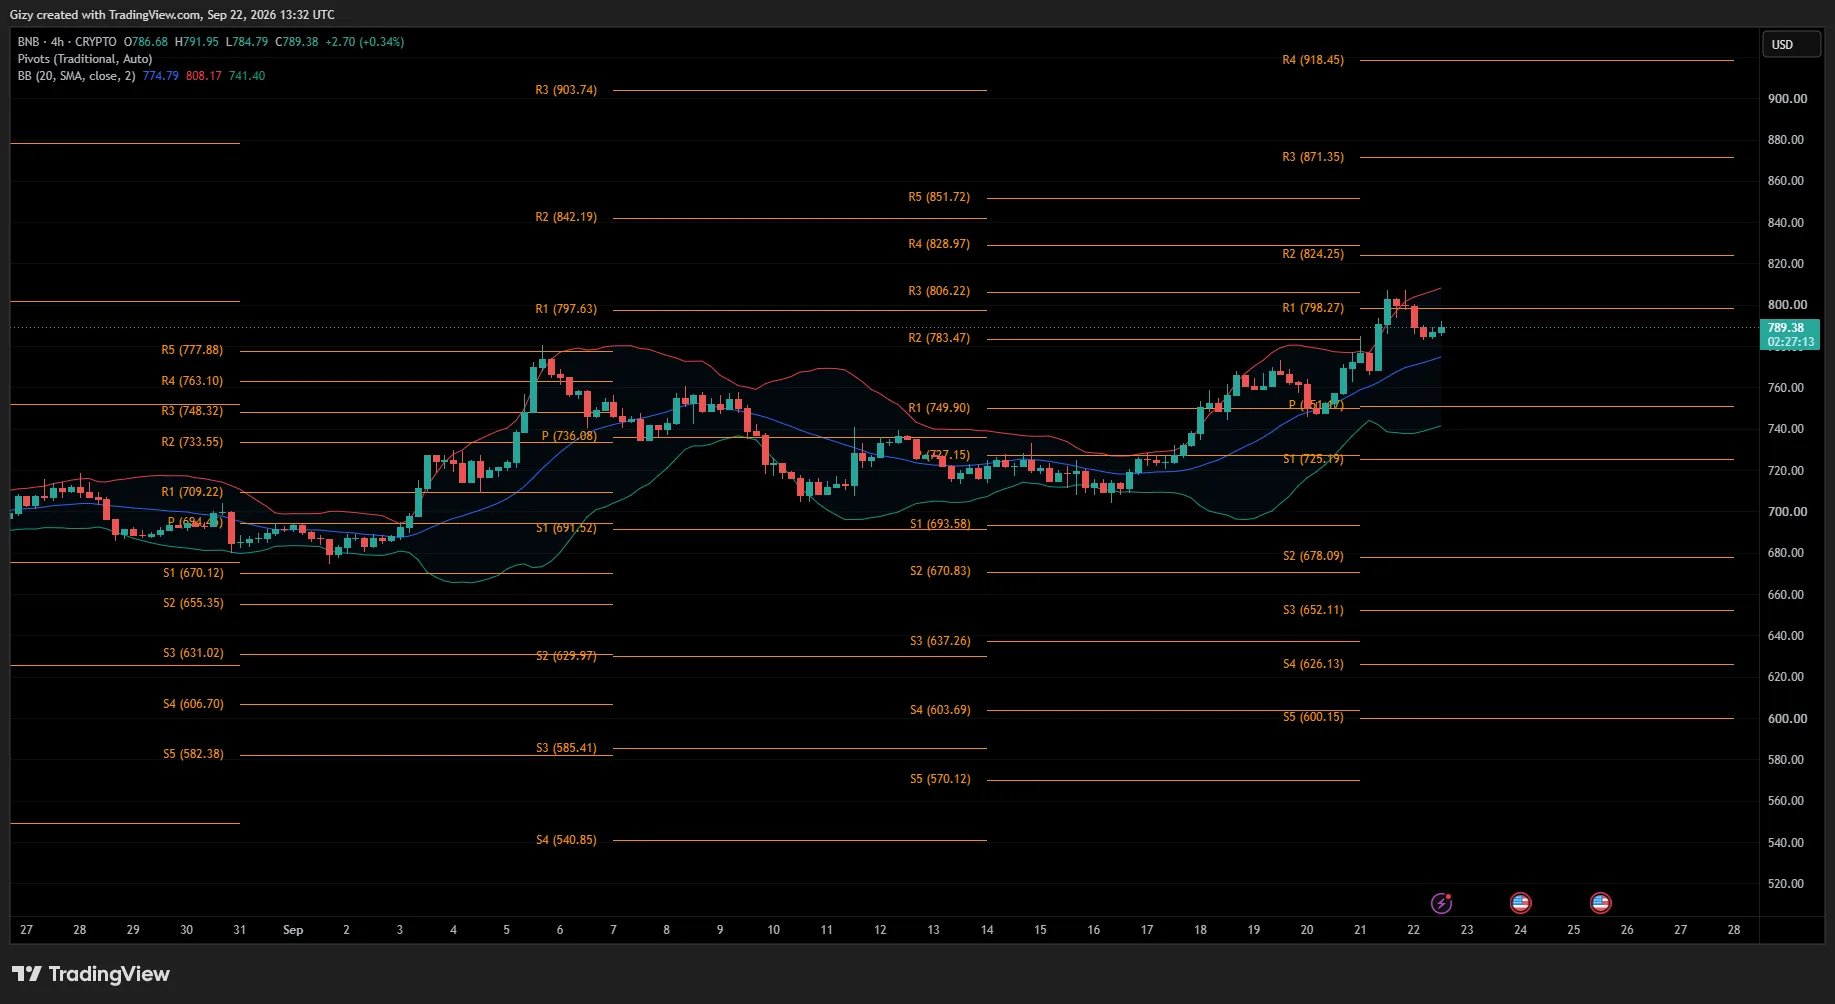
Nonetheless, the 4-hour chart shows that BNB has held above $780 over the last eight hours. Its recent consolidation around this level suggests a growing possibility of a trend reversal in the coming hours.
If that happens, the pivot points suggest $840 as the next potential target.
However, the Bollinger Bands indicate that the chances of an immediate uptick may be limited. BNB recently faced rejection at the upper band and has since declined, with previous price action identifying the middle band as the next likely stop.
XRP/USD
Like ZEC, XRP is seeing notable gains on Tuesday. It continues to trade above $1.52 despite facing slight selling pressure a few hours ago.
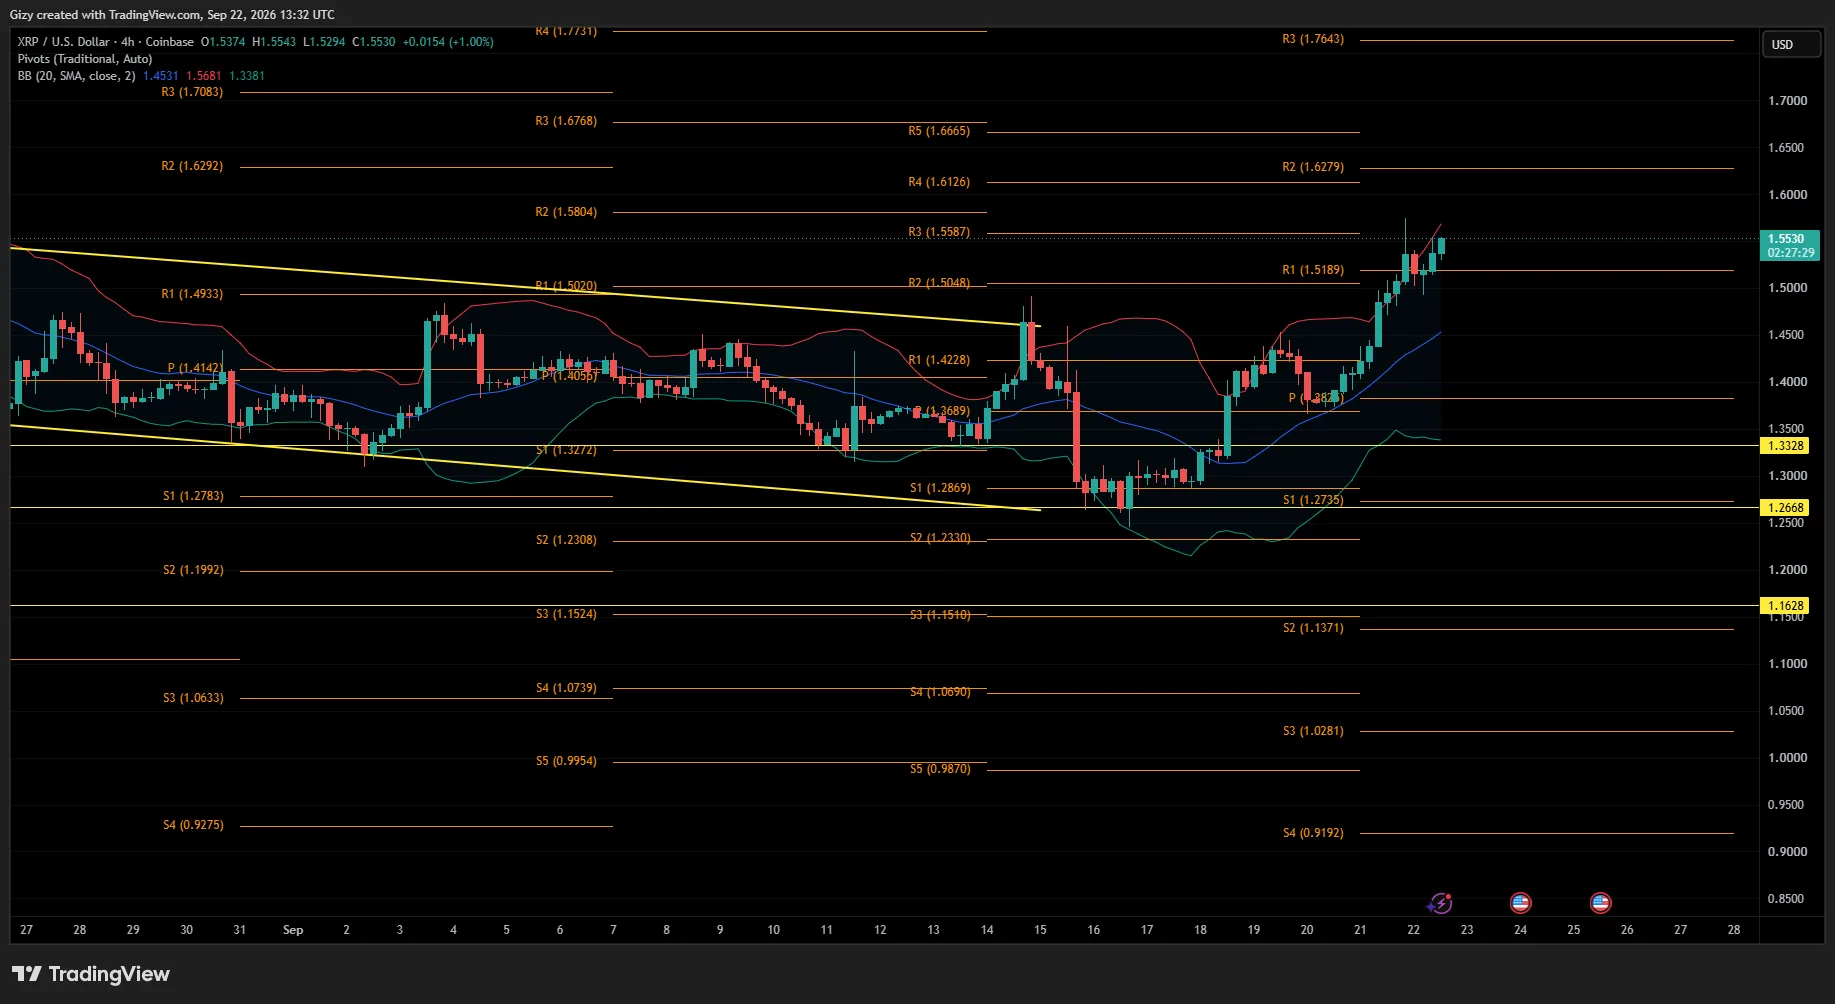
The correction followed an attempt to break above $1.58. While that attempt failed, Monday was one of XRP’s most bullish sessions in the last 14 days, with the asset gaining almost 9%.
The pivot points suggest that if the upward trajectory continues, the altcoin could retest the second pivot resistance at $1.62.
Conversely, XRP has traded close to the upper Bollinger Band for an extended period. This raises the possibility of a reversal, with the pivot points identifying $1.40 as the next level to watch.
SOL/USD
Solana surged almost 7% on Monday, edging close to $120. It registered a milestone like most of the highlighted assets but faced notable selling pressure after reaching its peak.
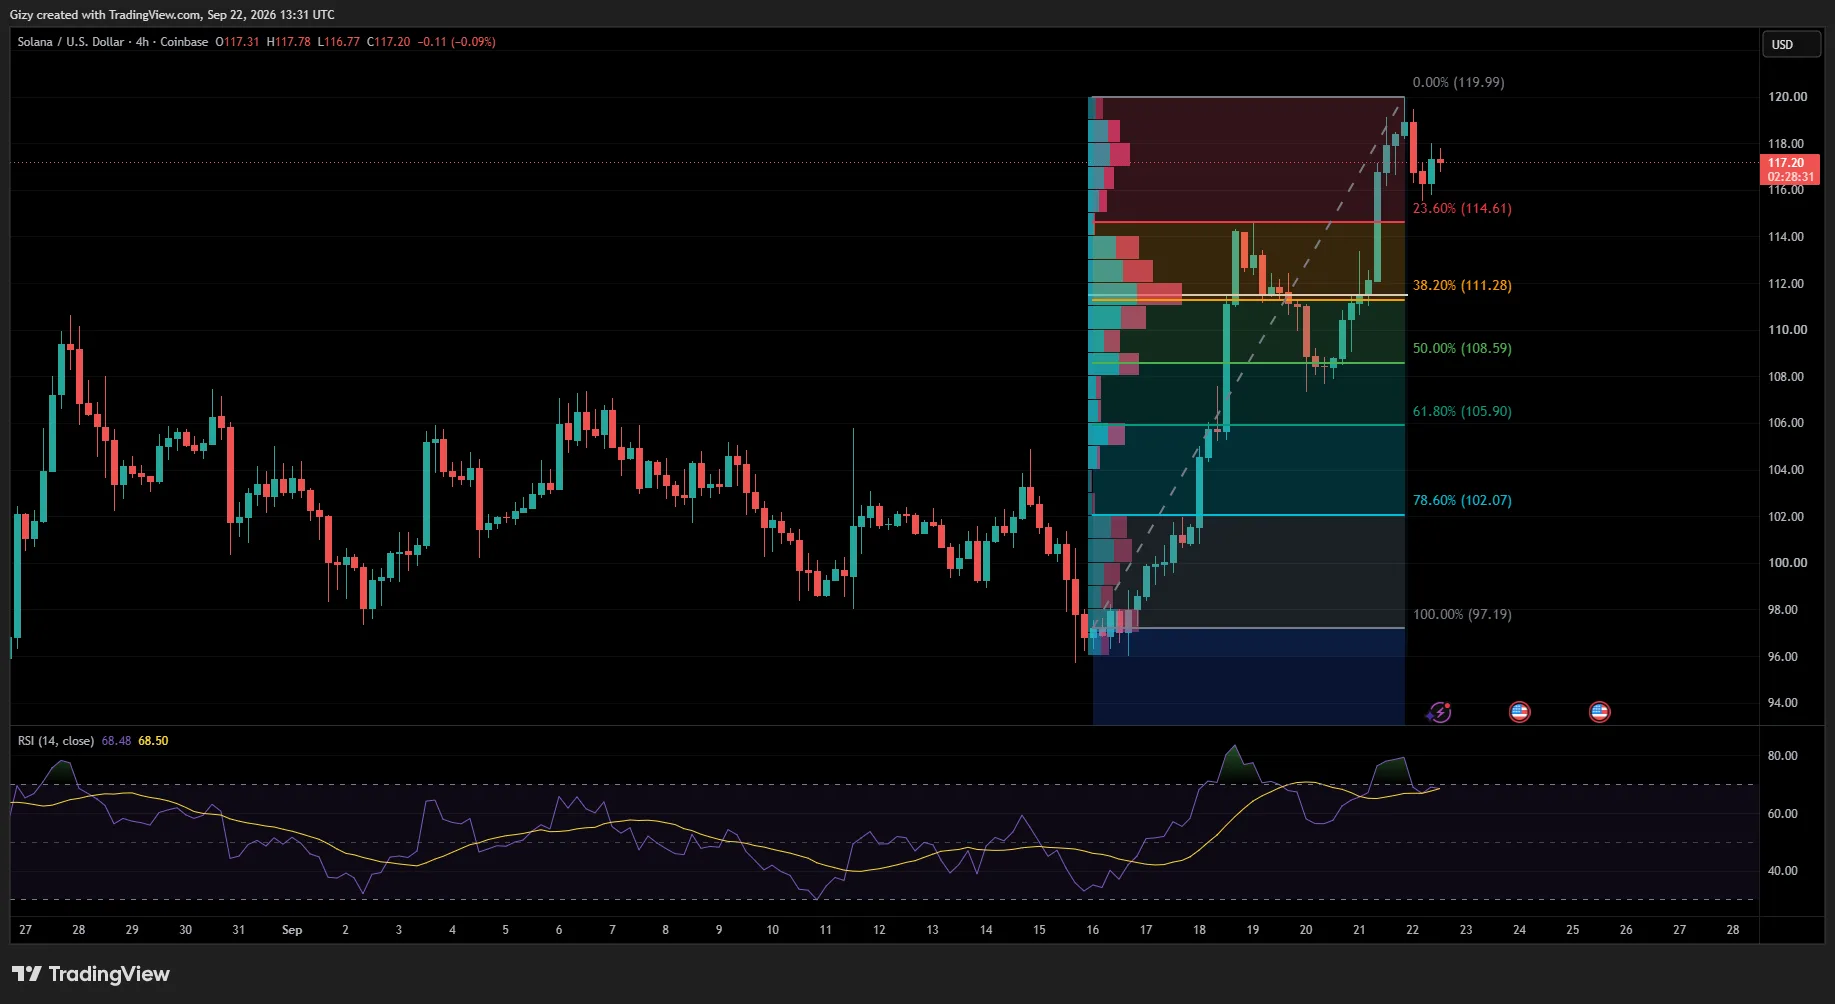
The decline continued into Tuesday, resulting in an almost 3% loss.
However, like ZEC, SOL is seeing notable buying activity. It has recovered more than half of its previous losses and appears set to attempt the $120 resistance again.
Interestingly, the volume profile suggests that the asset has considerable capacity to break above this level. The fixed volume profile shows SOL trading within an area that could be considered a point of concentration.
If SOL breaks above $120, its next potential stop could be $128.
ZEC/USD
ZEC is trading within a symmetrical triangle, as shown in the chart below. The 4-hour chart suggests that the asset could continue trading within this pattern over the next two days and outlines a possible price path.
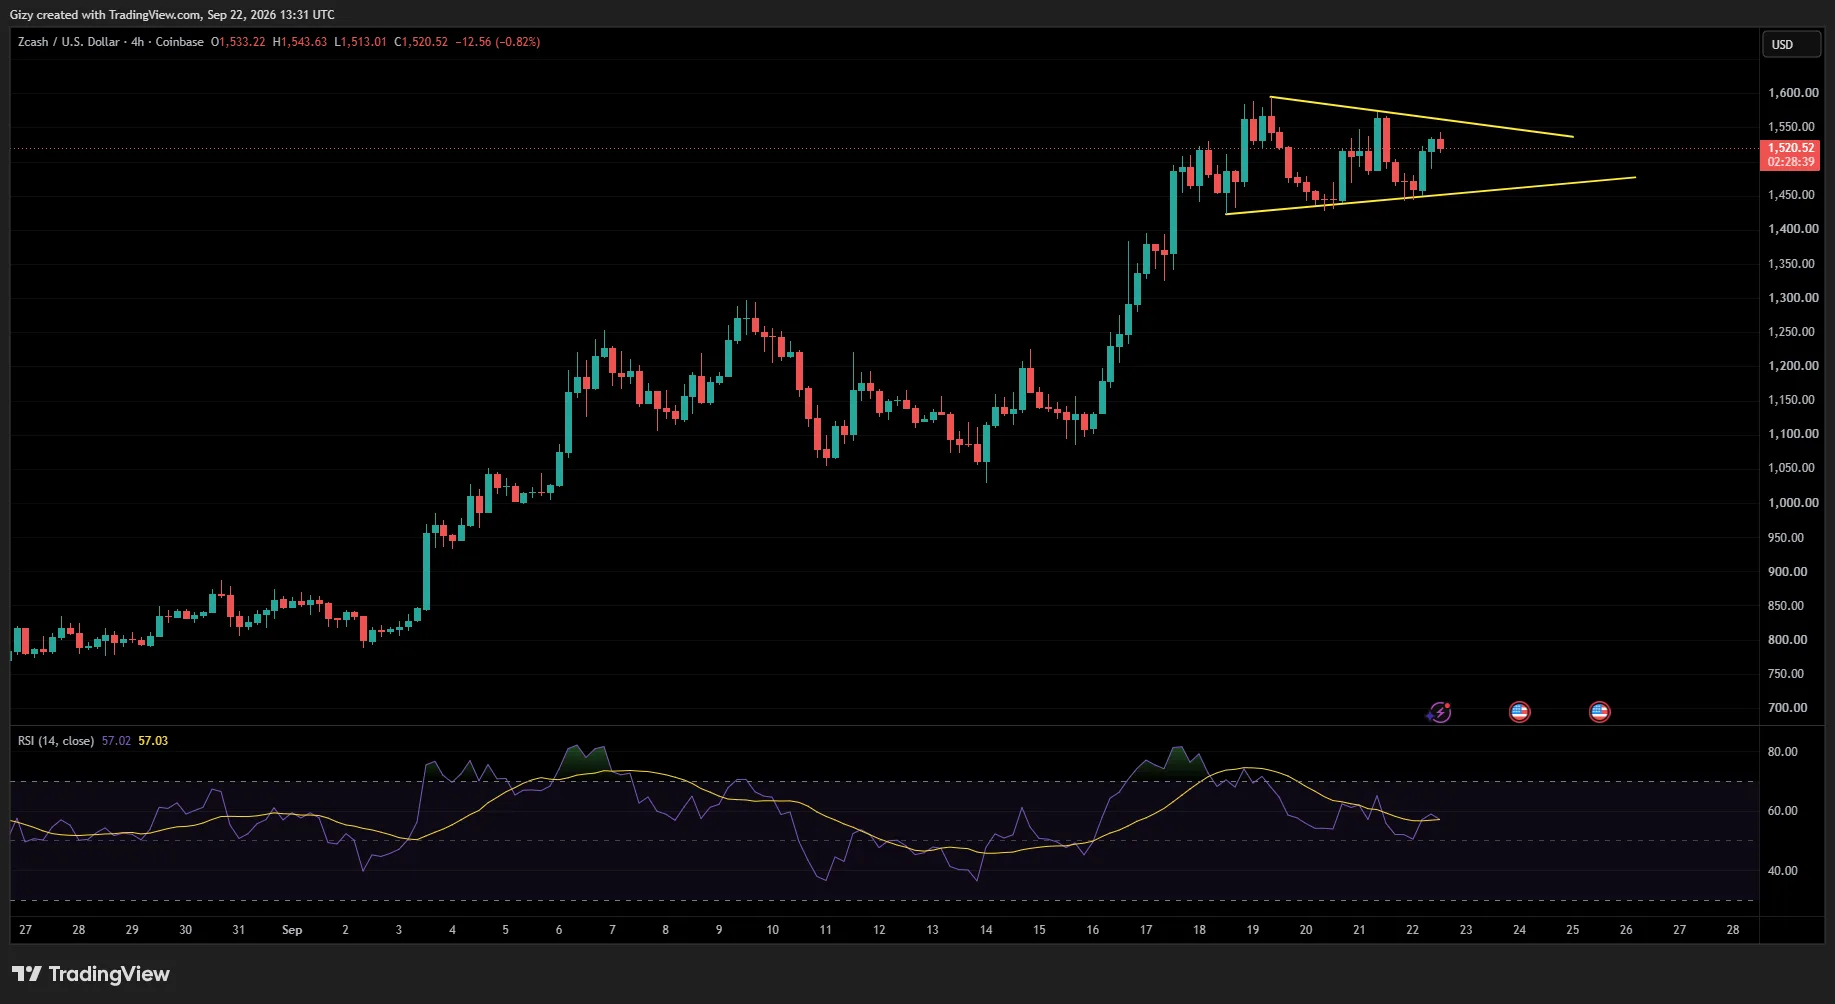
The asset is trading at $1,515, as predicted, at the time of writing. If it continues moving within the triangle, it could reach $1,550 before experiencing another decline toward $1,450.
It will likely continue bouncing between these levels over the next 48 hours.
The RSI shows that buying pressure is declining on the larger timeframe. The indicator has been trending lower since Friday amid ZEC’s volatile price action.
Taken together, the current signals point to a high likelihood that the eventual breakout from the chart pattern will be to the downside.
The post Price Prediction 9/22: BTC, ETH, BNB, XRP, SOL, ZEC appeared first on CoinTab News.
0
0


 Manage all your crypto, NFT and DeFi from one place
Securely connect the portfolio you’re using to start.


