Daily Market Review: BTC, ETH, COTI, PNG, MNT

3
1

Today’s market session has started with a bullish sentiment as attributed to the increase in the global market, which has recorded a 1.3% increase in the last 24 hours to $1.99 trillion as of press time, while the trading volume saw an 18% decrease to $49 billion at press time.
Bitcoin Price Review
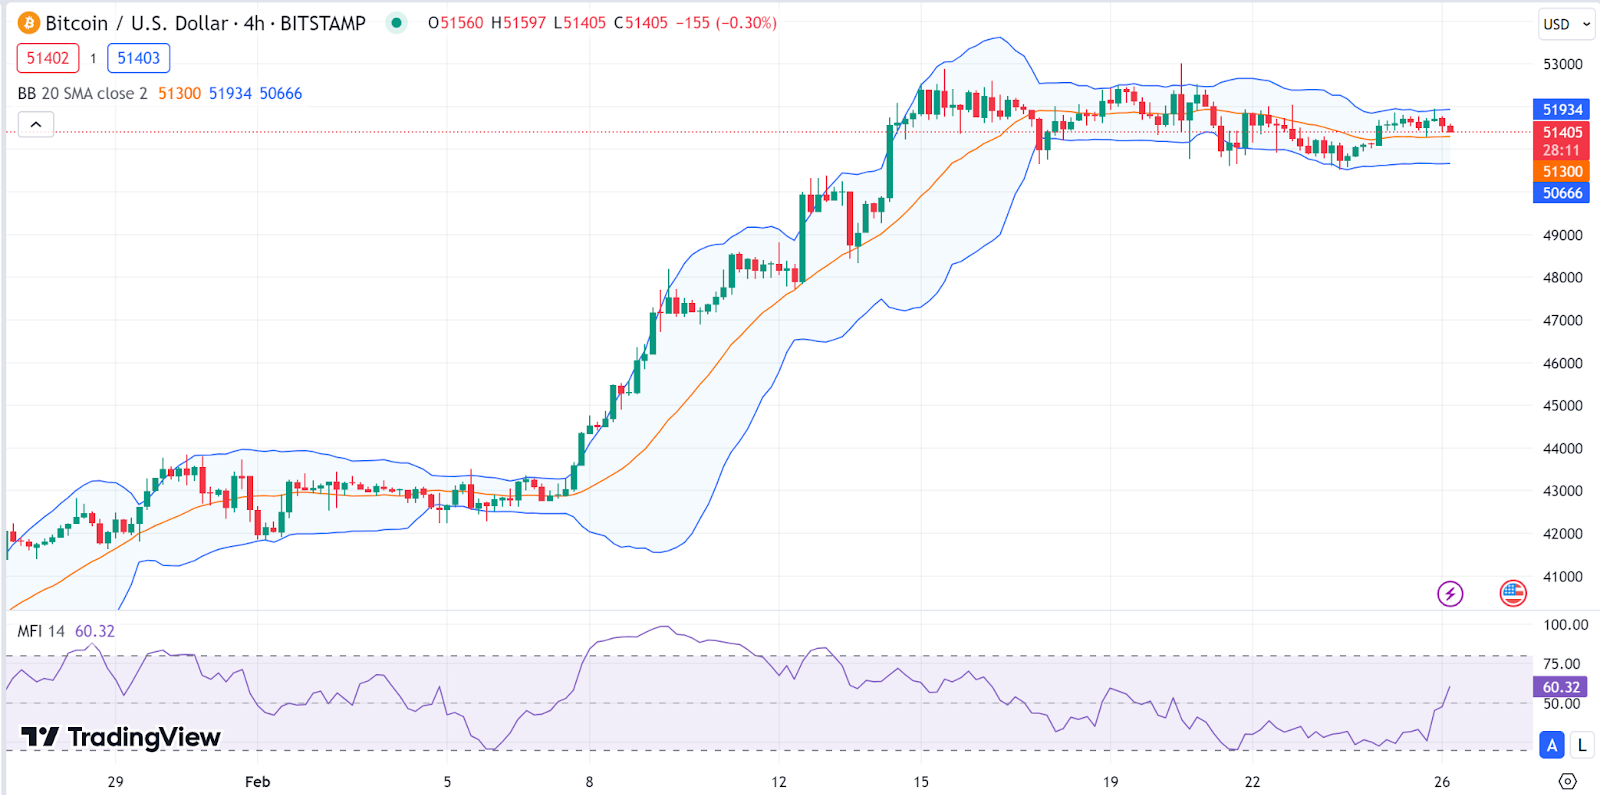
The 4-hour Bitcoin (BTC) charts show that the Bollinger Bands are relatively tight, indicating low volatility. The Bitcoin price is oscillating around the 20-period simple moving average (SMA), which suggests consolidation. In line with this, *BTC* is currently facing low volatility levels as shown by the Bollinger Bands, which are currently close to each other.
The Money Flow Index (MFI) is around 60, which indicates a moderate balance between buying and selling pressure. Despite the general bullish sentiment, the Bitcoin price stood at $51.3K as of press time, representing a 0.7% decrease within the last 24 hours.
Ethereum Price Review
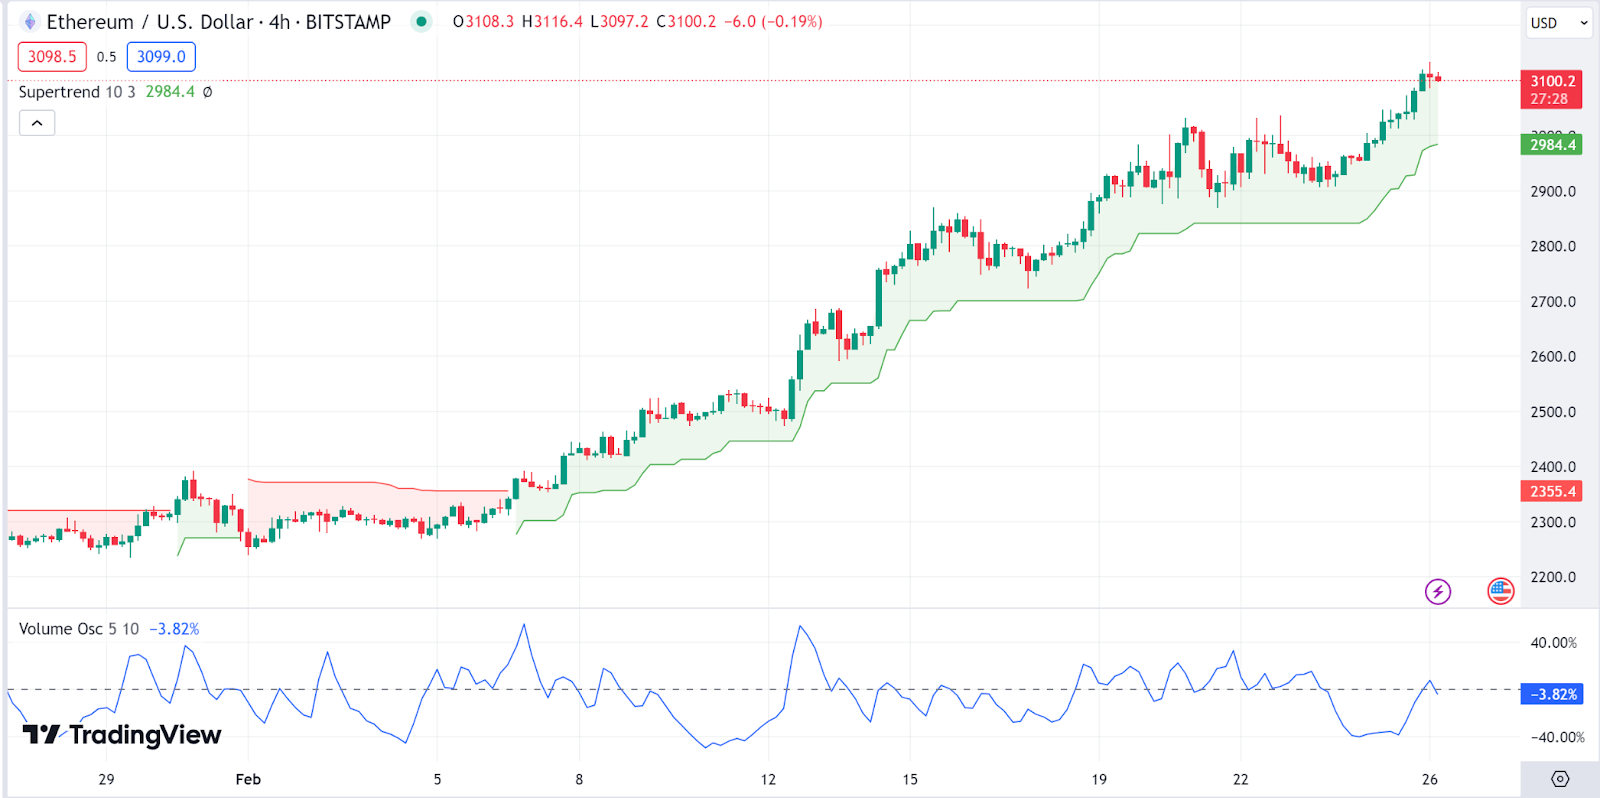
*ETH* is showing an uptrend, consistently trading above the SuperTrend indicator, which suggests bullish momentum. The Ethereum price is above the green SuperTrend line, which may be a dynamic support level.
The Volume Oscillator is below zero, suggesting a decrease in volume, which could indicate that the current uptrend might be losing some steam. The Ethereum price stood at $3091 as of press time, representing a 1.9% increase within the last 24 hours.
COTI Price Review
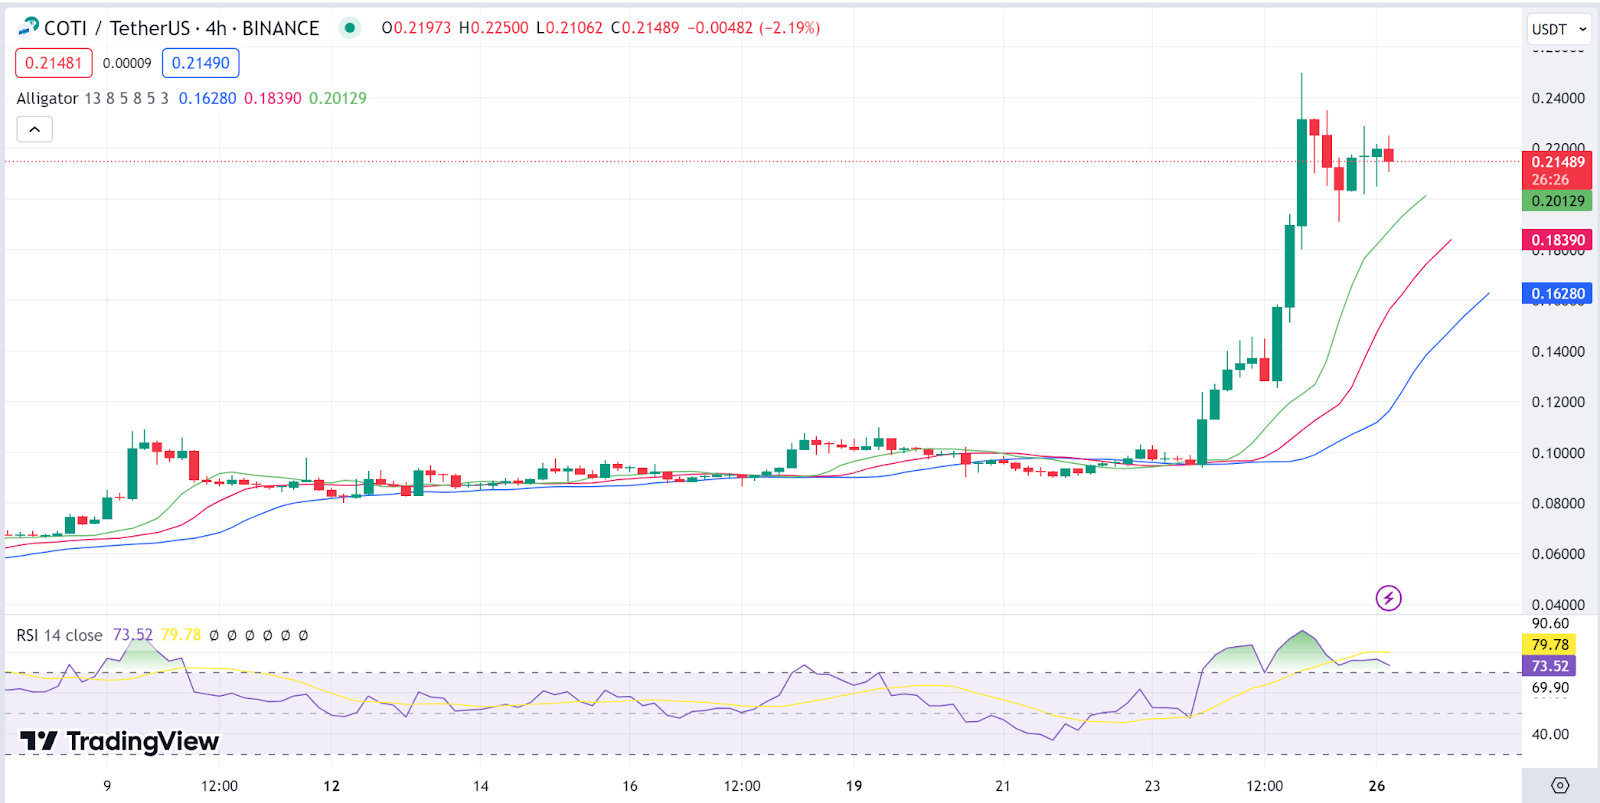
COTI is also on an uptrend, as the Alligator indicator indicates. The jaw (blue line), teeth (red line), and lips (green line) are well aligned and open up, which is a bullish sign. The COTI price is above all three lines of the Alligator indicator, reinforcing the bullish trend.
The Relative Strength Index (RSI) is around 73, which is in the overbought territory, suggesting caution as there might be a potential for a pullback or consolidation. Owing to this, COTI is now facing corrections, as seen from the COTI price, which stood at $0.221 as of press time, representing a 1.16% decrease within the last 24 hours.
Pangolin Price Review
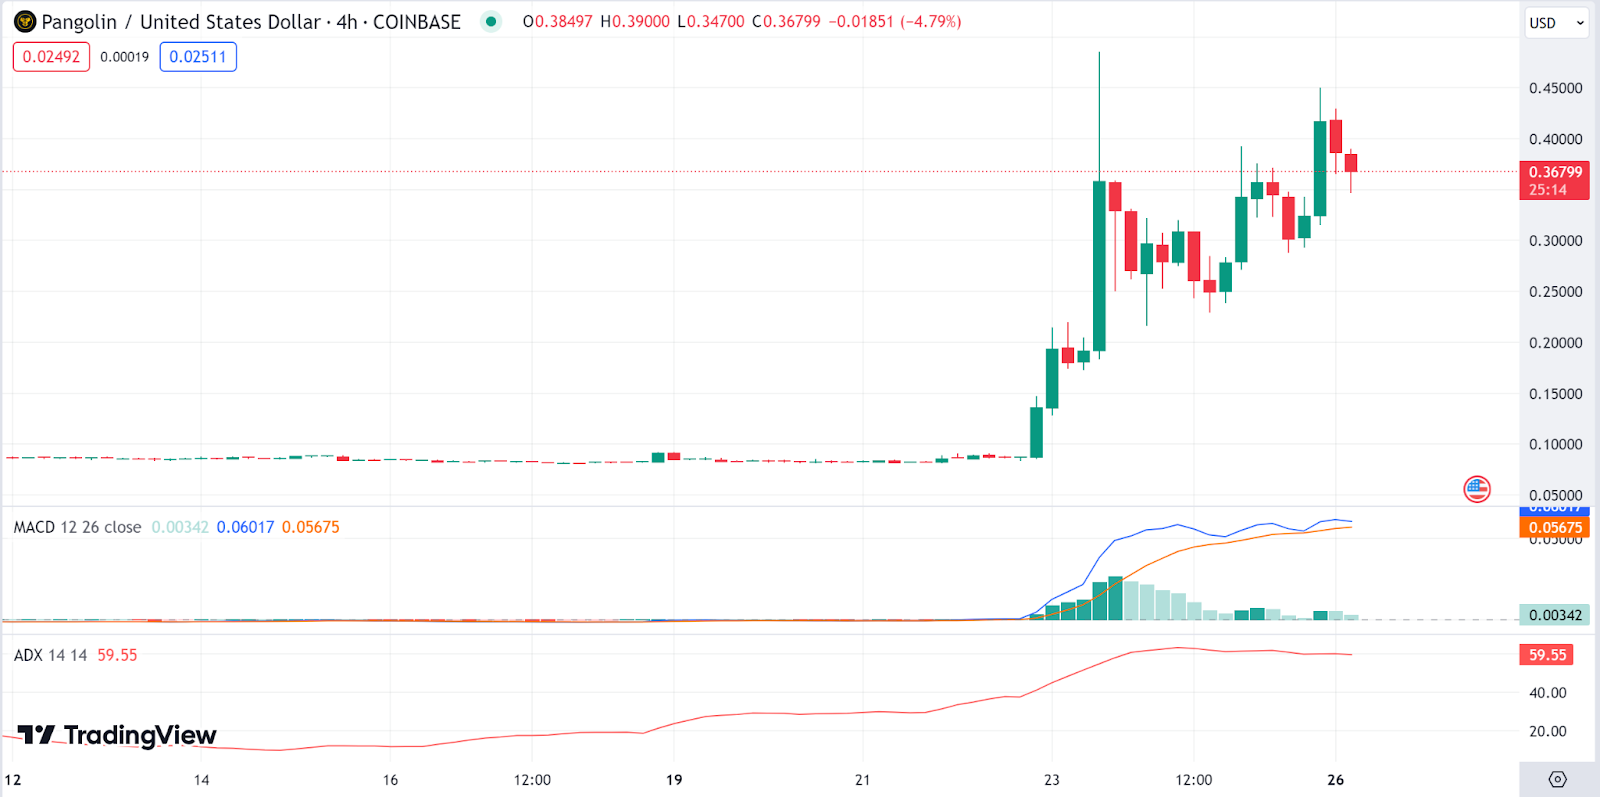
Pangolin (PNG) charts show a recent spike in Pangolin price with increased volatility. The Moving Average Convergence Divergence (MACD) is above the signal line but appears to converge, indicating a potential slowdown in the upward momentum.
The Average Directional Index (ADX) is above 50, indicating a firm trend, in this case, a strong upward movement. The Pangolin price stood at $0.3616 as of press time, representing a 1.6% increase within the last 24 hours as it emerged among today’s gainers.
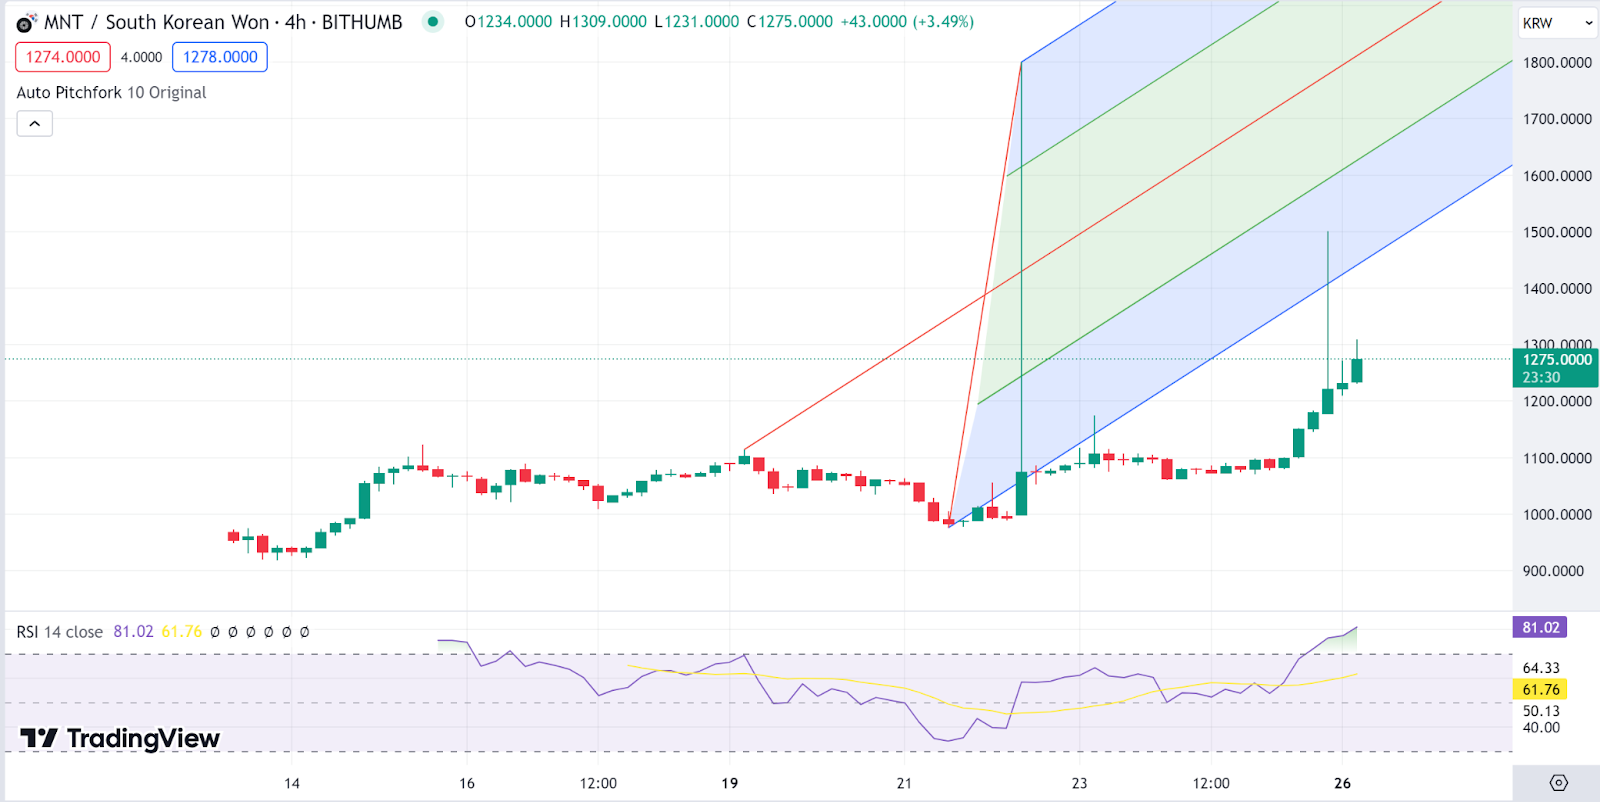
Mantle Price Review
Looking at the 4-hour Mantle (MNT) charts, we notice that the Mantle price is experiencing a strong uptrend, as indicated by the steep pitchfork channels. The Mantle price has sharply moved away from the median line of the pitchfork, suggesting intense buying pressure.
The RSI is above 80, in the overbought zone, signaling that the market might be overextended and due for a correction or consolidation. The Mantle price stood at $0.9262 as of press time, representing an 18% increase within the last 24 hours.
3
1


 Manage all your crypto, NFT and DeFi from one place
Securely connect the portfolio you’re using to start.

0
0


0
0