Pi Network (PI) Tries To Reclaim $2 But Momentum Could Be Fading

0
0


After hitting a peak of $2.99 on February 27, Pi Network is down nearly 40% in the past two weeks. Technical indicators suggest that PI momentum is stabilizing.
The DMI shows that buying pressure has surged in the past two days, but the ADX has declined, signaling that the strength of the trend may be weakening. Meanwhile, RSI has spiked from oversold levels, approaching overbought territory, which could either lead to consolidation or a continuation toward key resistance levels.
PI Network DMI Shows Uptrend Is Still Here
PI’s DMI chart indicates that the Average Directional Index (ADX) has declined to 30.6 from 36.5 over the past two days. ADX measures trend strength, with values above 25 generally indicating a strong trend, while values below 20 suggest a weak or consolidating market.
A rising ADX signals strengthening momentum, whereas a declining ADX suggests a weakening trend, even if price action continues in the same direction.
The current drop in ADX suggests that while PI remains in an uptrend, the momentum behind this movement is softening.
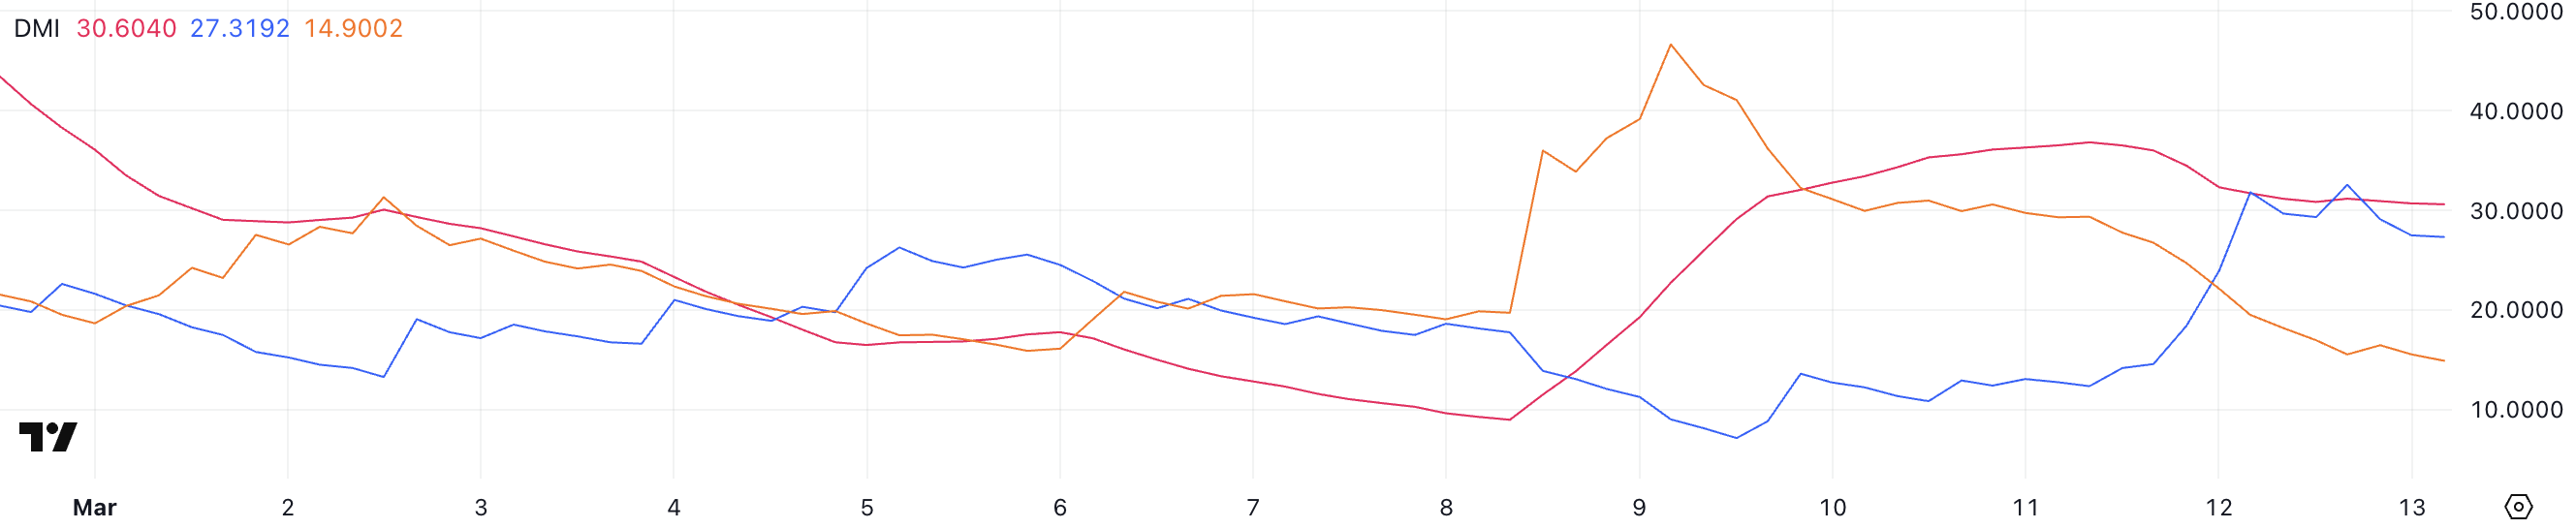 PI DMI. Source: TradingView.
Looking at the Directional Indicators (+DI and -DI), +DI has surged to 27.3 from 12.3 two days ago but has remained stable since yesterday, while -DI has sharply dropped to 14.9 from 29.3. This shift indicates that buying pressure has significantly increased over the past two days, overwhelming prior selling pressure.
However, with +DI now stable and ADX declining, the strong buying momentum seen earlier may be fading. This doesn’t necessarily mean an immediate reversal, but it suggests the uptrend could slow or enter a consolidation phase unless renewed buying strength pushes the ADX back up.
Pi Network RSI Surged In The Last Two Days
PI’s Relative Strength Index (RSI) has climbed sharply to 60.90, up from 34.8 yesterday and 19.5 four days ago. RSI is a momentum oscillator that measures the speed and magnitude of price movements on a scale from 0 to 100.
Generally, RSI values above 70 indicate overbought conditions, suggesting potential for a pullback, while values below 30 signal oversold conditions, often preceding a price recovery.
The rapid rise from deeply oversold levels to near 61 suggests a strong shift in momentum, with buyers regaining control.
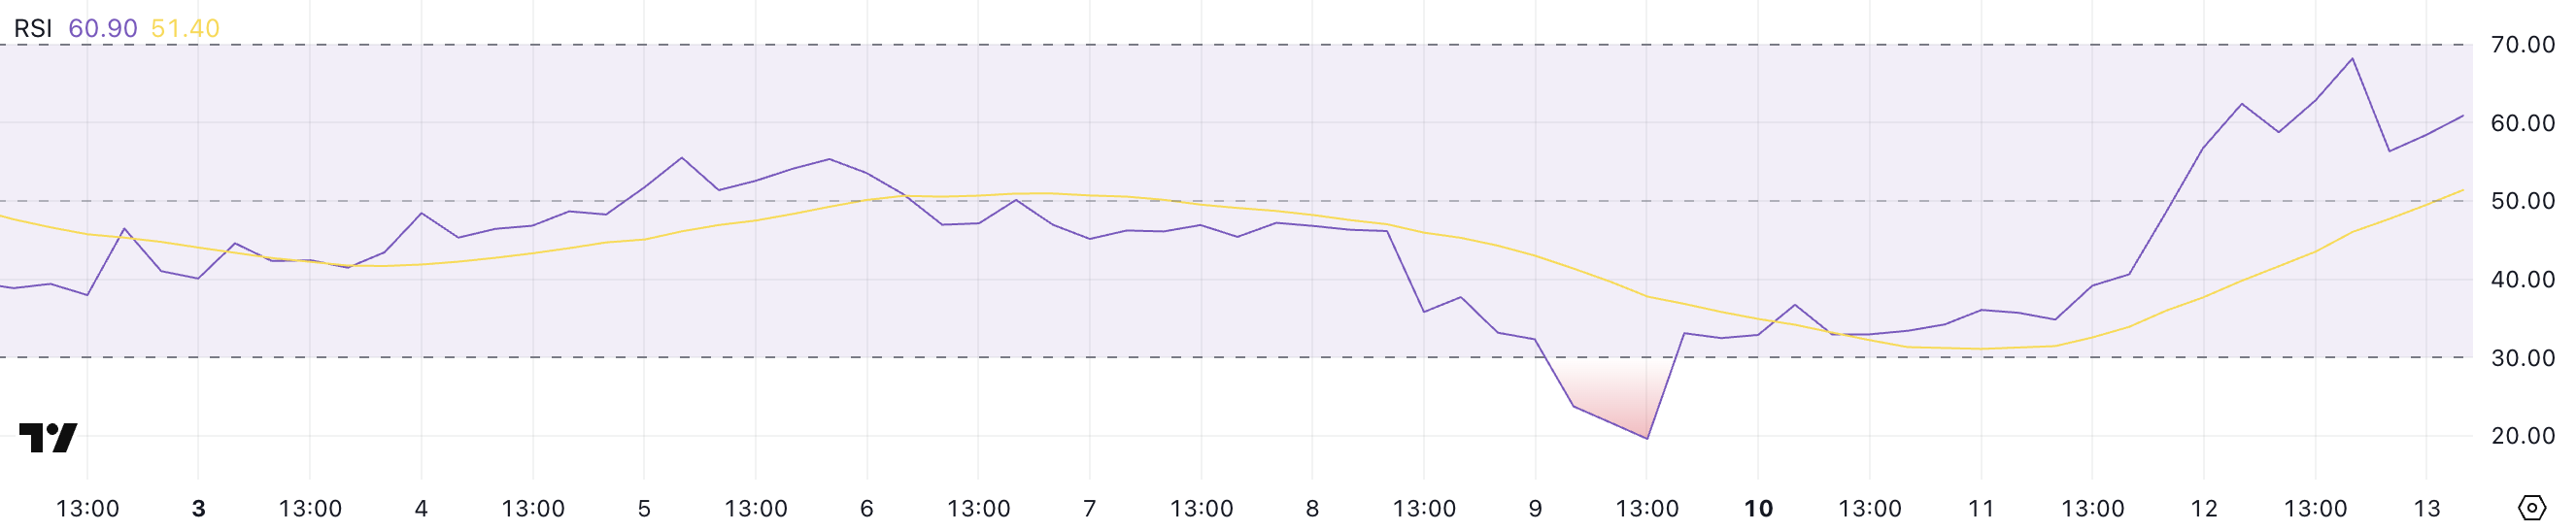 PI RSI. Source: TradingView.
With PI’s RSI touching 68 earlier and now sitting at 60.90, it is approaching overbought territory but has not yet crossed the critical 70 threshold.
The fact that PI hasn’t surpassed 70 since February 27 suggests that this level has historically acted as a barrier, potentially triggering profit-taking or a temporary slowdown.
If RSI stabilizes near its current level, PI could consolidate before making another push higher. However, if it surges past 70, it would signal extreme bullish momentum, though that also increases the likelihood of a short-term correction.
PI Can Reclaim $2.35 Levels Soon
PI price is currently trading within a key range, facing resistance at $1.82 while holding support at $1.57. If the current uptrend persists and buyers manage to push past $1.82, the next target would be $1.98.
A break above this level could open the door for a stronger rally, especially if PI regains the positive momentum seen last month. In that scenario, the price could extend its climb toward $2.35, reinforcing a more bullish outlook.
However, clearing these levels would require sustained buying pressure and a breakout confirmation above $1.82.
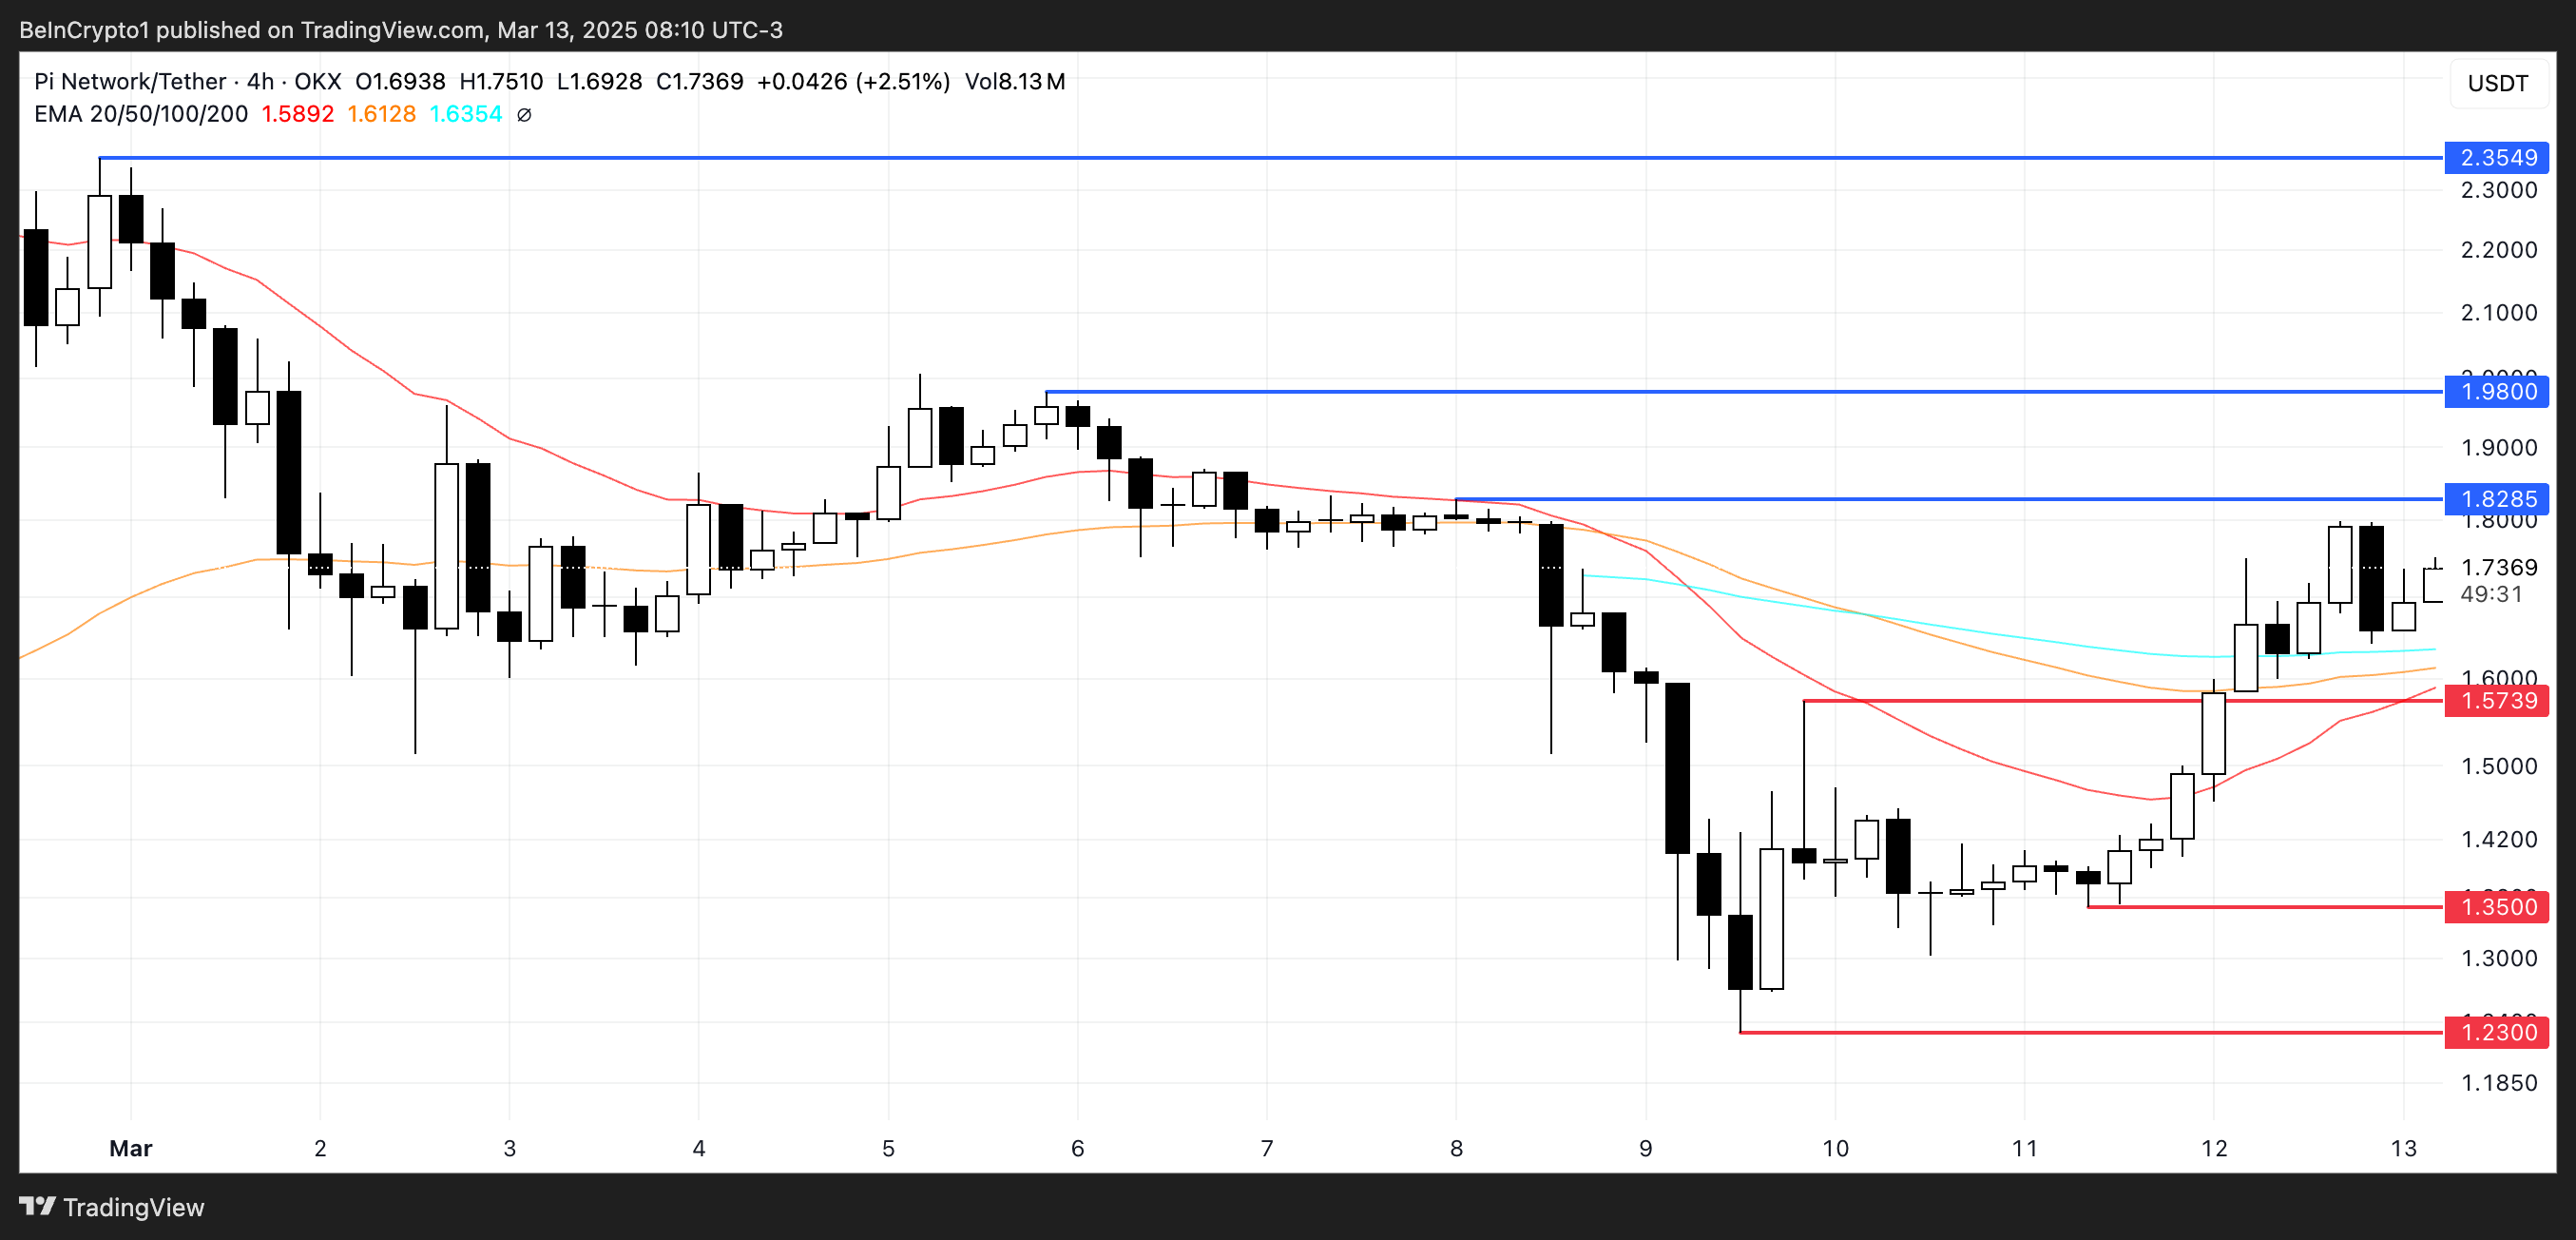 PI Price Analysis. Source: TradingView.
On the downside, if PI’s trend reverses, it could retest its immediate support at $1.57.
Losing this level would weaken the bullish structure and expose the price to further declines, potentially testing $1.35. If selling pressure intensifies, PI could drop even further to $1.23, marking a deeper correction.
The strength of the support at $1.57 will be crucial in determining whether the current uptrend holds or if PI enters a more extended pullback phase.
0
0


 Manage all your crypto, NFT and DeFi from one place
Securely connect the portfolio you’re using to start.

0
0


0
0