Solana’s 17% Rally Faces the $176 Wall: Breakout or Another Range Trap?
0
0

According to TradingView, the Solana price has gone up by 17% from its previous support level near $143. Now, it is facing an important resistance level around $176.
This has caught the attention of many traders and experts, who believe that this point might decide whether Solana keeps on rising or starts to move sideways again.
The recent price move is looking strong and clear, but it is still uncertain whether Solana can break through this tough resistance zone.
Analysts remain optimistic on Solana for June 2025, citing its strong rebound from the $143–$152 zone and a breakout above key EMAs.
Record wallet growth, now over 11.6 million, and rising DeFi and Web3 activity support the bullish outlook. As long as SOL holds above key averages, targets between $180–$195 remain in play.
Solana Gains Momentum from Key Technical Level
The recent rise in Solana price started after it bounced from a key level that many technical analysts were watching closely. The $143 level was important because it matched the Fibonacci retracement level as well as weekly support.

As expected, Solana price reacted strongly from this zone and gained 17%, showing a clear and sharp recovery. Many traders on Reddit and X pointed out how perfectly Solana reacted at that key level.
One trader called it “a textbook reaction,” and another said that Solana ” does not usually bounce this cleanly”. These comments show that some investors trust Solana’s price movements and believe in its technical strength.
This type of strong and well-timed bounce usually suggests that big investors or high volume traders are buying at important price levels, which adds to the growing bullish Sentiment.
Resistance Zone at $176 Holds the Key
Even after a strong rebound, the Solana price is now facing a big challenge near the $176 level. This is not just any other resistance, but it is a tough zone that is filled with key technical factors that could decide where the prices go next in the short term.
According to analysts, the $176 level is a strong resistance area because several key factors come together here, like past selling zones, previous price pullbacks, and high trading volume.
When all these resistance lines up, the price often either breaks through with force or pulls back sharply to lower, safer levels. Analysts on social media and trading forums have agreed with this outlook.
Some think that if Solana price clearly breaks above $176, then it might lead to another strong move upward. Others warn that this level might reject the price, which would cause it to drop back and continue trading within the same range.
| Metrics | Value | Source |
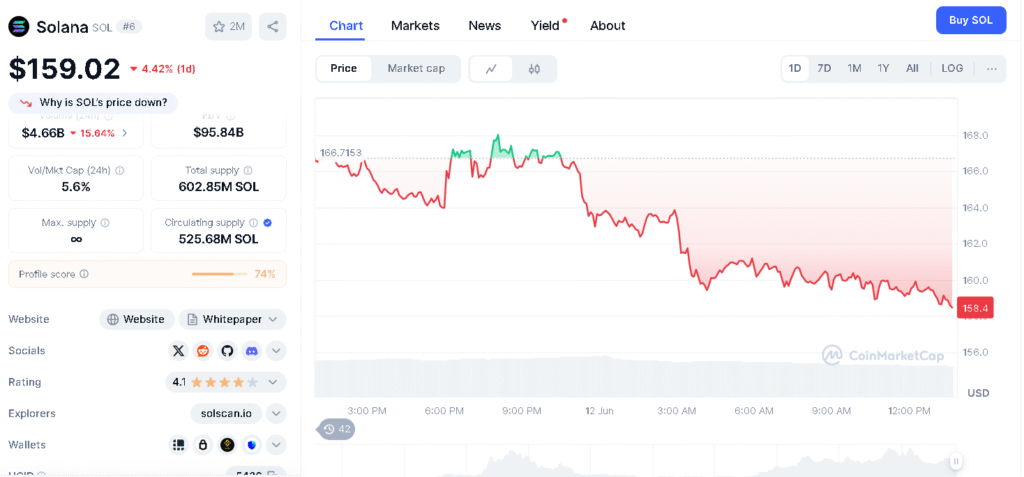
| Current Price | $159.02 | Coinmarketcap |
| Key Resistance Levels | $165, $171-$176 | Crypto News |
| Support Levels | $150–$153 | CoinDCX |
| 24 Hour Trading Volume | $4.66B | Coinmarketcap |
| Bullish Targets 2025 | $188, $200, $210 | CoinDCX |
| All Time High (Jan 2025) | $294.33 | Coinmarketcap |
Mixed Sentiment on Breakout Potential
The market is divided on whether the Solana price can clearly move above $176 right now. Some traders believe that a bigger rally might follow if it breaks this level with strong buying and high volume.
Others are still cautious and unsure if Solana has enough strength to push past this point. One technical trader said a breakout should not be expected unless there is real momentum.
Solana seems strong, but how it reacts now will tell everything. Many agree with this, saying that most of the recent good news might already be reflected in the price, and now Solana needs to prove its strength by staying strong over time.
The lack of clear macro catalysts has added to the uncertainty. There is no big news or major events in the broader market to push the prices higher. Without a strong reason or a market rally to break through this resistance level, a significant buying interest might be needed.
Sideways Movement Possible if Rejection Occurs
Currently, Solana is trading around $159.50. If the Solana price fails to break above the $176 resistance, then analysts believe that it will return to its usual range, which is between $143 and $176.

This would not be a breakdown but will be just a short break in the current trend. It is normal for Solana price to move sideways like this after a strong rise, particularly when facing tough resistance levels.
Some traders believe that even if Solana gets rejected, it could still support the broader bullish case, as long as the price stays above $159 and creates a higher low. That would suggest that buyers are still in control and the overall structure remains strong.
Conclusion
Solana’s 17% rally has brought hope, but it is still unclear whether the price can move above the $176 resistance. This level is closely watched because it could lead to a bigger rise or cause the price to move sideways for a while.
Even though the trend looks strong, there is no big news to push the market, so any breakout will need strong buying support. Still, if Solana price stays above $150, it would suggest that buyers are still in control and the overall trend is still strong.
FAQs
1. What is the key resistance level for the Solana price?
$176
2. What support level did Solana bounce from?
$143
3. What do traders say about the $143 bounce?
It was a textbook reaction.
4. What could happen if Solana breaks above $176?
It could signal a strong upward trend.
5. What adds to the $176 resistance strength?
Past selling zones and high trading volume.
Glossary
Resistance Wall- A price zone where upward momentum often loses steam.
Bounce Zone- A level from which the price sharply recovers, hinting at strong buying.
Fibonacci Marker- A mathematical zone traders track for trend reactions.
Chart-Critical Zone- An area on the chart with dense historical activity.
Price Reversal Point- A spot where upward movement may stall and reverse.
Sources
Read More: Solana’s 17% Rally Faces the $176 Wall: Breakout or Another Range Trap?">Solana’s 17% Rally Faces the $176 Wall: Breakout or Another Range Trap?
0
0
 Manage all your crypto, NFT and DeFi from one place
Securely connect the portfolio you’re using to start.


