
Defi App Price Forecast: Why Is $HOME Price Rising Today?

0
0

Why Is the DEFI App HOME Price Rising Today?
Turns out, the spark wasn't a listing or a giveaway. It was a tokenomics claim. The $HOME posted that 80% of protocol revenue buys back $HOME every week, directly on-chain, since launch. That's recurring demand, not a one-time pump.
That single update reshaped every Defi App crypto price prediction model overnight, since recurring buy pressure changes the math far more than a one-off announcement. It lines up with the broadening wedge structure covered in this HOME price prediction 2026 breakdown, and it already anchors the wider DeFi app price forecast for $HOME.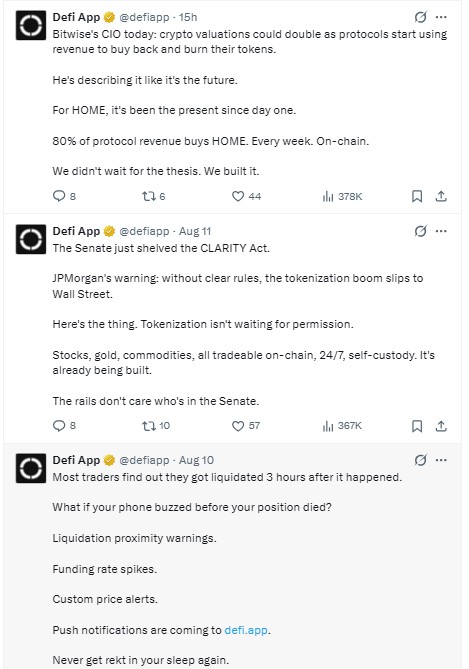
Defi App confirmed the mechanism in its own buyback update on X, and traders picked up the post within minutes. Timing helped too, since the same week the Senate shelved the CLARITY Act, leaving tokenization rules in limbo and pushing capital toward altcoins with a concrete narrative. A simpler force sat underneath both as short sellers got squeezed once the price broke a watched intraday level.
Defi App HOME Price and Market Snapshot
As of August 14, 2026, 09:40 UTC, $HOME price trades near $0.0116, up roughly 13.3% over 24 hours. Market cap sits close to $49.9 million, with a fully diluted value near $115.8 million once all 10 billion tokens circulate. These are the numbers any DeFi app price forecast has to start from.
Volume ran near $75 to $78 million, over double the prior session, pushing the volume-to-market-cap ratio above 150%. That's far more turnover than the token's size would suggest, worth weighing against today's broader HOME price prediction coverage.
HOME's all-time high was $0.07094 in June, and its low was $0.004937 in late July, just two weeks before this rally. Confirm live figures on CoinMarketCap before acting, since prices shift fast.
HOME Technical Analysis: Ascending Triangle in Play
On the 4-hour HOME/USDT chart, price sits inside an ascending triangle, a pattern combining a flat resistance line with a rising support trendline that usually signals accumulation before a breakout. The ceiling near $0.0122 has capped every attempt since early August, while pullbacks keep landing on higher lows.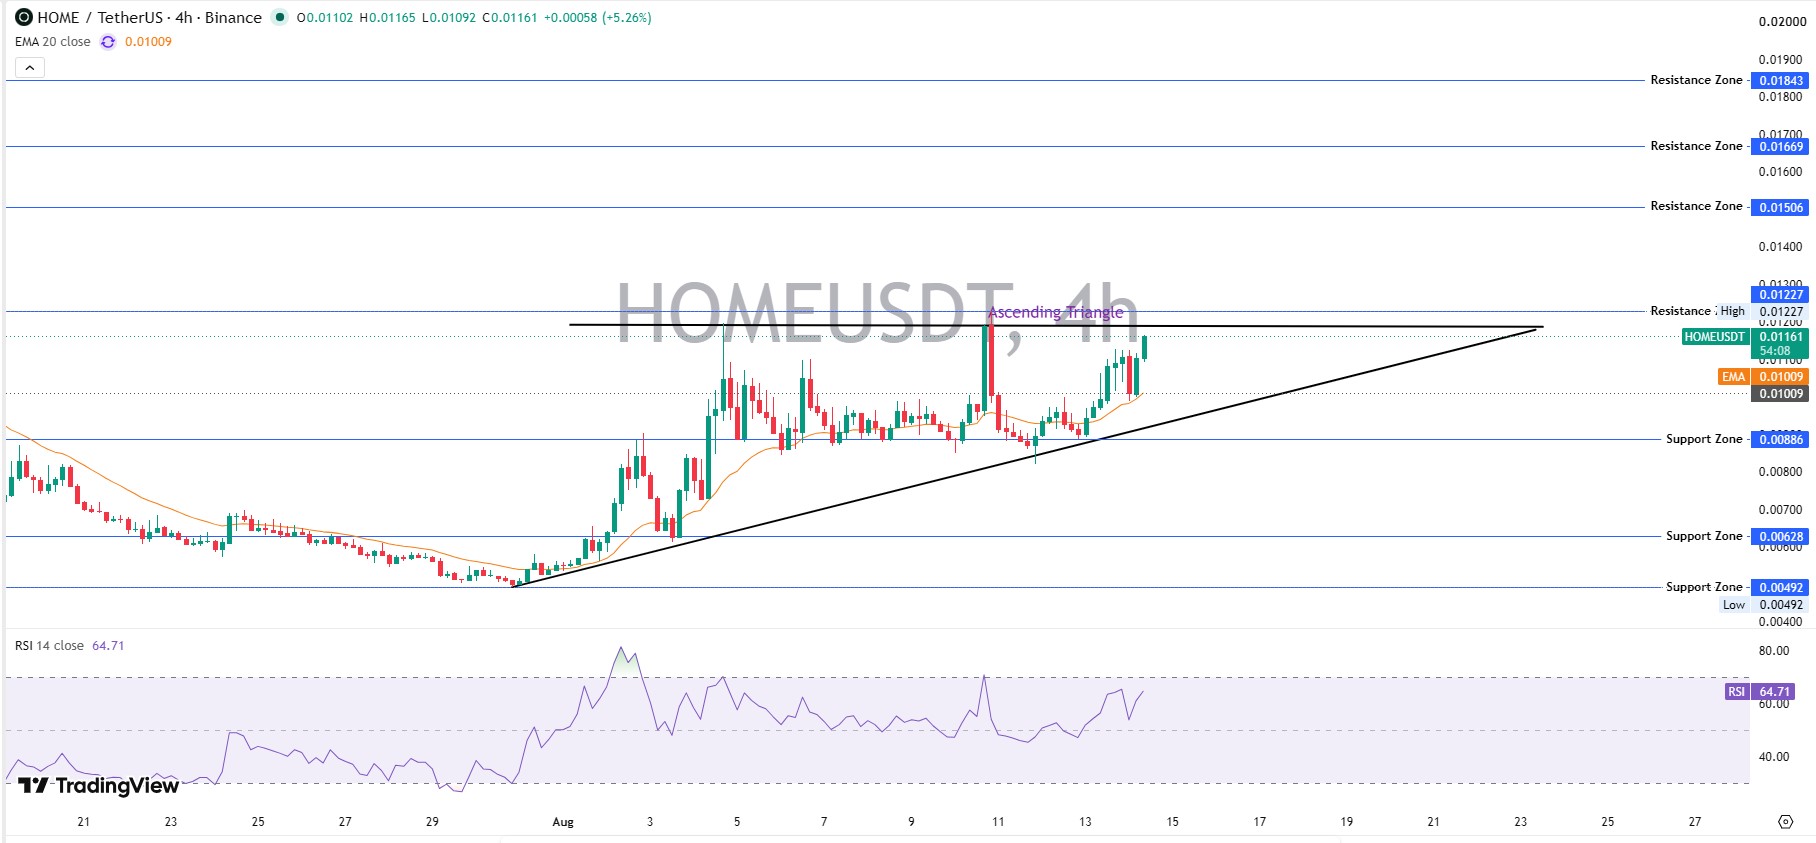
Price trades above its 20-period EMA at $0.01009, a short-term trend filter that favors bulls here. RSI, a momentum gauge running from zero to 100, reads 64.71, firm without tipping into overbought (above 70). This is the setup most short-term $HOME price forecast calls are currently built around.
A close above $0.0123 on strong volume would likely confirm a HOME bullish breakout. Anything less risks another rejection and a tilt back toward a $HOME bearish scenario.
HOME Support and Resistance Levels
Immediate support sits at $0.00886, with deeper zones at $0.00628 and $0.00492. Resistance stacks at $0.01227, $0.01506, $0.01669, and $0.01843. A breakdown below $0.00886 invalidates the bullish structure and pushes most HOME crypto price prediction models toward a defensive stance.
HOME Tokenomics and Whale Concentration
HOME has a total supply of 10 billion tokens, generated at TGE on June 10, 2025. The circulating supply is about 4.3 billion, roughly 43% of the max, with full vesting terms covered in this HOME airdrop and listing timeline.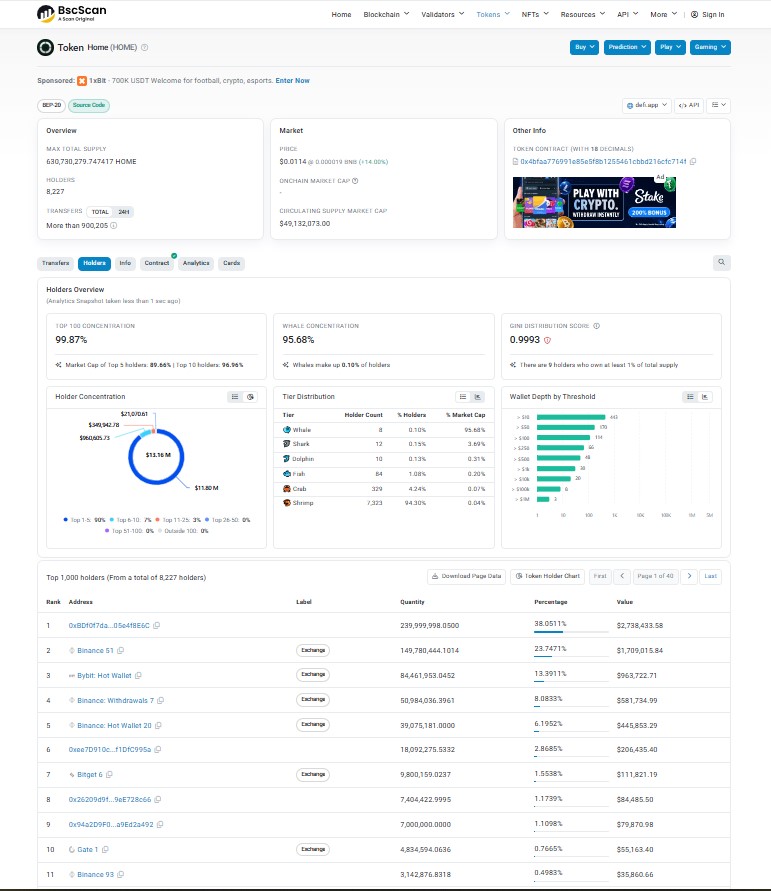
Anyone evaluating the $HOME token purely on price action is missing half the picture, since vesting matters just as much as this week's rally. The full breakdown sits in Defi App's own tokenomics documentation.
On-chain data shows the top 100 wallets hold 99.87% of circulating market cap, and eight whale wallets alone control 95.68% of that. The single largest holder owns 38.05%, unlinked to any known exchange. Exchange wallets make up much of the rest, traceable on BscScan's holder page.
Altcoin Market Context for $HOME
HOME isn't moving alone. Altcoins as a group have been catching bids even while sentiment gauges flash "fear," and the Altcoin Season Index reportedly rose 44% this week as capital rotated out of majors into smaller-cap names. That rotation cuts both ways, since Bitcoin's own trend still shapes the risk appetite feeding into tokens like $HOME crypto.
Defi App Price Forecast 2026: Bull, Base and Bear Case for HOME
Timeframe | Bear Case | Base Case | Bull Case | Probability | Invalidation |
7 Days | $0.0075 | $0.0100 - $0.0120 | $0.0150 | Bear 25% / Base 45% / Bull 30% | Daily close below $0.00886 |
30 Days | $0.0060 | $0.0095 - $0.0140 | $0.0190 | Bear 30% / Base 40% / Bull 30% | Weekly close below EMA20 ($0.01009) |
Early Next Year | $0.0045 | $0.0130 - $0.0250 | $0.0350 | Bear 30% / Base 40% / Bull 30% | Loss of support structure below $0.0045 |
This $HOME price forecast assumes buyback demand keeps flowing while the triangle resolves upward without a confirmed breakout yet. The bull case needs a volume-backed close above $0.0123, and the bear case triggers if $0.00886 fails and short interest returns, a risk that grows if the upcoming Fed rate decision rattles risk assets broadly.
Most HOME price prediction 2026 models hinge on two variables, buyback consistency and whale behavior. A DeFi app price prediction for 2026 that ignores either tends to overstate the bull case, and broader HOME crypto forecast 2026 estimates from other trackers land near the base case above.
Zooming out, a HOME long-term price prediction depends more on whether the weekly buyback holds up than on any single chart pattern. For a wider lens on similar demand cycles, this Ethereum price prediction offers a useful contrast on buyback and burn mechanics. A $HOME long-term forecast that ignores whale concentration and vesting unlocks is incomplete, and talk of a 2027 window remains speculative for now.
Key Risks to Watch
Whale concentration remains the biggest structural risk. A wallet holding 38% of the supply can move the price sharply if it sells, overriding any bullish $HOME price prediction.
Liquidation data adds another layer. 24-hour liquidations hit $585.70K, split between $248.94K in longs and $336.76K in shorts, according to CoinGlass, a sign volatility isn't finished. Thin order books on smaller venues can exaggerate moves too, so check exchange listing activity before sizing any position around this rally.
Conclusion
The $HOME price rallied on a real catalyst, not just chatter, and the chart backs it up for now. But whale concentration and an unresolved triangle mean this isn't settled yet, and any DeFi app price forecast should weigh both sides. Watch $0.00886 on the downside and $0.0123 on the upside; everything else is noise until one breaks.
Disclaimer: This article is for informational purposes only and does not constitute financial, investment, or trading advice. Cryptocurrency markets are highly volatile, and prices can change significantly within minutes. Always do your own research and consult a licensed financial advisor before making investment decisions. Data referenced here was captured on August 14, 2026, near 09:40 UTC, and may no longer be current at the time of reading.
0
0


 Manage all your crypto, NFT and DeFi from one place
Securely connect the portfolio you’re using to start.


