
Bitcoin Price Prediction: BTC Rejected Near $81K as Fed Odds Rise

0
0

Bitcoin is trading close to $78,916 today, down about 2% over the last 24 hours. The Bitcoin price prediction outlook has turned mixed after BTC was rejected near the $81,300 level this week, even as spot ETFs keep pulling in fresh cash.
Traders are now watching two things at once. One is a shaky daily chart pattern. The other is a jump in bets that the Federal Reserve could raise rates in September, which is an unusual signal during a rally.
What is Bitcoin's price today?
Bitcoin (BTC) is priced at $78,916.1, down $1,643.41, or 2.04%, on the day. Bitcoin's market cap sits near $1.58 trillion, with a circulating supply of 20.07 million coins out of a 21 million max supply.
Futures volume over 24 hours reached $76.58 billion, while spot volume came in lower at $5.81 billion. Open interest across futures stands at $55.60 billion.
Metric | Value | 24h Change |
Volume | $76.59B | -31.10% |
Open Interest | $55.61B | -5.01% |
Options Volume | $5.51B | -36.74% |
Options Open Interest | $42.70B | +3.19% |
Long/Short Ratio (24h) | 0.9354 | — |
Exchange data shows traders leaning long across the board. Binance's BTC/USDT long/short account ratio sits at 1.0121, OKX shows 1.09, and Binance's top trader account ratio reads 1.0551.
Among top trader positions specifically, the ratio jumps to 2.1463, meaning large accounts are holding far more long exposure than short.
Why did Bitcoin get rejected at $81,300?
Bitcoin ran into a daily bearish order block sitting between $80,000 and $83,000. After tapping $81.3K, price turned lower and closed the daily candle as an inverted hammer.
An inverted hammer near resistance often warns that buyers are losing steam. If BTC cannot close above $83,000 on a higher timeframe, chart watchers say the $80K to $83K zone stays a strong wall of resistance.
Under that bearish reading, the next area of interest sits much lower, around $55,000 to $50,000, where liquidity may be sitting unclaimed below current price. A confirmed daily or weekly close above $83,000 would flip this outlook and cancel the downside setup.
Are liquidations rising for Bitcoin traders?
Yes. Over the past 24 hours, $134.36 million in Bitcoin positions were liquidated. Long traders took the bigger hit, losing $115.38 million, compared to $18.98 million on the short side.
In just the last 12 hours, rekt totals reached $53.80 million, with longs again losing more at $47.66 million against $6.14 million for shorts.
The pain shows up on shorter timeframes too. In the past 4 hours alone, $1.92 million was liquidated, split between $1.07 million in longs and $851.10K in shorts. Even over the last hour, $282.23K was wiped out, with $179.00K coming from longs and $103.23K from shorts.
Timeframe | Total Liquidated | Longs | Shorts |
1h | $282.23K | $179.00K | $103.23K |
4h | $1.92M | $1.07M | $851.10K |
12h | $53.80M | $47.66M | $6.14M |
24h | $134.36M | $115.38M | $18.98M |
This pattern shows traders keep betting on higher prices even while Bitcoin slips, which can add fuel to further downside if stop losses get triggered.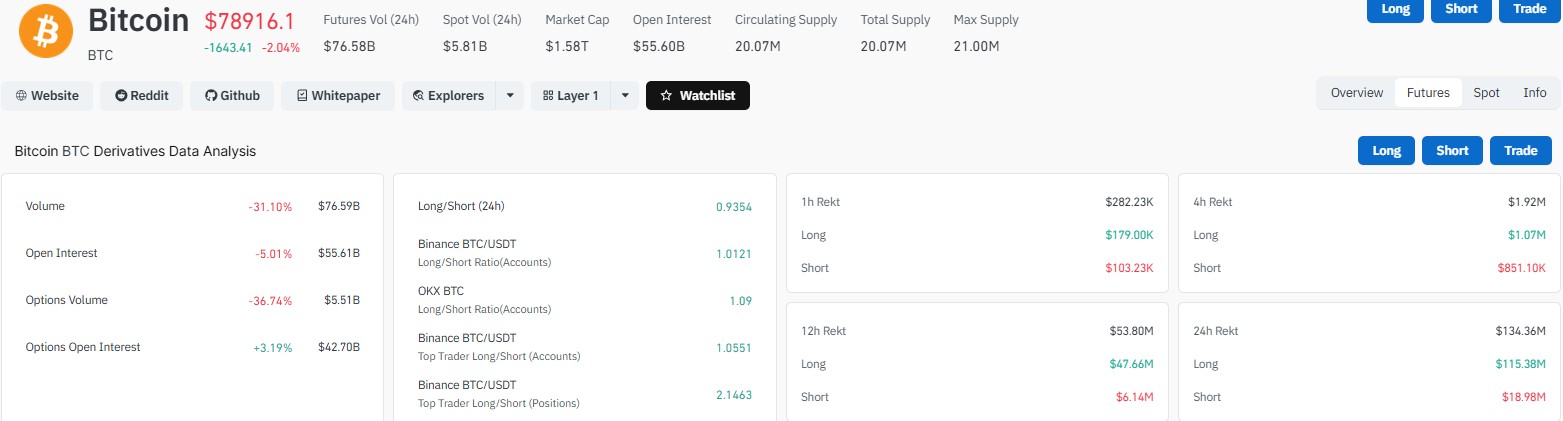
What does Bitcoin's chart pattern show right now?
A widely shared daily chart maps out a clear sequence since the recent high: High, then Lower High, then Lower Low, repeating three times in a row. Each bounce failed to reclaim the prior peak, and each pullback dug a fresh low.
This step-down structure looks like a falling wedge, a pattern where price coils tighter with each swing. On the chart, that sequence of lower highs and lower lows is followed by a sharp projected move higher, breaking clean above the wedge and the earlier highs.
Patterns like this do not guarantee an outcome, but traders who follow this setup are watching for one more lower low to complete the wedge before any real trend change can be confirmed. Until then, the lower high, lower low rhythm remains intact.
Is the Fed rate hike odds jump a warning sign?
A widely shared post this week pointed out that Kalshi odds for a 25 basis point Fed rate hike in September climbed to 34%, right as Bitcoin was pumping last week. Historically, rate hike bets and risk asset rallies do not move together, so the divergence has traders asking questions.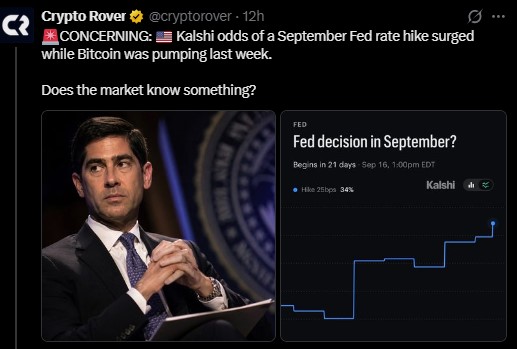
Today's US PCE inflation print adds more weight to that debate. The previous reading was 3.7%, and the forecast calls for 3.6%. A print above 3.6% would likely push markets into a risk-off mood, while a cooler number below 3.6% could support risk-on trades, including Bitcoin. This is also the last inflation data before Fed official Kevin Warsh speaks at Jackson Hole on Friday.
What is driving Bitcoin's bullish case right now?
On the other side of the debate, some point to the US Treasury. On August 19, the Treasury doubled its long-term bond buybacks in an effort to keep yields from climbing further. Bitcoin has gained roughly 26% since that move.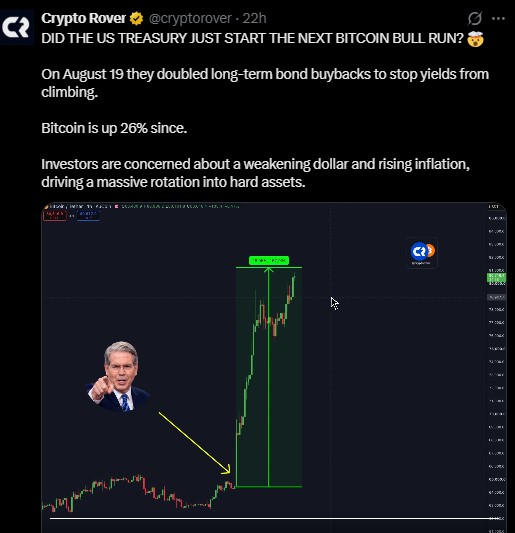
The argument here is that a weaker dollar and sticky inflation are pushing some investors toward hard assets like Bitcoin as a hedge. Spot BTC ETFs added $314 million in net inflows on August 25 alone, according to SoSoValue, marking seven straight days of net inflows into the funds.
Michael Saylor also added to the bullish narrative this week. At Strategy's Q2 2026 investor call on August 17, he said the company wants to become the JPMorgan of digital assets, built on top of its Bitcoin holdings, which he says represent 4% of global BTC supply.
Saylor said fixing the firm's digital credit product, STRC, is now the single most important task, since it could expand equity value tied to MSTR.
BTC price prediction: what happens next?
Right now, Bitcoin sits in a tug of war. Chart structure shows a series of lower highs and lower lows since the recent top, a pattern some traders read as bearish continuation toward $50,000 to $55,000.
At the same time, ETF demand, Treasury bond buybacks, and inflation worries are giving bulls a reason to expect a bigger move higher over time, even if the short-term path stays choppy.
The $83,000 level is the line in the sand. A clean break and close above it would challenge the bearish case, while continued rejection keeps the lower target zone in play.
Given the size of today's liquidations and the split reaction to Fed odds, near-term Bitcoin price action is likely to stay volatile heading into Friday's Jackson Hole comments.
Disclaimer
This article is for informational purposes only and does not constitute financial, investment, or trading advice. Cryptocurrency markets are highly volatile, and past performance does not guarantee future results. Always do your own research and consult a licensed financial advisor before making investment decisions.
0
0


 Manage all your crypto, NFT and DeFi from one place
Securely connect the portfolio you’re using to start.


