Bitcoin Demand Returns As Gold Faces Safe-Haven Test — Why $70,000 Is Critical Now

0
0

Bitcoin is holding its ground in a market where almost nothing else is. Over the past seven days, BTC has gained roughly 3.5%. Yet, gold, the traditional refuge during geopolitical stress, is trading nearly flat on the week at -0.05%. This divergence is unfolding despite a rising US Dollar Index (DXY) and Brent crude climbing, both of which typically weigh on risk assets.
On-chain data shows that US buying demand is returning through Coinbase. Plus, a bullish RSI divergence remains intact, and mid-to-long-term holders are accumulating aggressively. The question now is whether this momentum can push BTC past the $70,000 barrier. It is the level that has rejected every recent rally attempt.
Coinbase Premium Turns Positive, And RSI Divergence Keeps Rebound Alive
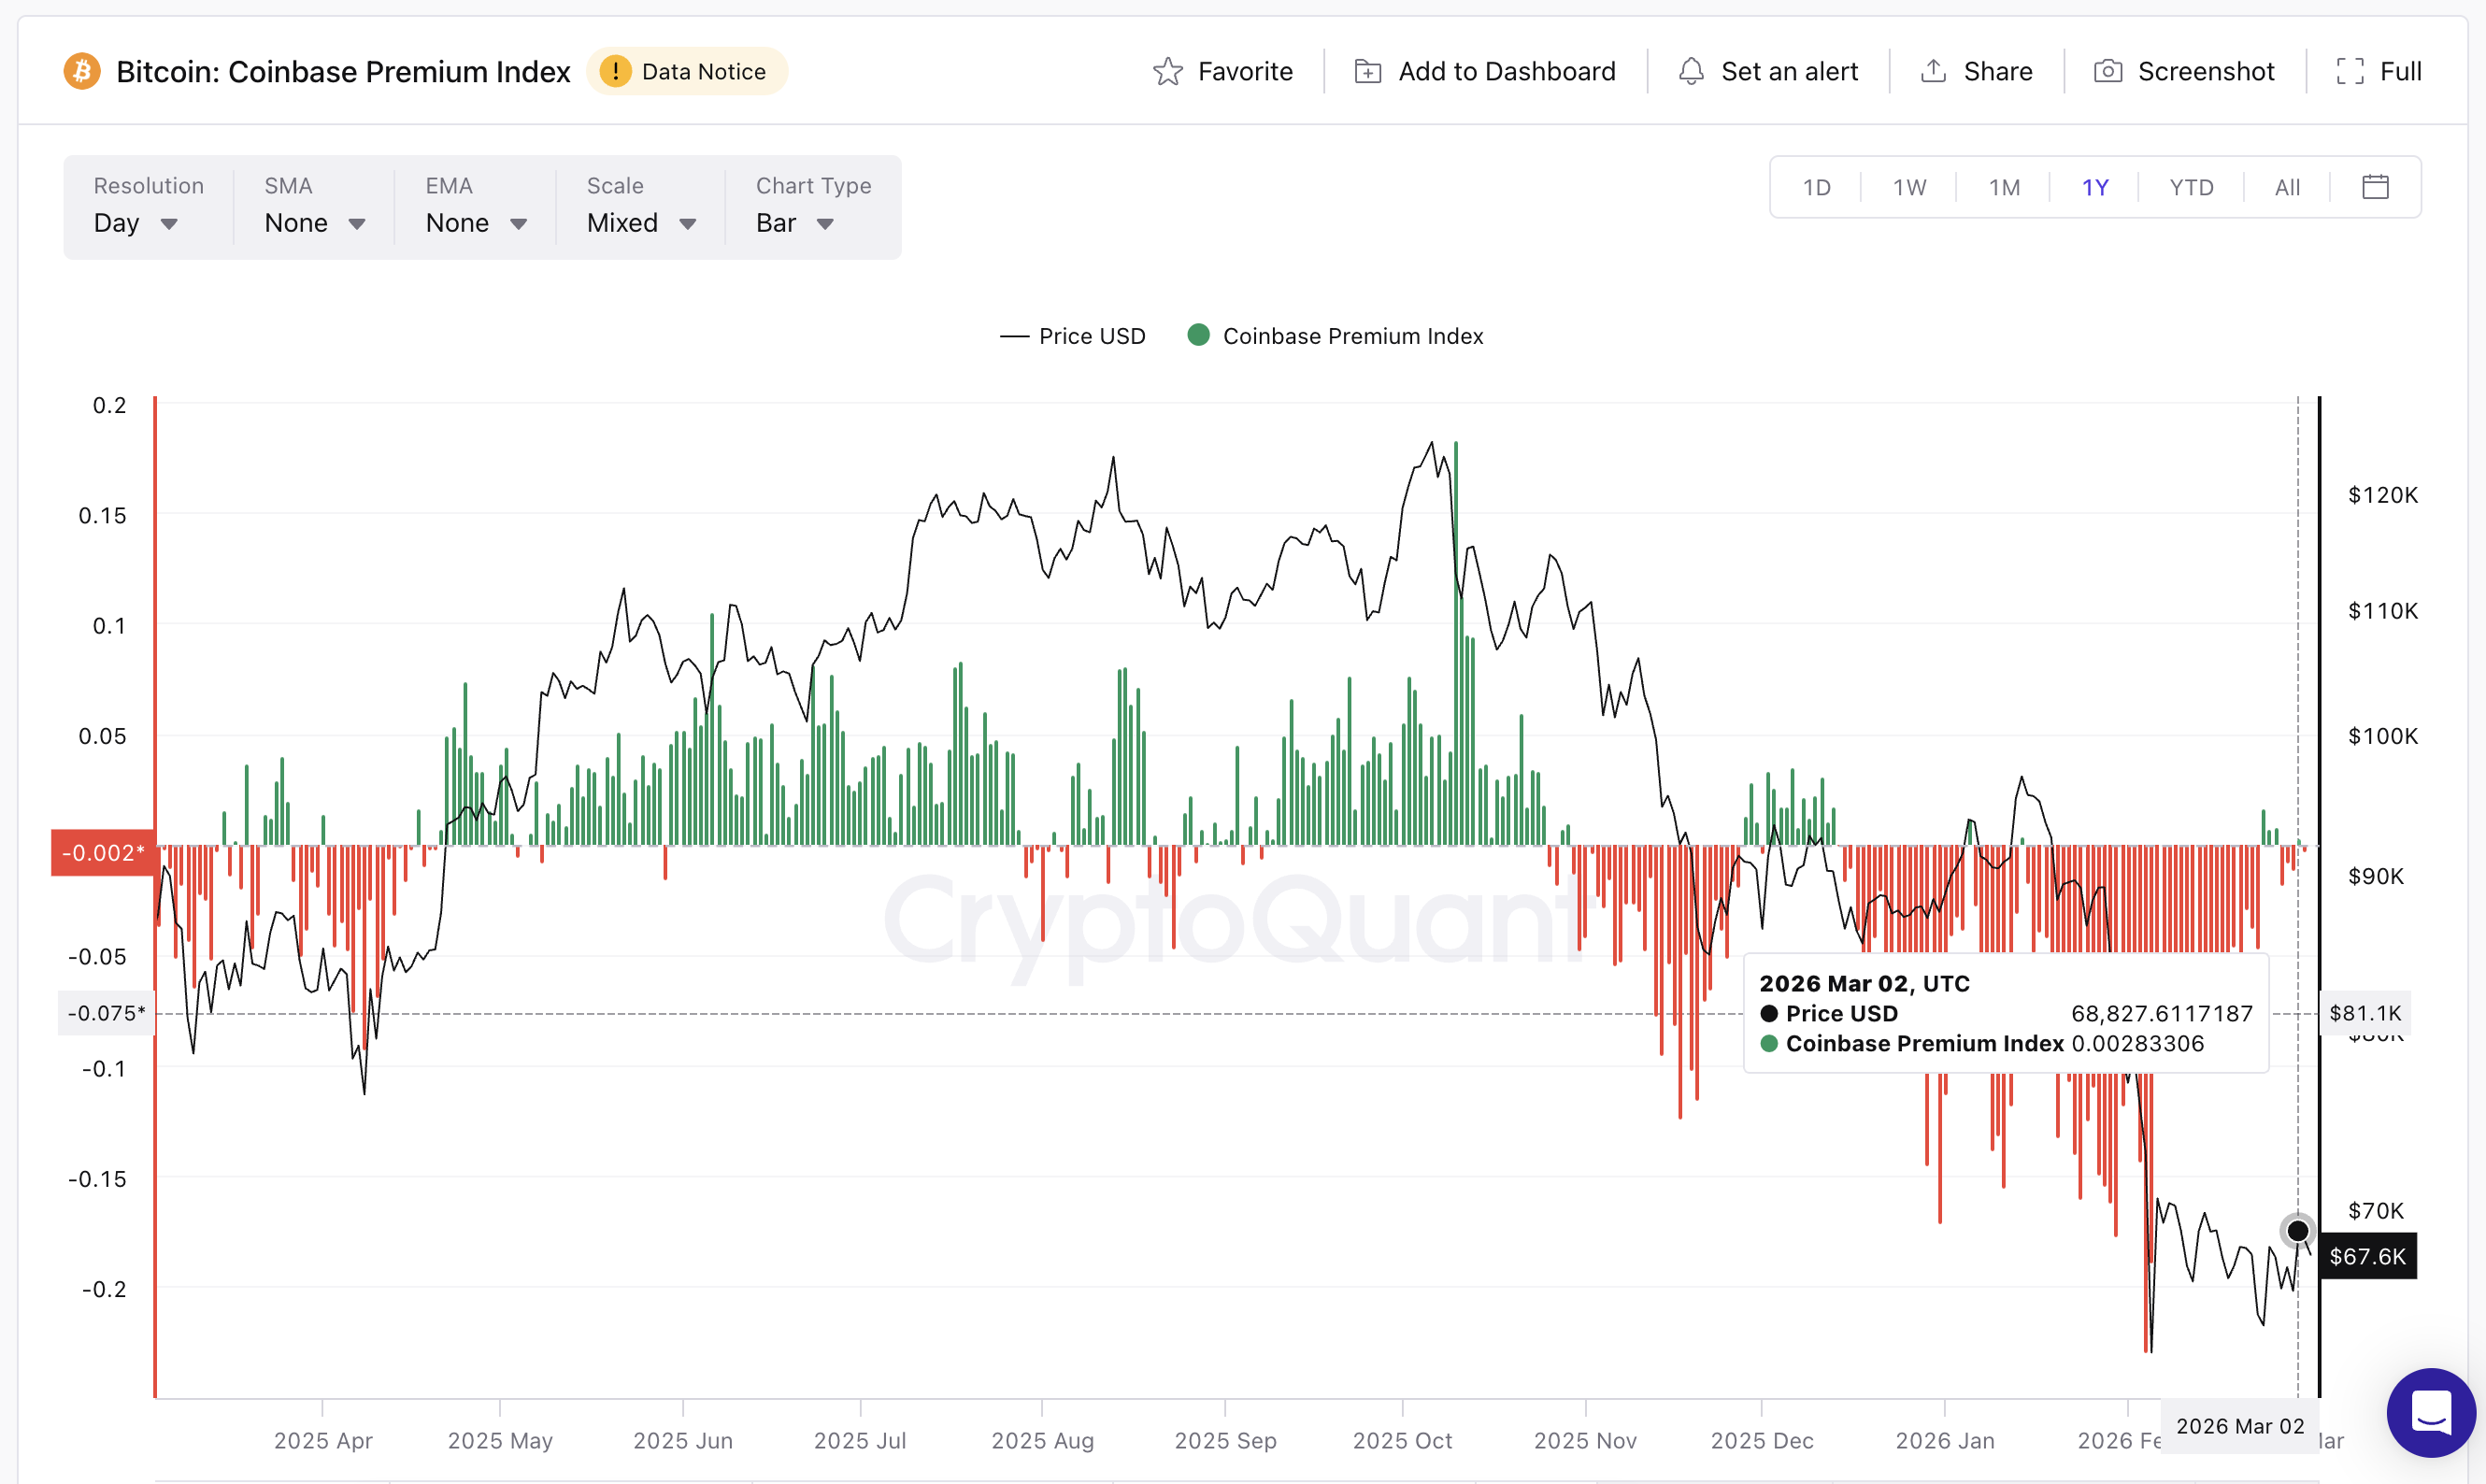
The Coinbase Premium Index, which tracks the price difference between Bitcoin on Coinbase and offshore exchanges, turned positive for the first time in March. CryptoQuant data shows the premium registered a reading of +0.00283 on March 2, marking a meaningful shift after a prolonged negative stretch that ran from January 15 through February 23.
 Coinbase Premium Index: CryptoQuant
That negative stretch lasted nearly 40 days, reflecting sustained selling pressure from US-based investors and institutions throughout the correction from above $90,000. The tone began to change in late February. The premium flipped positive on February 24, 25, and 26, then dipped briefly before returning positive again on March 2. That makes four positive days within roughly a week since February 24, following one of the longest negative runs in recent memory.
The timing matters. When the Coinbase premium first flipped positive on February 24, Bitcoin responded with a sharp bounce of nearly 13%, rallying to repeatedly test the $70,000 level. That level has since become a firm resistance, but the demand signal from US buyers remains active.
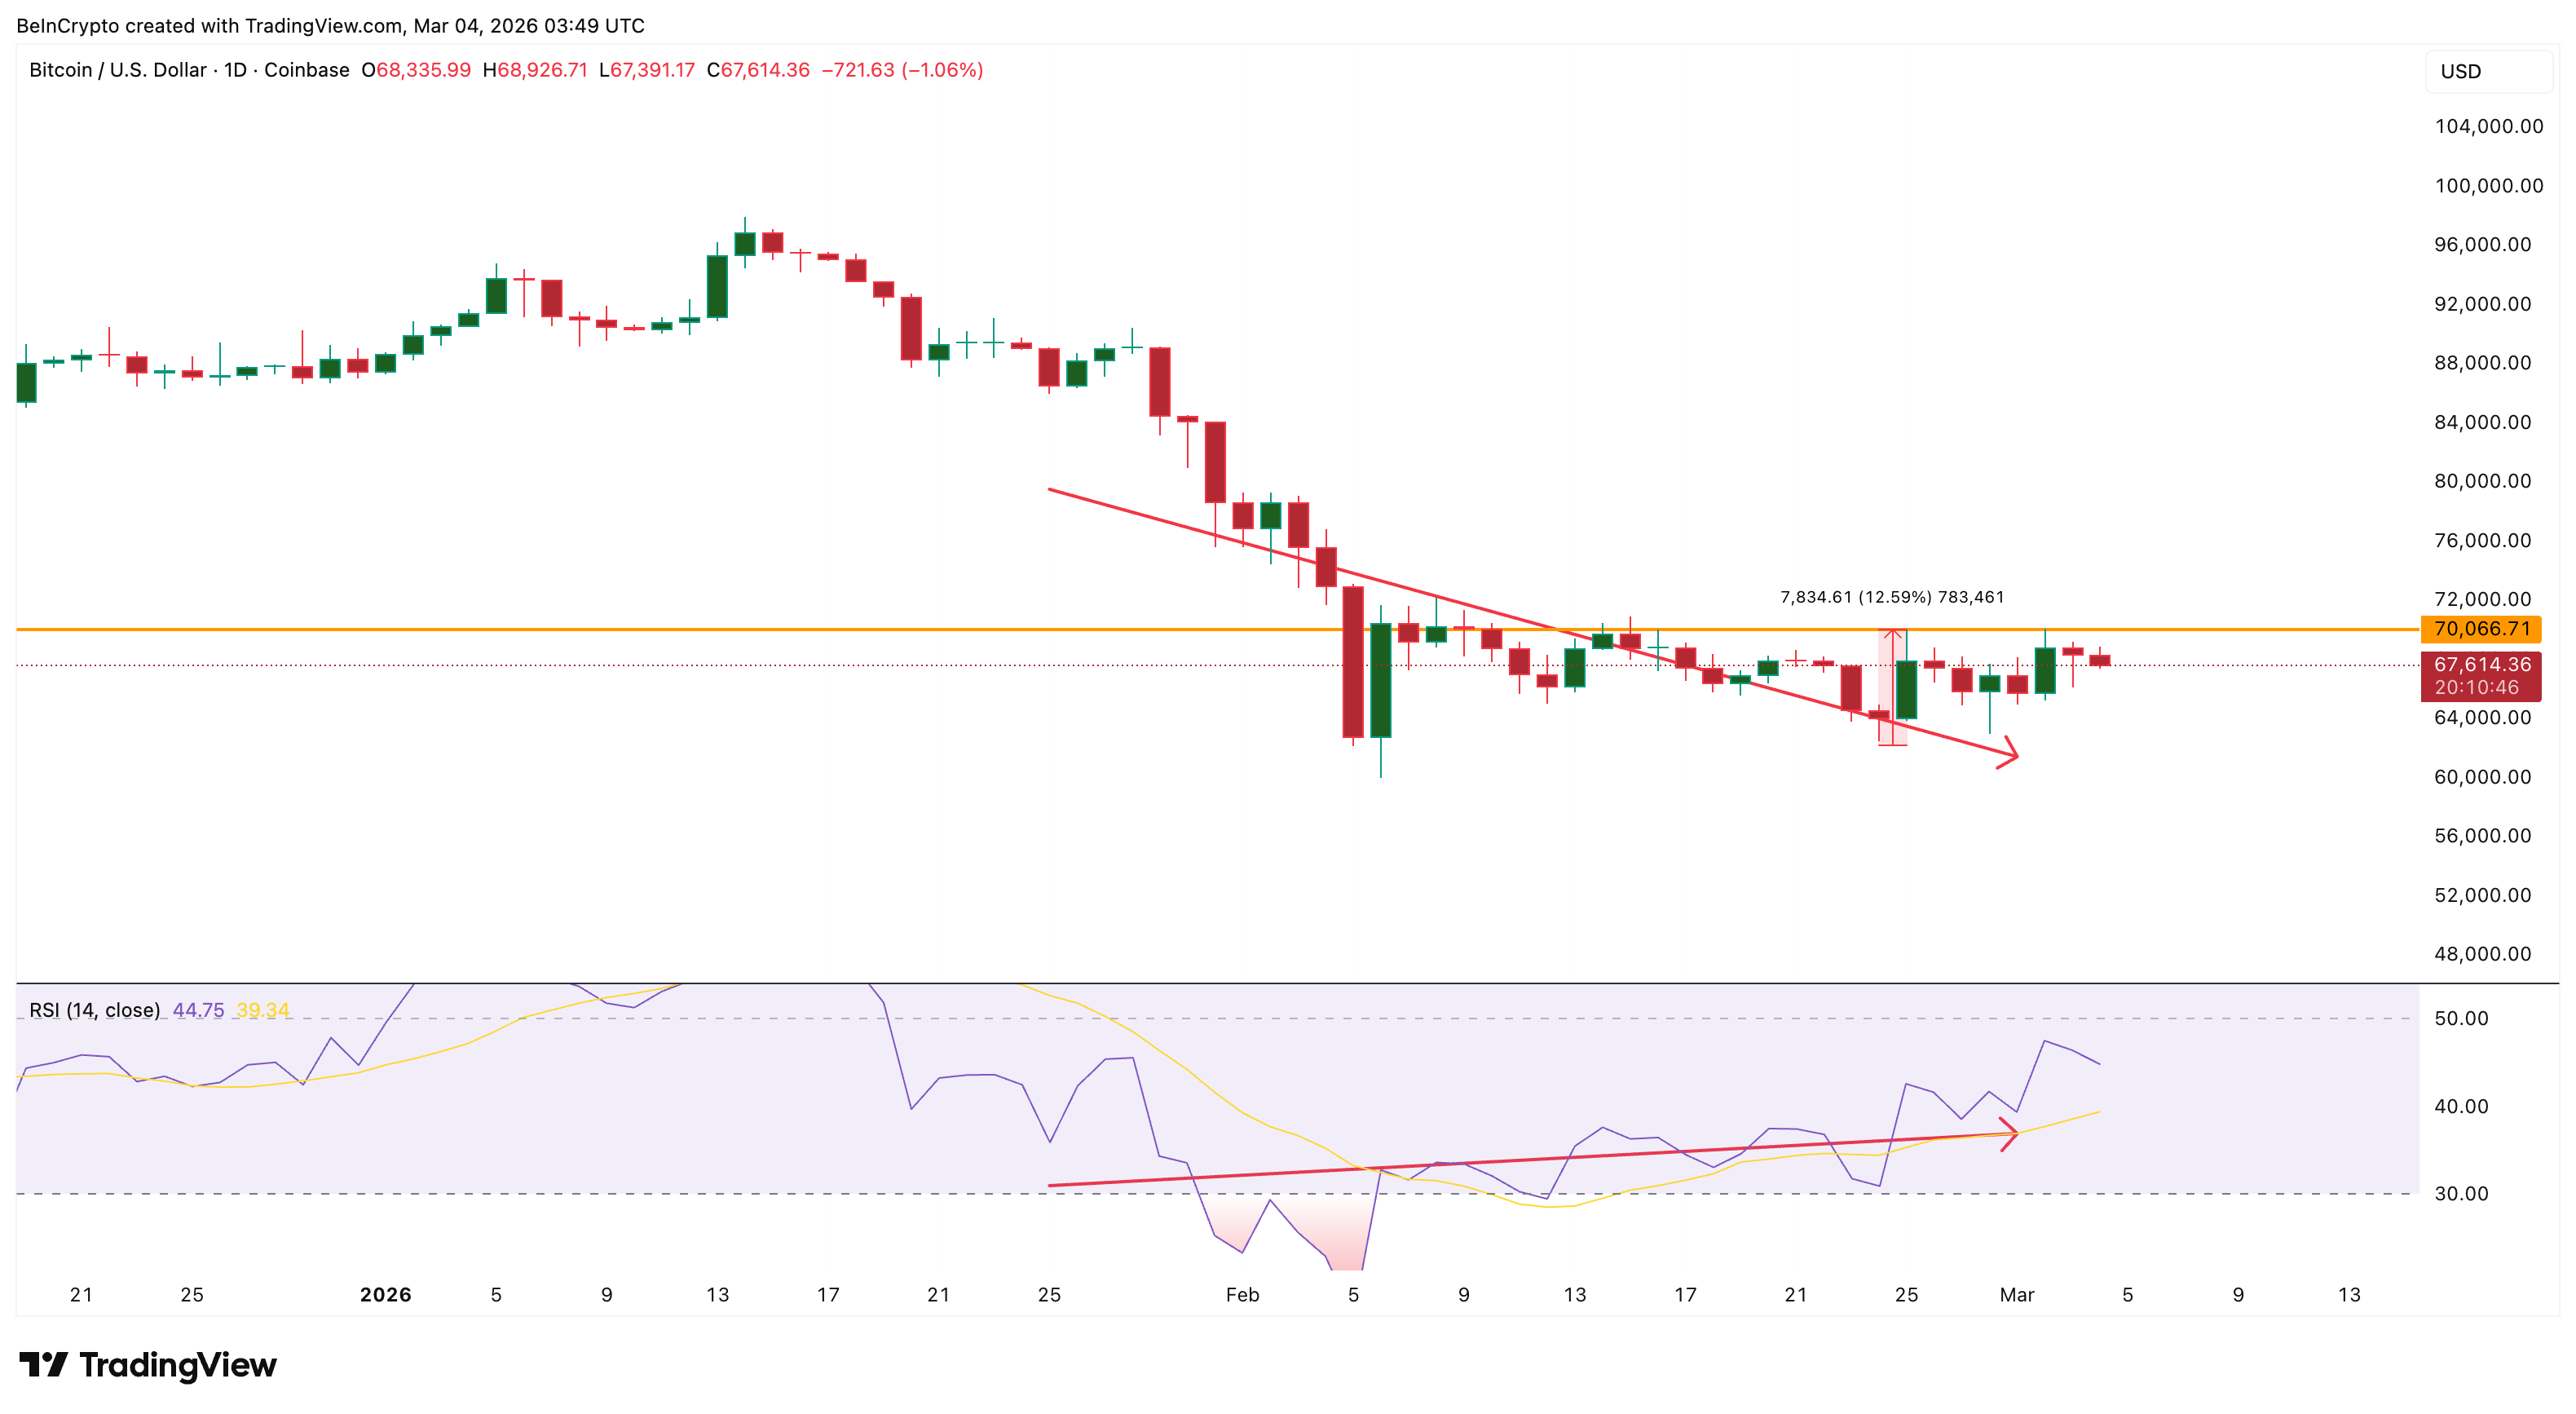
Adding weight to this is a bullish relative strength index (RSI), a momentum indicator, signal on the daily chart. Between January 25 and March 1, Bitcoin’s price printed a lower low while the 14-day RSI formed a higher low — a classic reversal signal or bullish divergence flashing.
Price bounced above $70,000 briefly before correcting, but the structure remains intact. The RSI is still forming a higher low while price maintains a lower low trajectory relative to late January, keeping the rebound setup alive.
 BTC RSI Divergence: TradingView
With both the Coinbase premium and the RSI divergence active simultaneously, the conditions for a sustained recovery attempt are building.
Mid-To-Long-Term Holder Conviction Returns As Accumulation Surges
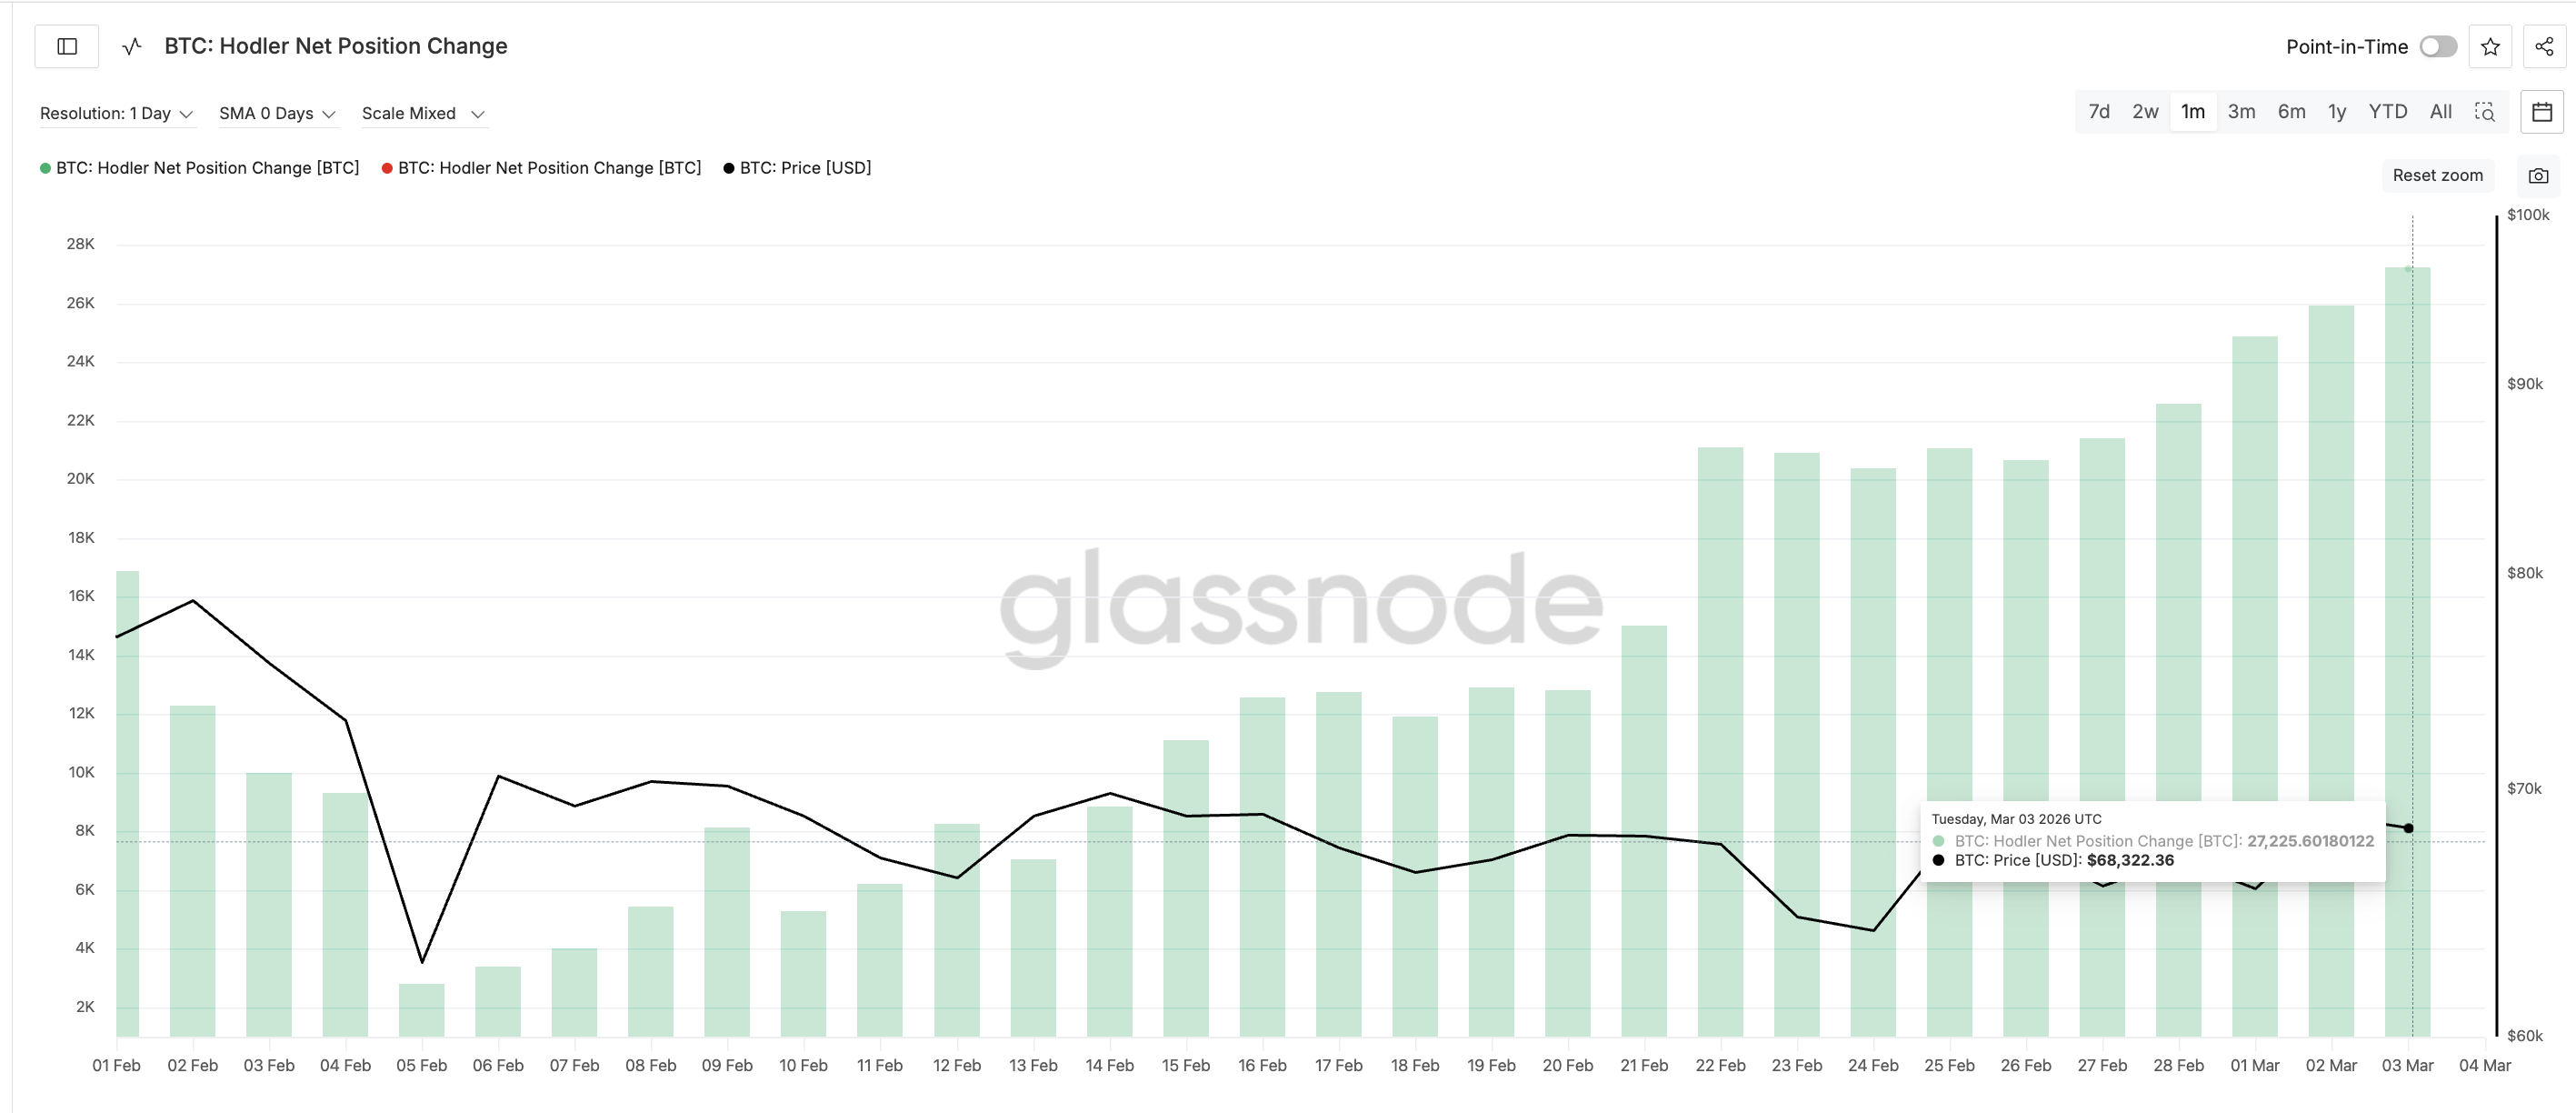
The demand signal is not limited to Coinbase. Glassnode data on Bitcoin’s Hodler Net Position Change, which tracks accumulation by wallets holding BTC for 155 days or more, shows a sharp surge in mid-to-long-term holder activity.
On February 6, when Bitcoin was trading above $70,500, the 155-day+ hodler net position change stood at 3,399 BTC. This indicated modest accumulation. By March 3, with Bitcoin at a slightly lower price of $68,300, that figure had surged to 27,225 BTC — an increase of roughly eight times at a lower price level.
Want more token insights like this? Sign up for Editor Harsh Notariya’s Daily Crypto Newsletter here.
 BTC Hodler Net Position Change: Glassnode
This is significant because it shows that conviction among mid-to-long-term holders is increasing even as short-term price action remains choppy. Wallets holding for 155 days or more are making a deliberate decision to add at current levels, possibly viewing the $67,000–$70,000 range as an accumulation zone rather than a distribution one.
Combined with the Coinbase premium returning, demand is building across two different cohorts: US spot buyers and longer-duration holders, both stepping in during elevated macro uncertainty. This conviction becomes even more striking when compared to how gold, the market’s traditional safe haven, is handling the same environment.
Gold Drops While Bitcoin Holds: Is This The Safe-Haven Rotation
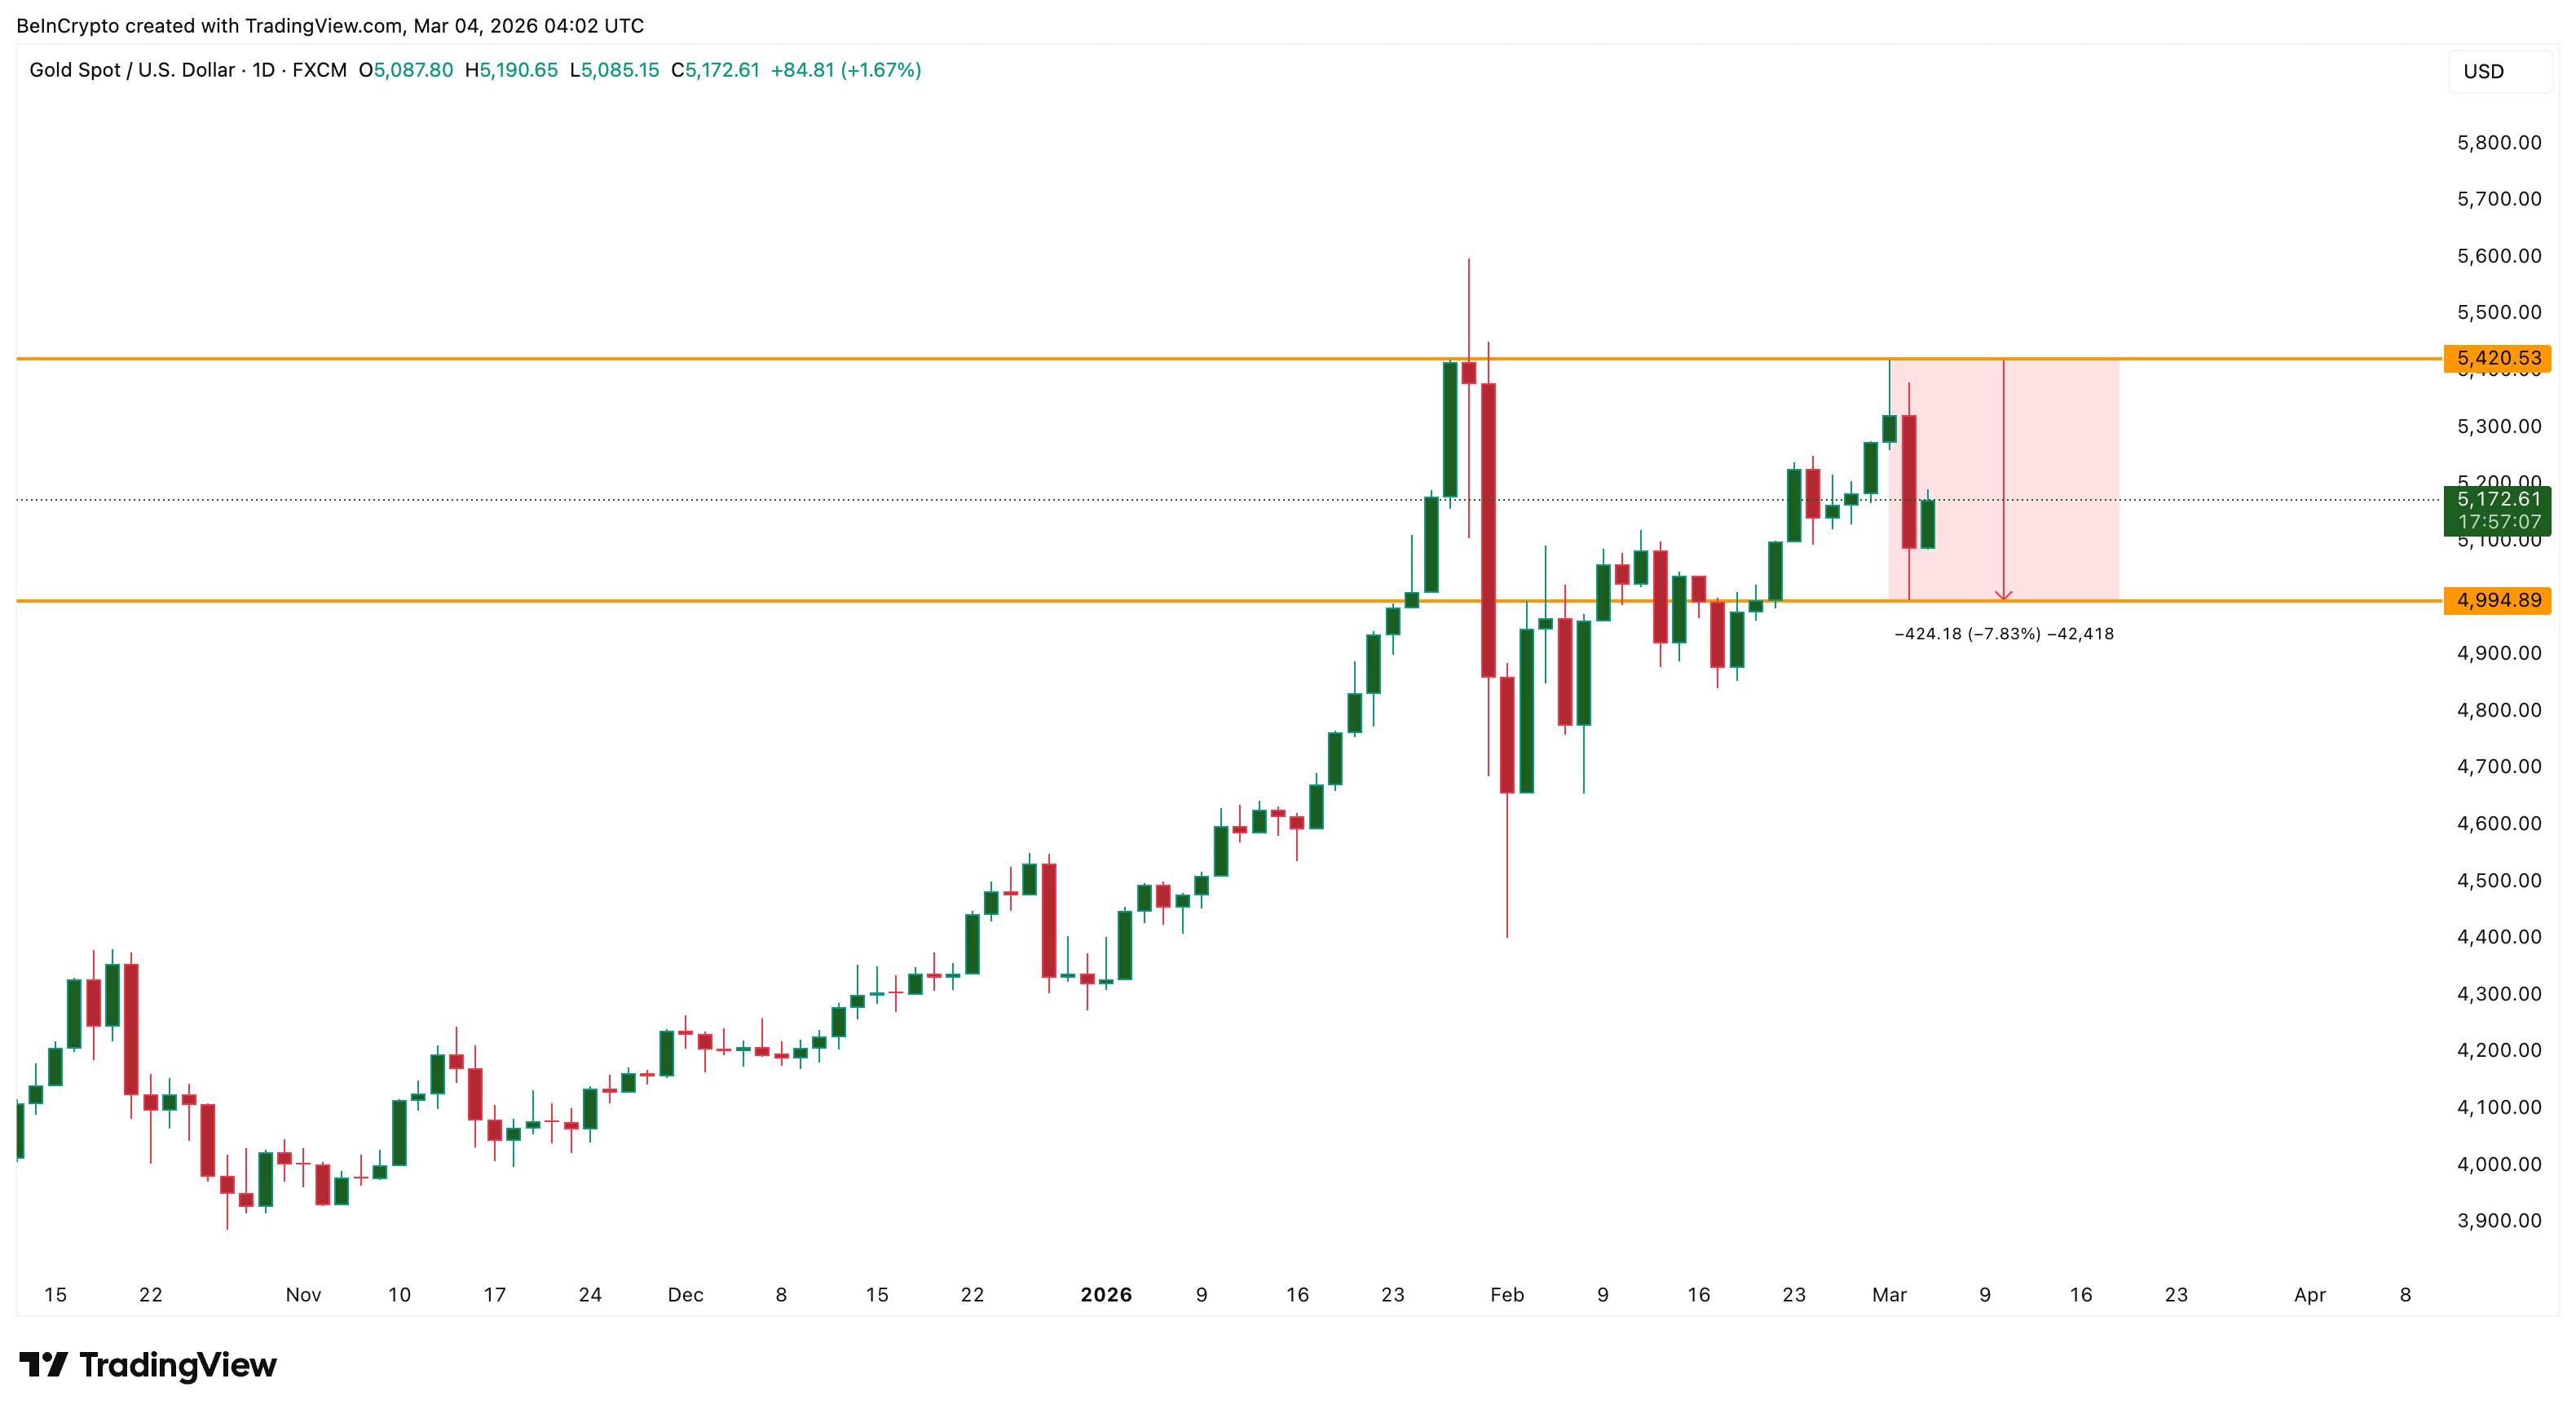
Gold, the asset that has dominated the safe-haven narrative throughout 2025 and into 2026, is faltering precisely when Bitcoin is holding firm.
XAU/USD surged above $5,400 a few sessions back. Since then, it has corrected roughly 8%, briefly dipping below the psychological $5,000 level.
 Gold Spot XAU/USD: TradingView
It currently trades near $5,170, with weekly performance essentially flat at -0.05%.
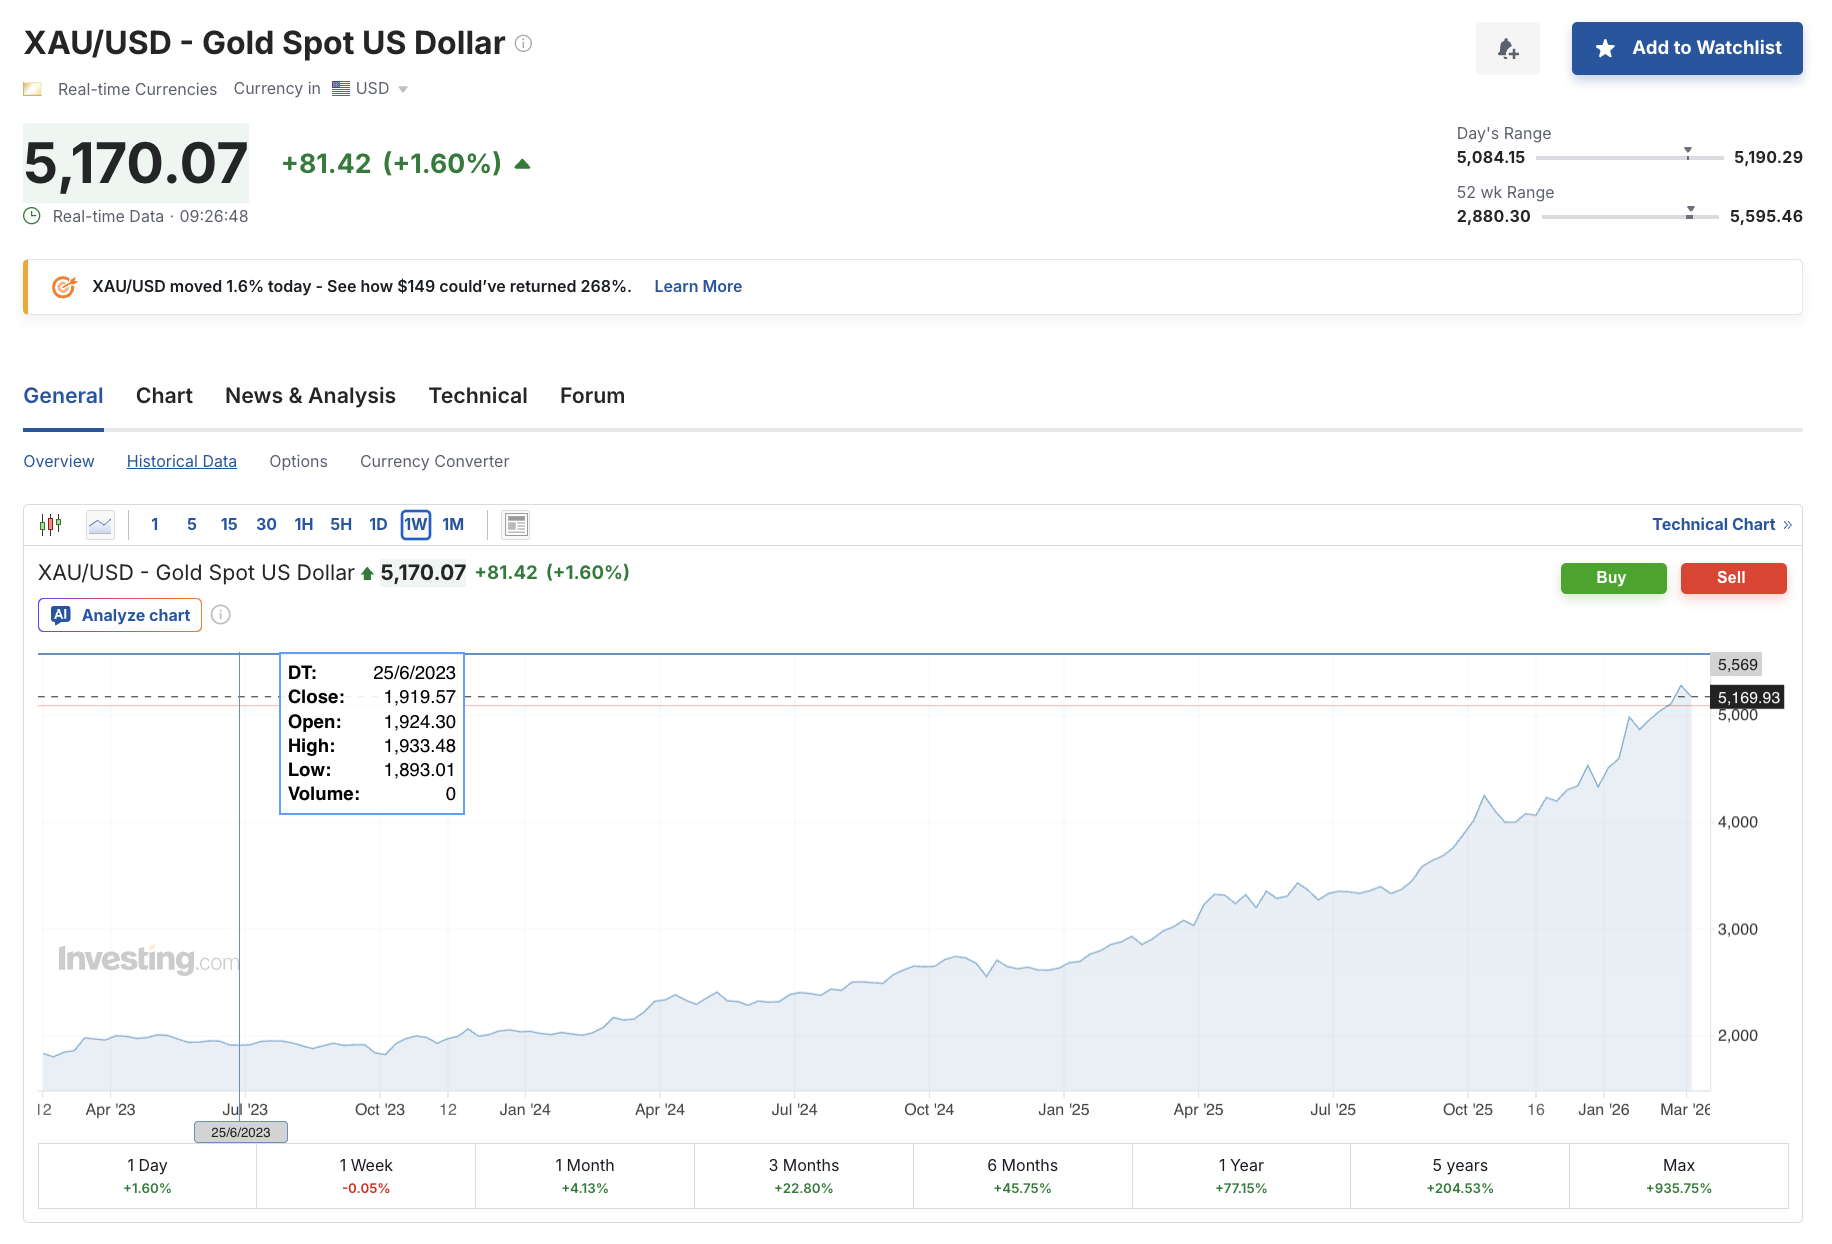 Gold Weekly Performance: Investing.com
Meanwhile, the macro backdrop should theoretically support gold. Brent crude oil has risen to above $78, driven by geopolitical tensions and supply concerns.
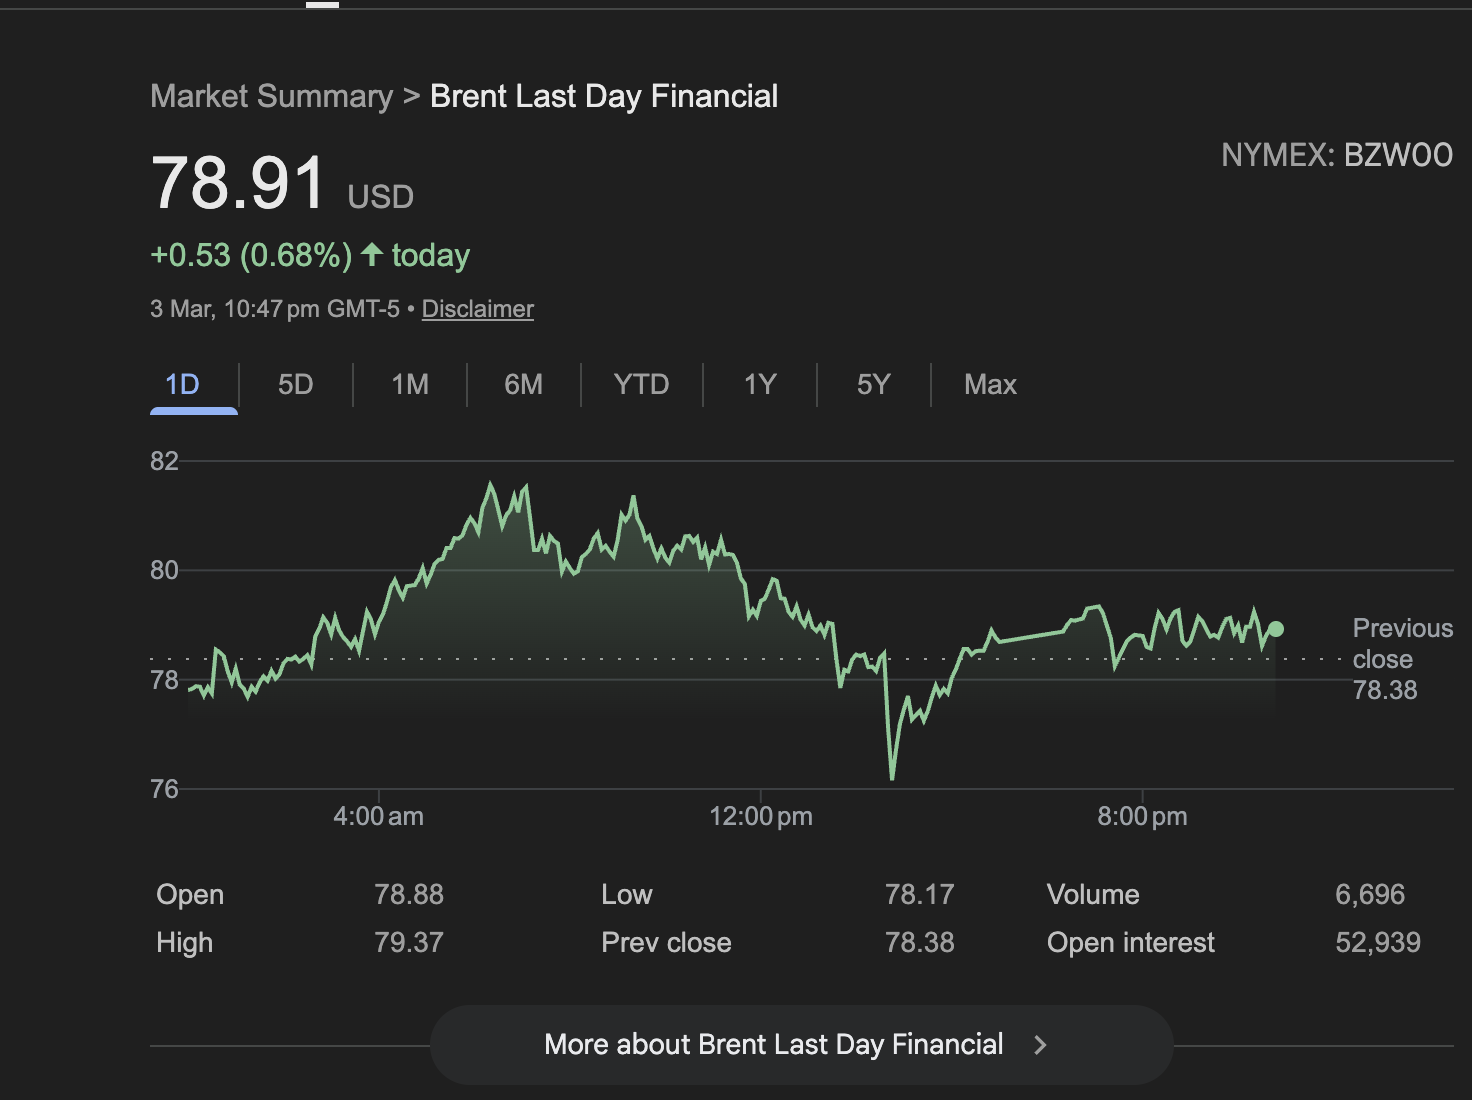 Brent Crude: Google
Rising oil feeds inflation expectations, which dents rate cut hopes and supports the dollar. The DXY has responded accordingly, climbing to 99.076.
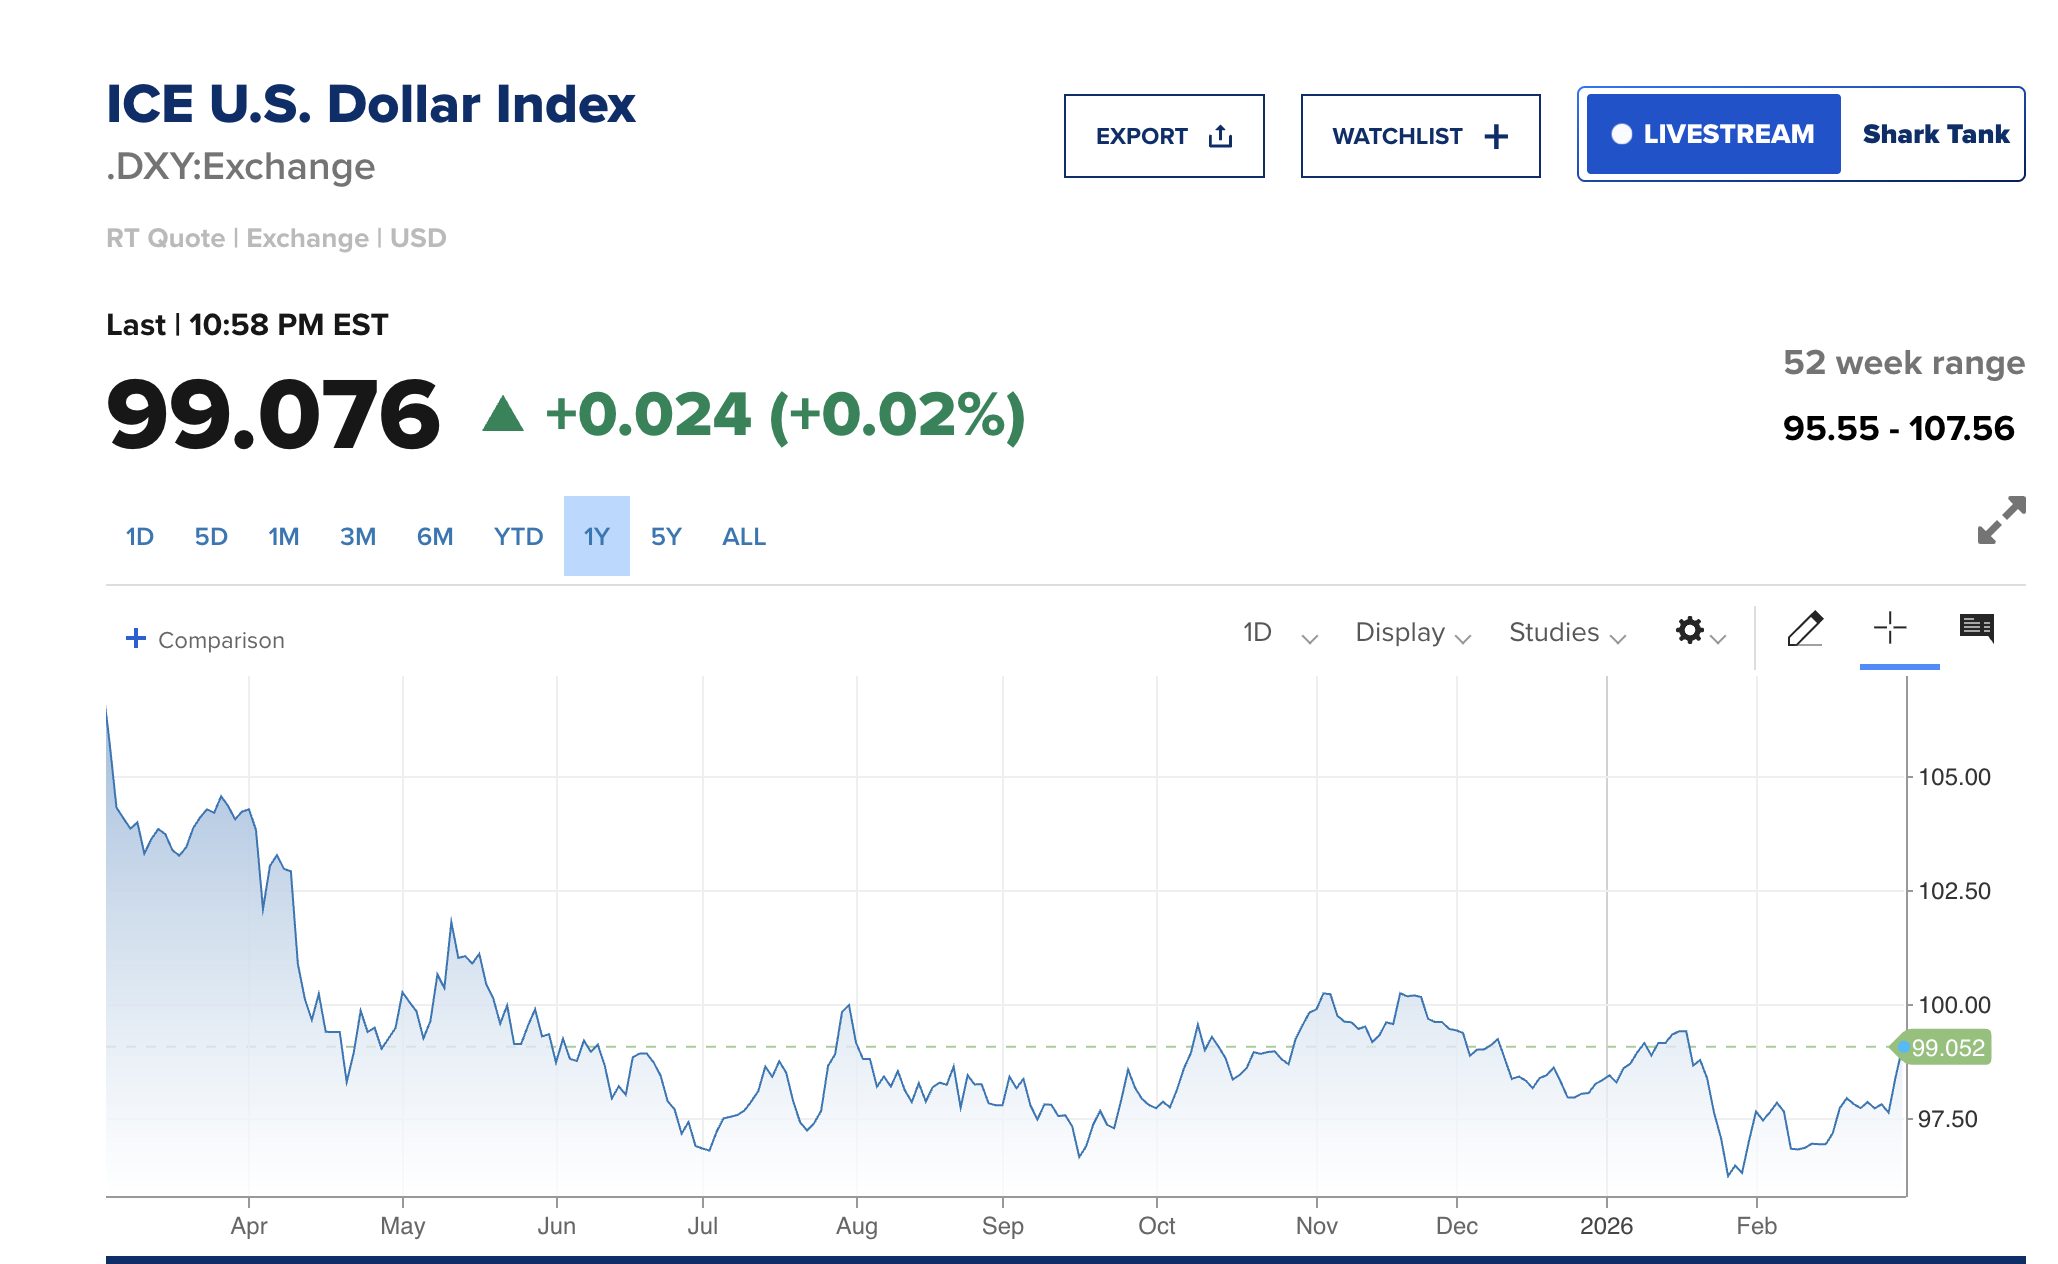 DXY Index: CNBC
Yet gold has corrected and stalled, while Bitcoin has gained 3.5% on the week. A stronger dollar is typically bearish for both. Yet, Bitcoin is absorbing the pressure in a way gold currently is not.
This divergence raises an important question. Whether it reflects a structural rotation from gold into Bitcoin or simply different demand dynamics, the data is clear. US buying demand is returning to BTC, mid-to-long-term holders are accumulating aggressively, and the daily rebound structure remains intact. Gold, despite the geopolitical tailwinds, has not been able to sustain its rally.
Bitcoin Price Levels Show Why $70,000 Is The Key Barrier
With the demand side of the equation establishing a foundation, Bitcoin’s price structure now points to $70,000 as the decisive level.
Based on the Fibonacci extensions drawn from the February 6 low (still a mild uptrend since then), the $70,000–$70,100 zone aligns with the 0.618 Fib level. This has been the ceiling that every rally attempt has hit since mid-February. Bitcoin bounced sharply off the lows, pushed above $70,000 briefly, but could not secure a daily close above this zone.
If Bitcoin manages a daily close above $70,100, it opens the path toward $72,200 (0.786 Fib). It could then potentially recover to $74,900 (1.0 extension).
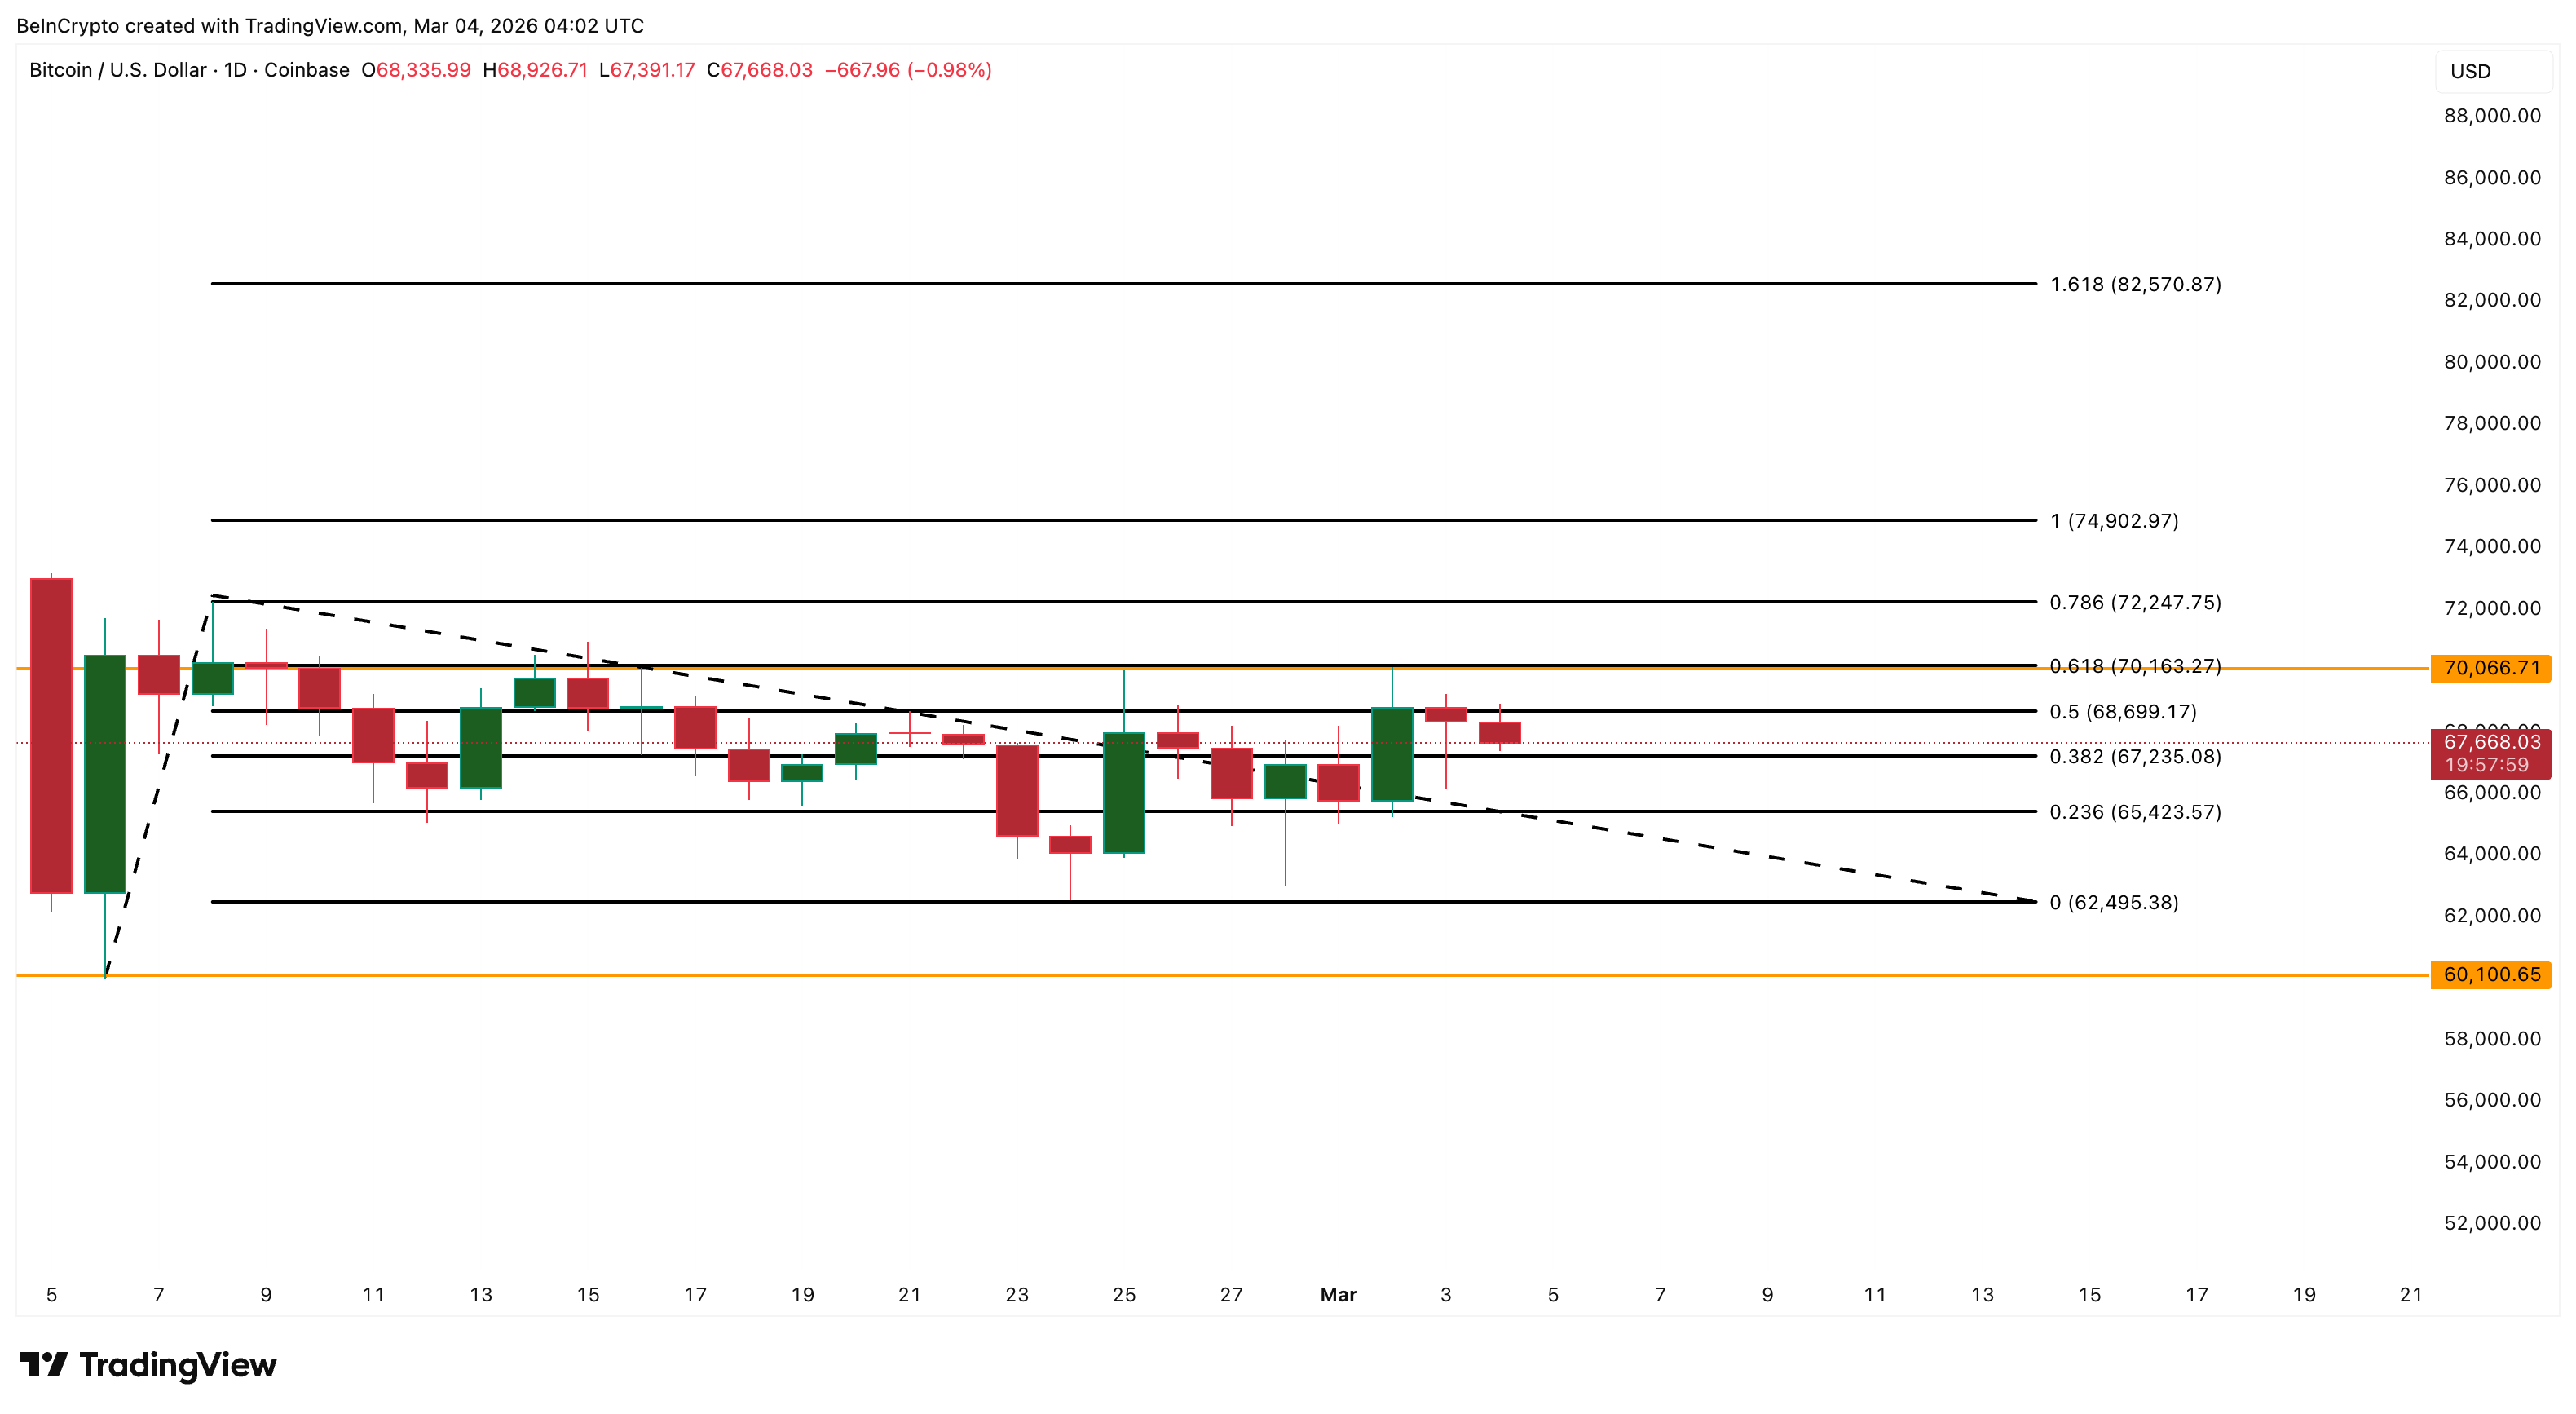 BTC Price Analysis: TradingView
On the downside, $67,200 (0.382 Fib) is the nearest crucial support. A break below this exposes $65,400 (0.236 Fib). The more critical structural level sits at $62,400, which marks the base of the current Fibonacci range. A confirmed break under $62,400 would open the door toward $60,100.
For now, returning US demand through the Coinbase premium, surging holder accumulation, an intact RSI divergence, and Bitcoin’s relative strength against gold all converge. The $70,000 barrier remains the key test. A breakout above it could shift Bitcoin’s narrative from resilience to recovery.
0
0


 Manage all your crypto, NFT and DeFi from one place
Securely connect the portfolio you’re using to start.


0
0

0
0