Bitcoin Taker Buy/Sell Ratio Shows Green Signal
0
0
On-chain data shows the Bitcoin taker buy/sell ratio started showing a green signal shortly before the surge above $22k.
Bitcoin Taker Buy/Sell Ratio Is Now Showing a “Buy” Signal
As pointed out by an analyst in a CryptoQuant post, the BTC taker buy/sell ratio suggested a bounce not too long before the rally today.
The “taker buy/sell ratio” is an indicator that measures the ratio between the Bitcoin long and short volumes in the futures market.
When the value of this metric is greater than one, it means the taker buy volume is currently more than the taker sell volume. Such a trend shows a bullish sentiment is dominant in the market right now.
Related Reading | On-Chain Data Shows Bitcoin Miners May Be Preparing To Dump
On the other hand, values of the ratio less than one imply the short volume is currently overwhelming the long volume, and thus the majority sentiment is bearish at the moment.
The relevant indicators here are actually the 15-day and 40-day moving averages (MAs) of the taker buy/sell ratio, and not the metric’s daily values.
The below chart shows the trend in these taker buy/sell ratio MAs for Bitcoin over the past couple of years.
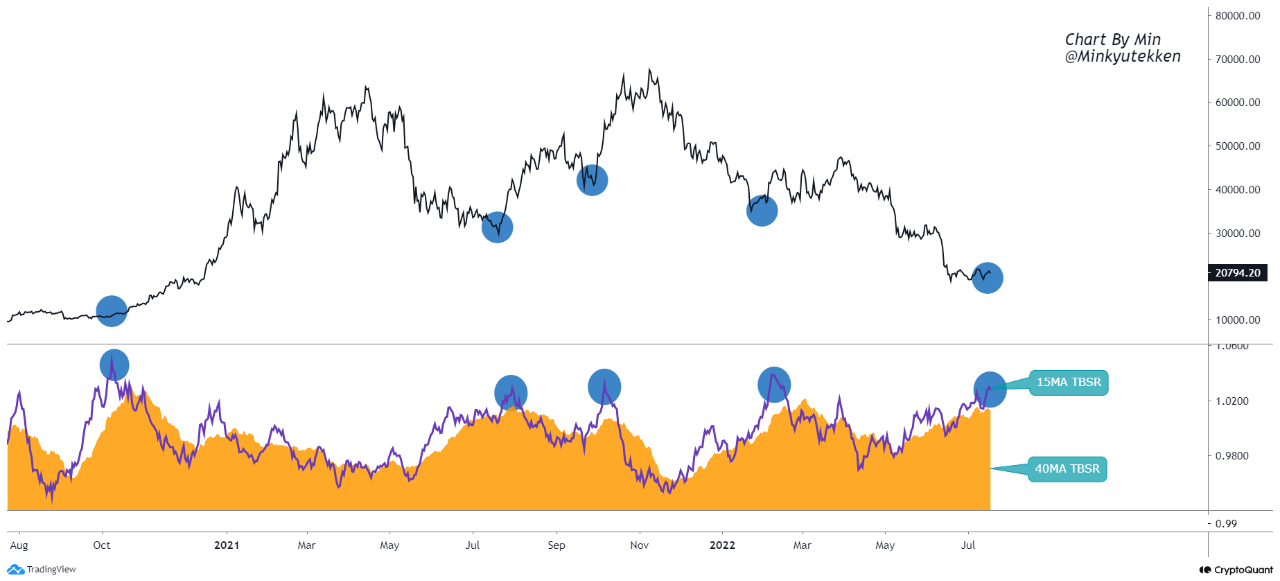
The value of the 15-day MA seems to have surged up in recent days | Source: CryptoQuant
In the above graph, the quant has marked the regions of the relevant trend for these Bitcoin taker buy/sell ratio MAs.
It looks like whenever the the 15-day MA has hit a high above the one mark while also staying at a higher value than the 40-day MA, the price of the crypto has observed a bounce shortly after.
Related Reading | Uniglo (GLO) Brings Forth Fractionalized Asset Ownership, Overshadowing Bitcoin (BTC), Ethereum (ETH), and Cardano (ADA)
Recently, both the 15-day and 40-day MAs have shown some growth, with the former seeing a steeper raise. This means that the pattern from the past has again formed now.
If the trend from those previous instances repeats this time as well, then Bitcoin could potentially observe some bullish momentum.
In fact, since the time the analyst posted the chart, BTC has already seen some sharp uptrend as the value of the coin has now broken above the $22k level.
BTC Price
At the time of writing, Bitcoin’s price floats around $22k, up 9% in the last seven days. Over the past month, the crypto has accumulated 7% in gains.
The below chart shows the trend in the price of the coin over the last five days.

Looks like the value of the crypto has sharply shot up over the last twenty-four hours | Source: BTCUSD on TradingView
Featured image from André François McKenzie on Unsplash.com, charts from TradingView.com, CryptoQuant.com
The post Bitcoin Taker Buy/Sell Ratio Shows Green Signal appeared first on .
0
0


 Manage all your crypto, NFT and DeFi from one place
Securely connect the portfolio you’re using to start.


0
0
