
What Is Profit and Loss? A Crypto Investor’s Guide
You're probably in one of two spots right now. Your portfolio app says you're up, but you're not sure what that number includes. Or you've traded across wallets, exchanges, staking platforms, and a few DeFi pools, and now your “profit” feels impossible to pin down.
That confusion is normal in crypto because P&L gets messy fast. A simple buy low, sell high calculation works for one clean trade. It falls apart once you add transfer fees, swaps, staking rewards, partial sales, wrapped assets, liquidity pools, and tokens spread across chains.
For a newer investor, the core question is simple: what is profit and loss? In plain terms, it's the difference between what you made and what it cost you to make it. In practice, crypto turns that into a record-keeping problem. If you don't track it properly, you can't tell whether your strategy is working, whether your risk is paying off, or whether you're just staring at temporary paper gains.
Tracking P&L programmatically? See API alternatives with per-trade P&L.
Understanding the Core Concepts of Profit and Loss
Start outside crypto for a second.
You buy a used laptop for personal resale. You pay one amount to get it, spend a bit cleaning it up, then sell it for more. Your profit is the sale price minus what the laptop and prep work cost you. If you sell for less than your total cost, that's a loss. That total cost is your cost basis.
Crypto works the same way at the foundation. If you buy ETH, your cost basis isn't just the token price. It usually includes what you paid to acquire the position, and in active trading, that detail matters more than most beginners think.
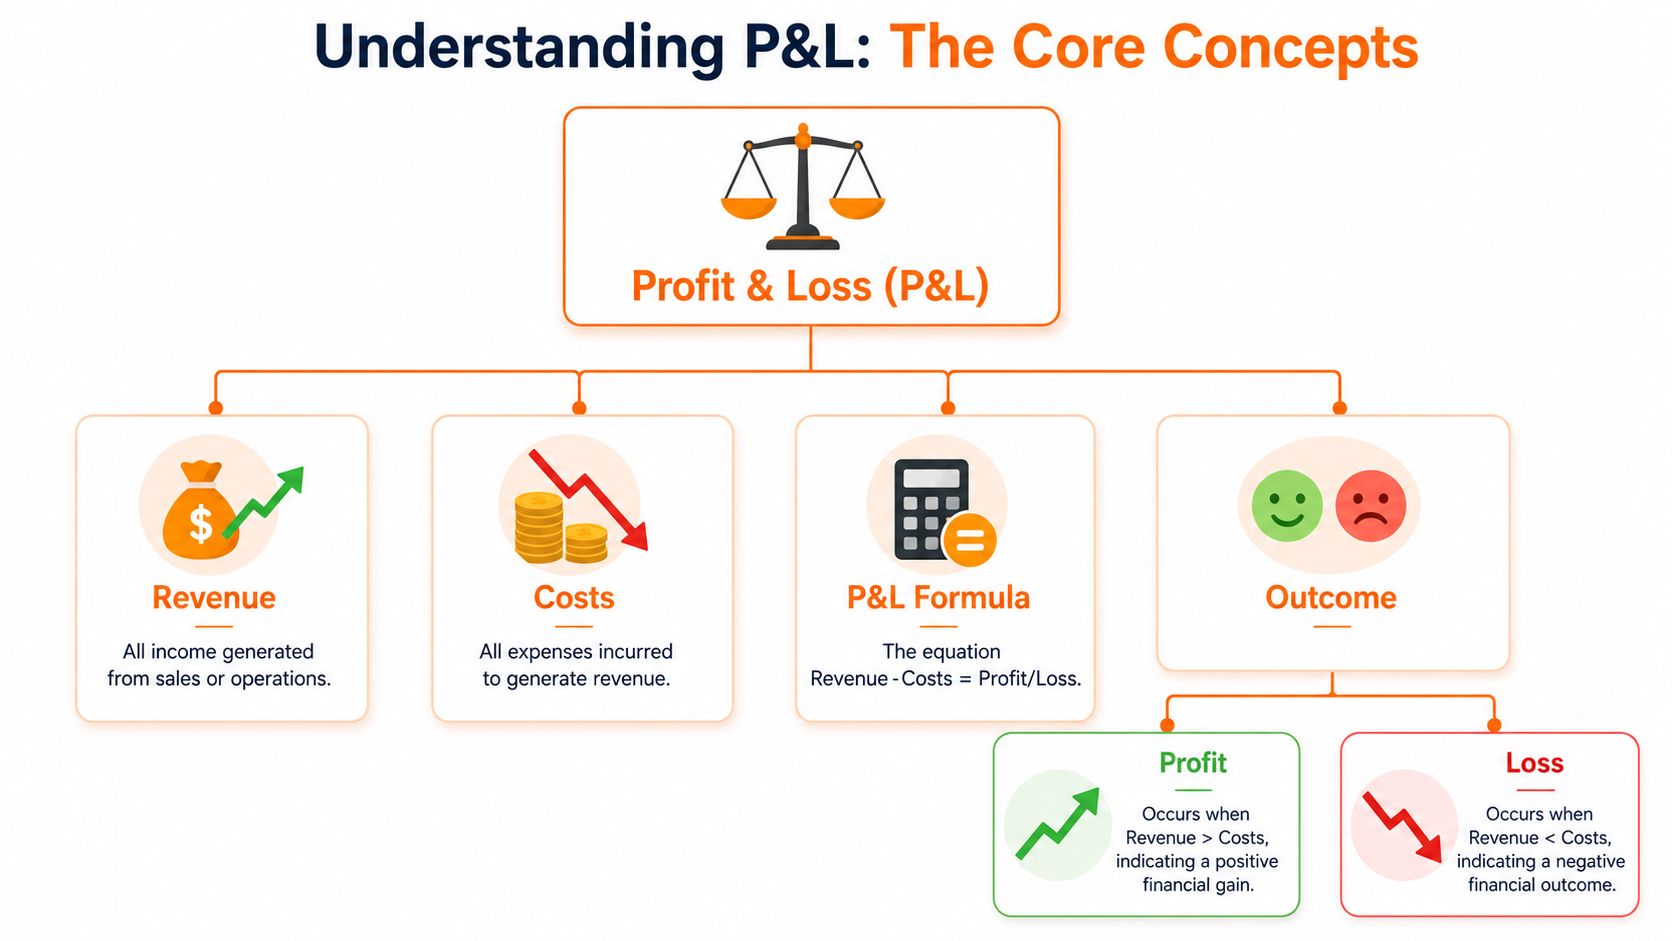
Start with the simple formula
At the most basic level:
-
Revenue or proceeds means what you received when you sold.
-
Costs means what you paid to enter and maintain the position.
-
P&L is the difference between those two.
That sounds almost too easy, and for one trade, it is. The trouble starts when you sell only part of a position, add to it later, or move assets around in ways that change your effective cost.
Why professionals read P&L in layers
In formal finance, a P&L statement is more useful as a multi-step performance model than as a single bottom-line number. Revenue minus cost of goods sold gives gross profit. Gross profit minus operating expenses gives operating income. Then non-operating items, interest, taxes, depreciation, and amortization lead to net profit, which helps isolate whether pressure is coming from production, overhead, or financing and tax effects, as outlined by Bank of America's guide to understanding and using a profit and loss statement.
Crypto investors can borrow that thinking even if they're not running a company.
A practical way to read your own portfolio is to separate outcomes into layers:
| Layer | What to look at |
|---|---|
| Entry economics | What you paid for the asset |
| Friction | Trading fees, gas, slippage |
| Yield and extras | Staking rewards, airdrops, LP fees |
| Exit result | What you actually got when you sold or swapped |
Practical rule: If you only track your final portfolio value, you miss the reason you made or lost money.
That's why experienced traders don't just ask, “Am I green?” They ask, “Did the trade work, or did rewards cover for a weak trade? Did fees eat the edge? Did I make money from price movement, or from yield?”
Once you think in layers, crypto P&L stops looking random. It starts looking like a set of separate moving parts you can evaluate.
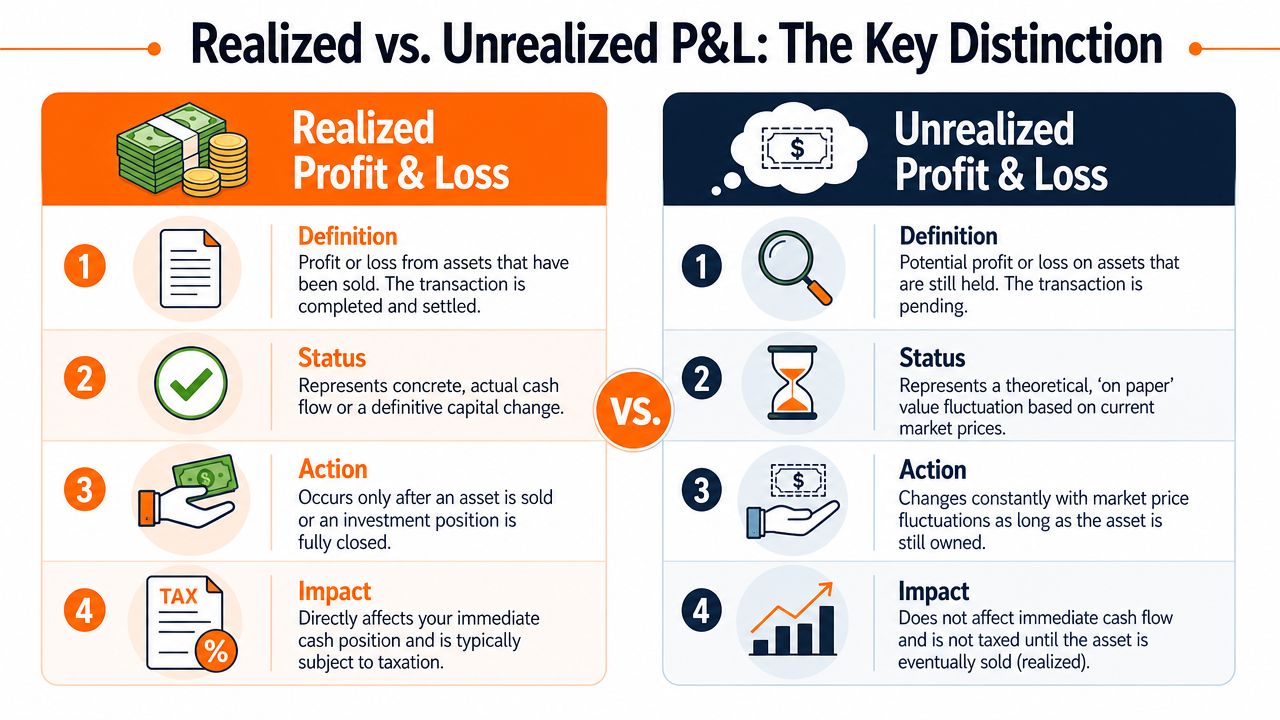
Realized vs Unrealized P&L The Key Distinction
A lot of portfolio confusion comes from mixing up two different things: realized P&L and unrealized P&L.
If you buy BTC and keep holding it while the market price moves up, that gain exists on paper. It may be very real to your net worth, but it isn't locked in. That's unrealized P&L. The moment you sell that BTC, or trade it for something else, the gain or loss becomes realized.
A simple BTC example
Say you buy BTC. Later, the market price rises.
-
If you're still holding it, your portfolio may show a gain.
-
If you sell part of it, only that sold portion creates realized P&L.
-
If the market drops before you sell, your unrealized gain can shrink or disappear.
That's why newer investors get trapped by screenshots and percentages. A portfolio can look strong while your bank balance hasn't changed at all. Unrealized profit doesn't automatically become spendable cash.
Why this matters in decision-making
This distinction matters far beyond psychology. It affects risk control, position sizing, and your sense of liquidity.
The broader point is that profit isn't the same as cash flow. Basic P&L explanations often stop at revenue minus expenses, but that misses the fact that performance on paper and available cash can diverge because timing matters, as noted in IG's explanation of profit and loss.
For crypto investors, that gap shows up in everyday situations:
-
Locked positions mean you may have gains you can't access immediately.
-
Staked assets can look profitable while remaining illiquid for a period.
-
Thin liquidity can make your displayed value different from what you'd realize on exit.
If you're holding assets like Staked Ether, this becomes even more practical. Your screen may show appreciation, but your real flexibility depends on whether the asset is liquid, withdrawable, or tied to a staking setup.
Paper gains help you measure performance. Realized gains help you pay bills, reduce risk, or redeploy capital.
A quick side-by-side check
| Type | What it means | When it changes |
|---|---|---|
| Realized P&L | Profit or loss on a closed trade | When you sell, swap, or otherwise exit |
| Unrealized P&L | Profit or loss on a still-open position | Whenever market price moves |
If you remember only one thing, remember this: a portfolio being up doesn't mean you have more cash in hand. That one distinction saves a lot of bad decisions.
The Unique Complexities of Crypto P&L
In stocks, many investors can get away with a rough spreadsheet. In crypto, that approach breaks down quickly. The asset itself is only one part of the calculation. The transaction path matters just as much.
Fees quietly change the outcome
Most newer investors underestimate how much small costs distort P&L.
A centralized exchange fee is obvious because you see it on the trade. Gas is trickier. You pay to move assets, approve contracts, swap tokens, bridge funds, and interact with protocols. That cost may not feel like part of the trade, but economically it is.
Then there's slippage. You expected one execution price and got another. That spread isn't always tracked cleanly if you're trying to reconstruct trades by hand later.
Here's what usually goes wrong in manual records:
-
Trade-only tracking ignores network fees tied to entry and exit.
-
Wallet-only tracking misses exchange fills and average entry changes.
-
Spreadsheet summaries flatten multiple events into one line and hide the actual cost basis.
Yield isn't free money
Crypto adds income-like events that are easy to misunderstand.
Staking rewards, farming incentives, and airdrops can all change your portfolio economics. They may feel like “extra” tokens, but they still affect your overall result. If you later sell those assets, you also need to know when and how they entered your holdings so you can evaluate the position properly.
This gets more confusing with stablecoins such as USD Coin. Many investors park funds in stables and think of them as neutral inventory. In practice, those balances often move through lending apps, swaps, and liquidity venues, and each step can alter the record you need to calculate P&L correctly.
The hardest part of crypto P&L isn't the formula. It's the event history.
Impermanent loss changes the picture
Liquidity pools are where manual P&L tracking usually goes off the rails.
When you deposit two assets into a pool, your result doesn't come only from token prices. It also depends on how the pool rebalances your assets over time, what fees you earn, and whether the final value of your withdrawn position beats holding the original tokens. That gap is what people refer to as impermanent loss.
It's not always a permanent loss in the accounting sense, and it doesn't always tell the whole story by itself. But if you ignore it, you can think a strategy worked when the pool mechanics reduced your outcome relative to holding.
Cross-chain activity creates record-keeping problems
A serious portfolio rarely lives in one place. You might buy on a centralized exchange, transfer to an EVM wallet, bridge to another network, swap in a DEX, and then stake the result.
That creates several headaches at once:
-
Cost basis fragmentation because one position gets split across platforms.
-
Duplicate-looking transfers that are movement, not new purchases.
-
Asset renaming issues with wrapped or bridged versions of the same exposure.
-
Timing mismatches when apps record transactions differently.
If you want a broader framework before going deeper into asset selection and risk, this cryptocurrency investing guide can help frame the bigger portfolio decisions around those mechanics.
Why manual tracking usually fails
Manual tracking can work for a tiny portfolio with infrequent buys and clean sales. It usually fails once you add:
| Activity | Why it complicates P&L |
|---|---|
| Staking | Rewards create new lots or added holdings |
| Swaps | One asset disposal becomes another asset acquisition |
| Bridging | Transfers can look like buys and sells if not reconciled |
| LP positions | Pool mechanics alter holdings over time |
| Multiple wallets | The same strategy gets split across disconnected records |
The result is simple. Many investors don't have a profit problem. They have a bookkeeping problem.
A Practical Crypto P&L Calculation Example
A clean example shows why this gets annoying fast. Let's use Alex, a normal crypto investor with a few common transactions.
Alex buys ETH, pays gas to move it, stakes some, receives rewards, swaps part into BTC, and later sells some crypto back out. Nothing exotic. This is still enough to make manual P&L tedious.
Alex's transaction trail
| Step | Activity | P&L impact |
|---|---|---|
| 1 | Buys ETH | Establishes initial cost basis |
| 2 | Pays network fees to move ETH | Increases effective cost of managing the position |
| 3 | Stakes part of ETH | Changes where the asset sits, but not necessarily whether profit is realized |
| 4 | Receives staking rewards | Adds new units that need their own tracking history |
| 5 | Swaps some ETH into BTC | Realizes gain or loss on disposed ETH and creates a cost basis for BTC |
| 6 | Sells part of BTC or ETH | Converts part of unrealized result into realized P&L |
Where people make mistakes
A beginner often records only the obvious entries:
-
Bought ETH
-
Swapped to BTC
-
Sold BTC
That leaves out the mechanics that decide whether the record is usable.
For example, if Alex swaps ETH into Bitcoin, that isn't just a new BTC buy in practical P&L terms. It also closes, fully or partially, part of the ETH position. If ETH had moved since the original purchase, the swap itself may create realized profit or loss on the ETH side.
A better way to think through the ledger
Use a running checklist instead of trying to compute one giant number at the end.
| Question | Why Alex needs it |
|---|---|
| What asset was left in the wallet? | That may trigger realized P&L |
| What asset entered the wallet? | That needs a new cost basis |
| Were fees paid separately? | Fees can reduce the net result |
| Was this a transfer or a disposal? | A bridge isn't the same as a sale |
| Did rewards arrive? | Those holdings must be tracked from receipt onward |
If you can't reconstruct the order of events, you can't trust the P&L number.
What Alex learns from the exercise
By the end of this small example, Alex has at least three separate views of performance:
-
Current portfolio value across ETH, BTC, and rewards.
-
Realized P&L from any asset that was sold or swapped away.
-
Unrealized P&L on the positions still open.
That's the practical lesson. Even a modest amount of normal crypto activity creates a layered ledger, not a single trade outcome. You can do it by hand for a while, but once trades spread across wallets and chains, the error rate climbs fast. Most investors don't notice until tax season or until they try to answer a simple question like, “Did I make money on this strategy?”
How to Automatically Track Your Crypto P&L
Once you've tried to calculate crypto P&L manually, the core problem becomes obvious. The math isn't hard. The data collection is hard.
You need transaction history from exchanges, wallet transfers, on-chain swaps, staking activity, and token receipts. Then you need to classify each event correctly. Was it a buy, sale, transfer, reward, fee, or LP interaction? If that classification is wrong, the final P&L number is wrong too.
![]()
What automation actually fixes
A proper tracker solves three separate problems:
-
Aggregation by pulling holdings and transactions into one view
-
Normalization by interpreting activity from different chains and platforms in a consistent format
-
Calculation by separating realized and unrealized P&L without forcing you to rebuild every trade manually
When managing activity across multiple venues, a portfolio tool becomes practical, not cosmetic. A tracker like CoinStats Portfolio Tracker can consolidate wallets and exchange accounts so you can review holdings and performance in one place instead of reconciling scattered records.
What to look for in a tracker
Not every app that shows balances is useful for P&L.
The tracker needs to handle the ugly parts of crypto:
| Requirement | Why it matters |
|---|---|
| Wallet and exchange syncing | Prevents missing chunks of your history |
| Fee awareness | Keeps trade outcomes from looking inflated |
| Realized and unrealized separation | Helps you distinguish closed results from open exposure |
| Asset-level detail | Let's see which positions are actually working |
| Cross-chain coverage | Reduces broken records when assets move |
A tool that only shows current balances is fine for casual monitoring. It won't help much when you need to answer performance questions with confidence.
AI and API use cases
Once your records are organized, analysis gets easier. Investors who want another layer of interpretation can use CoinStats AI to explore market context and asset-specific insights from a single interface.
For developers and advanced users, direct data access matters just as much as dashboards. The CoinStats API documentation covers broader access, and chain-specific references are available for Ethereum and EVM wallets, Solana wallets, Bitcoin wallet data, and other supported chains.
That matters if you want to:
-
Build custom dashboards for your own reporting workflow
-
Audit transaction classifications against your internal records
-
Feed portfolio data into other tools for alerts, analysis, or accounting processes
A short walkthrough helps if you want to see how portfolio tracking looks in practice.
Bottom line: the only sane way to track active crypto P&L is to automate the collection and classification of transaction data.
Manual spreadsheets still have a place for spot checks and strategy notes. They're weak as a primary ledger once your crypto activity includes multiple wallets, staking flows, DeFi transactions, and partial exits.
Putting Your P&L Analysis Into Action
Understanding what is profit and loss matters because it changes how you behave as an investor. You stop treating your portfolio like a scoreboard and start treating it like a set of decisions with measurable outcomes.
A useful P&L view tells you whether your trades worked, whether your yield strategies were worth the complexity, and whether fees had eroded your edge. It also forces discipline. If a strategy looks smart in theory but your records show weak realized results, the market has already given you the answer.
Questions worth asking regularly
-
Are your wins coming from price appreciation or from rewards and incentives?
-
Do your transaction costs make active trading less effective than holding?
-
Are you sitting on gains that are still unrealized and easy to lose in a reversal?
-
Can you explain your cost basis without guessing?
The investors who improve over time usually do one thing well. They review performance objectively. Not just portfolio value. Actual position-level outcomes.
That's the practical point of P&L analysis in crypto. It's not accounting for the sake of accounting. It's feedback. If your records are clean, you can adjust faster, cut weaker habits, and size up the strategies that are producing results.
If you want a clearer view of your holdings, transaction history, and crypto profit and loss across wallets and exchanges, CoinStats gives you one place to monitor the portfolio data that manual tracking usually turns into a mess.