
How to Read a Crypto Correlation Matrix

Key Takeaways
- A crypto correlation matrix shows how closely different cryptocurrencies move together using values from -1 to +1.
- Correlation changes across timeframes, so comparing short-term and long-term data provides a clearer picture.
- Highly correlated cryptocurrencies offer limited diversification, as they tend to move in the same direction.
- Correlation measures historical relationships, not volatility, causation, or future price movements.
- Combining crypto correlation with Bitcoin dominance helps identify market trends and shifts in relative strength between Bitcoin and altcoins.
You bought Bitcoin, Ether, Solana and a few altcoins to spread your risk. Then the market dropped and every coin fell on the same day. That is what a crypto correlation matrix would have warned you about.
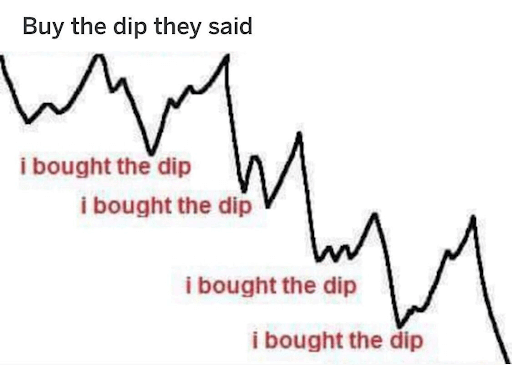
A correlation matrix shows, in one grid, how closely each pair of coins moves together. Once you can read it, you can tell real diversification from five versions of the same bet.
This guide explains every part of the grid, walks through a crypto example step by step, and shows how it connects to Bitcoin dominance.
What is a crypto correlation matrix?
A crypto correlation matrix is a table that lists the same coins across the top and down the side. Each cell holds a correlation coefficient, a number from -1 to +1 that shows how closely two coins’ returns moved together over a set period.
Many tools use Pearson correlation, which measures the strength and direction of a linear relationship. In plain language, it asks whether higher returns in one asset tend to line up with higher or lower returns in another.
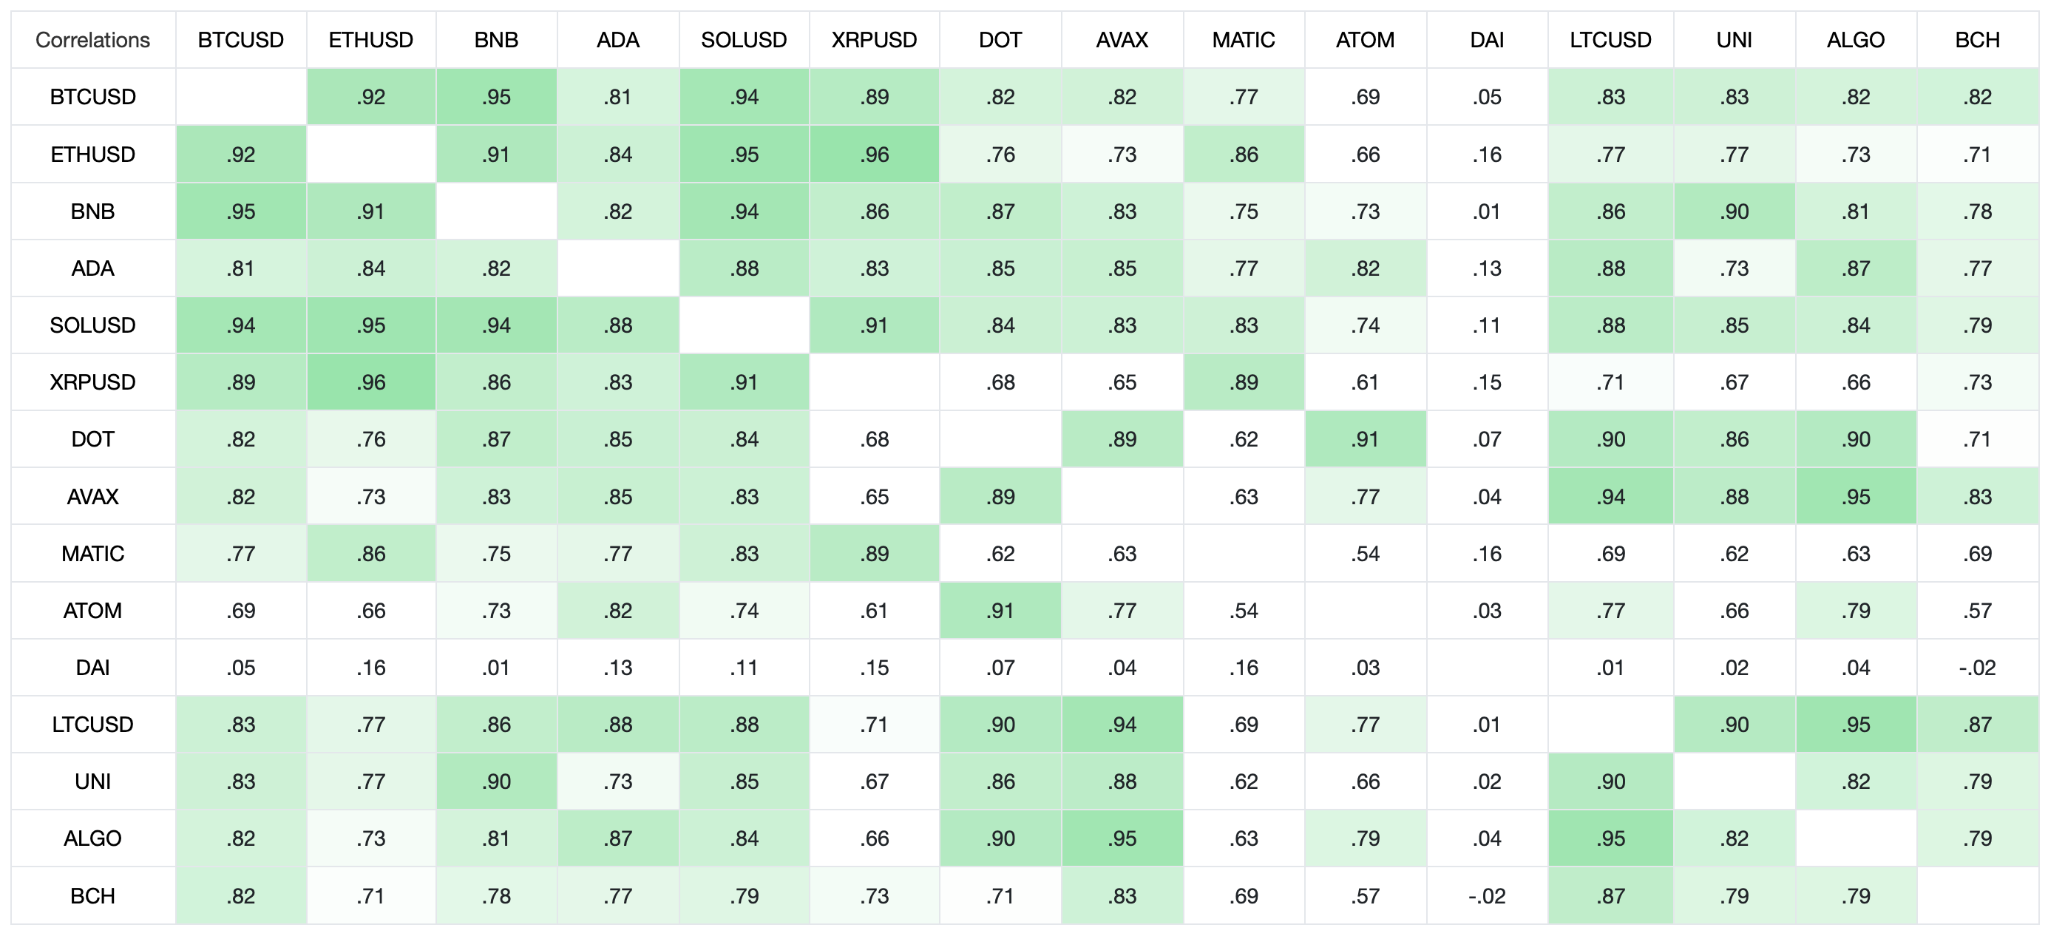
Every matrix also has a lookback window, such as 30 days, 90 days or 1 year. The same pair of coins can show very different numbers in different windows, so always check which one you are looking at.
Many tools, including the one shown above from Trading Economics, color the cells as a heatmap. Dark green or blue usually means a strong positive link, red means a negative link, and pale or white cells sit near zero. Colors vary by tool.
How to read a crypto correlation matrix
We will use the example matrix below. It shows 1-year correlations for five crypto assets.
To read the crypto correlation matrix, start by setting the timeframe you want to analyze. Then, pick the two assets you want to correlate.
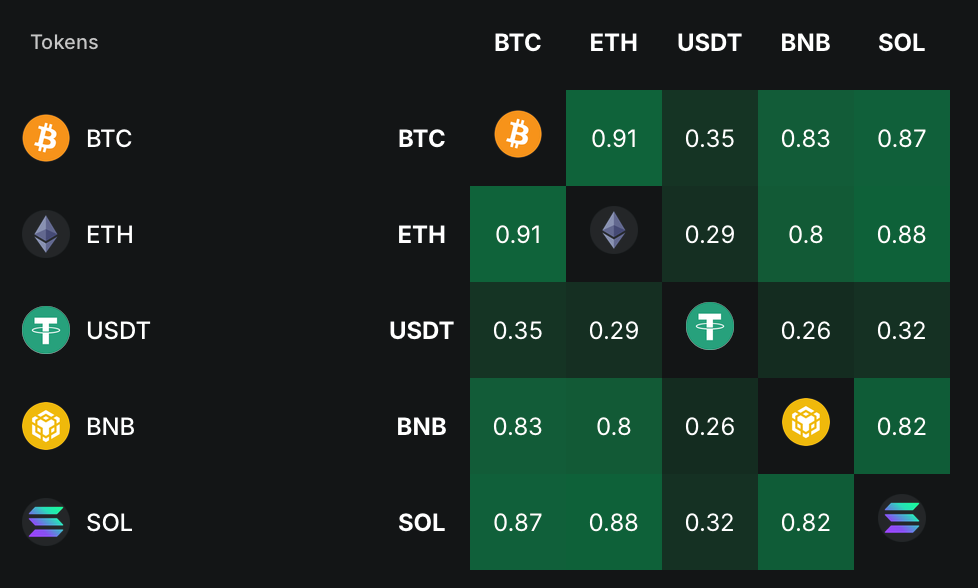
From the example above, let’s see how ETH correlates with BTC.
As per the table, the correlation coefficient is 0.91 for Bitcoin-Ethereum pair. That means, the prices of two assets are closely correlated.
At the same time, in case of the ETH-USDT pair, the correlation coefficient is 0.29. That would mean that there is a weak but considerable correlation between the assets.
Importantly, the correlation strength can vary based on the chosen timeframe. Consider the correlation matrix of the same set of five crypto assets below but on a 7-day horizon.
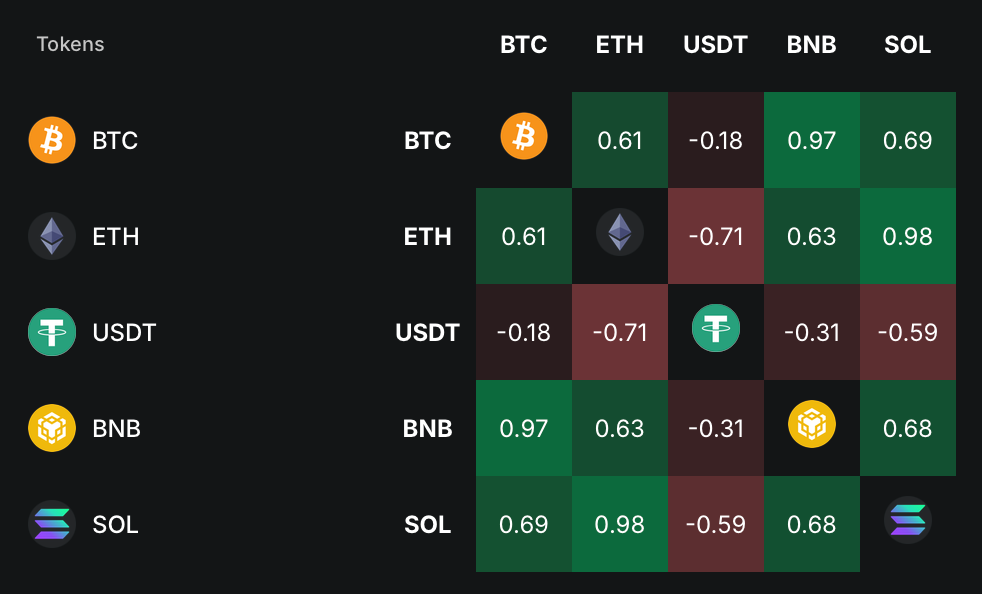
In the 7-day crypto correlation matrix above, the Bitcoin-Ethereum pair show a coefficient of 0.61, indicating moderate correlation. That is a completely different story from what the 1-year matrix showed.
You’d also notice negatives in the matrix. For instance, the ETH-USDT pair have a coefficient of -0.71. That indicates a strong negative relationship.
Essentially, the sign tells you the direction of the relationship. Positive correlation means higher returns in one asset tend to accompany higher returns in the other. With negative correlation, higher returns in one tend to accompany lower returns in the other.
| Example value | How to interpret it |
| +1.00 | Perfect positive linear relationship between the sampled returns |
| +0.80 | Strong positive relationship |
| +0.40 | Moderate positive relationship |
| 0.00 | No measured linear relationship |
| −0.40 | Moderate negative relationship |
| −0.80 | Strong negative relationship |
| −1.00 | Perfect negative linear relationship between the sampled returns |
A correlation of 0.80 does not mean the coins move in the same direction 80% of the time. It is neither a probability nor a count of matching days. It also does not mean that a 1% Bitcoin gain produces a 0.8% gain in another coin.
Why the timeframe changes the result of the crypto correlation matrix
A correlation reading belongs to a particular set of dates. It is not a permanent characteristic of a coin.
A 30-day matrix describes recent behavior. A 90-day matrix includes a broader period, and a one-year matrix may combine several different market conditions. Shorter windows react faster to new observations, whereas longer windows can smooth those changes and obscure recent shifts.
For more customized analysis, developers can use the CoinStats API to access historical cryptocurrency market data and calculate correlations across different timeframes.
What a correlation matrix can and cannot tell you
It can reveal shared exposure
A matrix helps you spot holdings whose returns have moved together. That is useful when assessing crypto portfolio diversification.
But the size of each holding matters. A portfolio with 90% in one coin has a different risk profile from an equally weighted portfolio, even if both contain the same assets and use the same correlation matrix.
Low correlation can contribute to diversification, but it does not guarantee smaller losses. Diversification itself cannot prevent losses during a market decline.
It does not measure the size of price swings
Correlation and volatility describe different things. Volatility concerns the size of an asset’s fluctuations; correlation concerns how two return series relate.
If one asset’s return is exactly twice another’s in every observation, their correlation is +1.00, even though its swings are twice as large.
That is why two highly correlated coins can produce very different portfolio results. Compare their volatility and actual returns alongside the correlation reading.
It does not prove causation or predict the next move
A high Bitcoin–Ethereum correlation does not establish that Bitcoin caused Ethereum’s price change. Both could be responding to the same news or market conditions.
An ordinary matrix also compares observations from the same intervals. It does not show which asset moved first or establish that one coin will catch up with another later.
A weak reading does not rule out every relationship, either. Pearson correlation can miss relationships that do not follow a straight-line pattern. Unusually large observations can also have a substantial effect on the result.
Crypto correlation vs. Bitcoin dominance
Crypto correlation and Bitcoin dominance describe different aspects of the market.
| Measure | What it tells you |
| Crypto correlation | How closely two assets’ returns moved together over a period |
| Bitcoin dominance | Bitcoin’s share of the tracked total crypto market capitalization |
| Relative performance | Which asset gained more or lost less over the same dates |
Bitcoin dominance is calculated as:
BTC dominance = (Bitcoin market cap ÷ Total crypto market cap) × 100
Market capitalization depends on price and circulating supply. Dominance therefore measures a share of market value, while a return correlation measures a relationship between price changes.
You can use the CoinStats Bitcoin dominance chart to track Bitcoin’s market share alongside Ethereum and the rest of the market. Then compare that context with the BTC row in a correlation matrix.
Bitcoin dominance can fall while correlations stay high
Suppose Bitcoin’s market cap rises from $1 trillion to $1.1 trillion, while the rest of the crypto market grows from $1 trillion to $1.2 trillion.
Then, Bitcoin dominance fell from 50% to about 47.8%, even though Bitcoin’s own market cap increased.
That change can occur while Bitcoin and major altcoins retain strongly positive daily return correlations. They can respond to similar market moves while the rest of the market grows faster.
The reverse can happen during a decline. Bitcoin dominance can rise if its market cap falls less than the rest of the market. Rising dominance does not necessarily mean Bitcoin’s price is rising.
How to use crypto correlation matrix and BTC dominance together
Use the two measures in a simple research sequence:
- Choose comparable dates. Note the correlation window and inspect dominance over the same period.
- Read Bitcoin’s row. Identify which assets had strong or weak relationships with BTC returns.
- Check the dominance trend. Establish whether Bitcoin’s share of tracked market value rose or fell.
- Compare actual performance. Check which coins gained more or lost less. Correlation alone cannot answer this.
- Look beyond the headline. Review total market cap, circulating-supply changes, and whether a few large assets explain most of the shift.
For example, high positive correlations alongside falling BTC dominance may be consistent with altcoins gaining market share while still moving with Bitcoin. Verify that reading against their actual returns and market caps.
If dominance is rising while prices are falling, check whether Bitcoin is simply losing value more slowly than the rest. The total crypto market cap chart can help you distinguish a change in market share from a change in overall market size.
| Altcoin correlation with BTC | BTC dominance | What it usually suggests |
| High | Rising | Altcoins follow BTC but lag it. Money is concentrating in Bitcoin. |
| High | Falling | Altcoins move with BTC but swing harder. Often seen in broad bull runs. |
| Falling | Falling | Altcoins move on their own and gain share. A classic early sign of altcoin season. |
| Falling | Rising | Altcoins break away from BTC and lose share. Often coin-specific weakness. |
Frequently asked questions
What is a good correlation for crypto portfolio diversification?
For diversification, look for pairs below about 0.5, and ideally near 0 or negative. Most large crypto assets sit above 0.7 with Bitcoin, so true diversification usually means adding assets outside the BTC-led cluster, such as stablecoins or non-crypto assets.
Why is the diagonal always 1 in the crypto correlation matrix?
Each diagonal cell compares a coin with itself. A coin’s returns always match its own returns perfectly, so the value is always 1.00. It carries no information, and you can skip it when reading the matrix.
What timeframe should I use?
Use 30 days to see the current market mood and 90 days or 1 year for the longer relationship. Traders usually lean on shorter windows, while long-term investors care more about 90-day and 1-year views. Comparing two windows shows whether a relationship is changing.
Is a negative correlation good?
A negative correlation means two assets tend to move in opposite directions. That can soften losses in a portfolio, but only if the relationship is stable. Strong negative correlations between crypto assets are rare and often short-lived, so check them across several windows.
Does high correlation with Bitcoin mean an altcoin will rise when BTC rises?
It means the altcoin has tended to move in the same direction as Bitcoin over the chosen window. It does not guarantee the future, and it says nothing about how much the altcoin will move. Past correlation is a guide, not a forecast.
How is a correlation matrix different from Bitcoin dominance?
A correlation matrix shows whether coins move in the same direction. Bitcoin dominance shows Bitcoin’s share of total crypto market cap, so it tracks whether altcoins are gaining or losing ground. Used together, they show both direction and relative strength.
Why do two crypto correlation tools show different numbers?
They may use different dates, observation intervals, exchanges, reference currencies, return calculations, or rules for missing data. Compare their methods and matched observations before deciding that one is wrong. A short or incomplete history can also make a reading less informative.
Does negative correlation make a coin a reliable hedge?
No. A negative reading describes the selected historical sample. The relationship can change, and the assets’ different volatility and position sizes affect whether their gains and losses offset each other. A negative coefficient alone does not establish a dependable hedge.
What is a good crypto correlation score?
There is no universally good score. A high positive value is useful when identifying similar historical behavior. A lower value may be relevant when researching diversification. Neither reading, by itself, tells you whether an asset is a good investment.