How is the coin market doing? A clear, practical snapshot

0
0
Use this article as a practical routine. Follow the three-source checklist and the short examples to build a repeatable habit for checking the market in minutes.
What the coins market means today: a clear definition and quick context
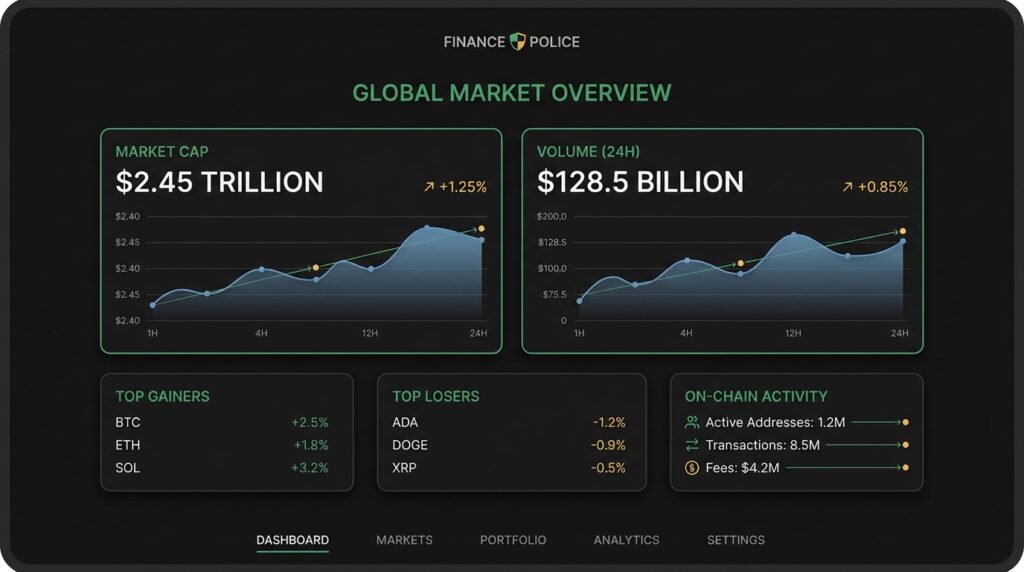
The coins market refers to the combined value and trading activity of cryptocurrencies tracked across exchanges and blockchains. For a quick snapshot people commonly look at total market cap and 24h volume to see scale and trading intensity, and use aggregators for live numbers like market cap and volume CoinMarketCap charts
Run the three-source checklist
Use the three source checklist later in this guide as a short routine you can copy, and check live aggregator snapshots to confirm headline moves before digging deeper
Market aggregators show price and volume snapshots across many coins, while on-chain providers measure flows, accumulation signals, and exchange movements. Aggregator numbers are fast for headlines. On-chain signals help explain whether coins are being accumulated or moved to exchanges for selling, which matters for interpreting short term rotation
As of early 2026 the overall market remained a multi trillion dollar ecosystem by common aggregator measures, but short term moves often reflect rotation and volatility rather than a single broad trend CoinGecko global charts

How to get a quick market snapshot from aggregators
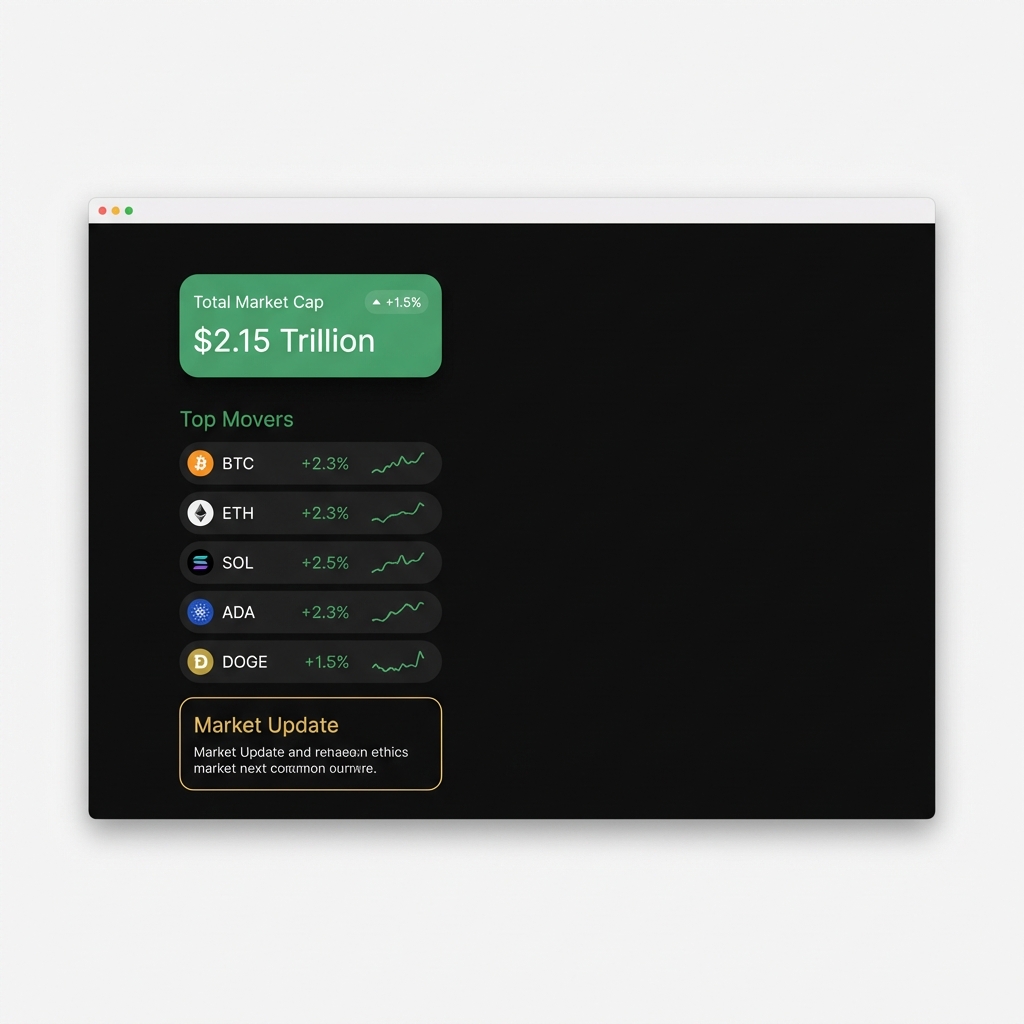
Open an aggregator page and scan four fields first: total market cap, 24h volume, BTC or ETH dominance, and top gainers and top losers. Those fields give you scale, how much trading is behind price moves, market share trends, and which coins are moving in a given day
On aggregator pages use the top movers and top losers list to spot intraday rotation, and check whether moves are backed by volume. News roundups and market wraps can help find the headlines that explain big movers, but treat them as prompts to verify numbers CoinDesk market wrap and consider cross-checking orderbook or derivatives data on CoinGlass
What on chain indicators are saying now about the coins market
On-chain indicators measure things like exchange inflows and outflows, active addresses, and accumulation metrics that try to show whether holders are adding or reducing positions. These indicators are useful to see if price moves match actual flows reported on blockchains, and they often give a different view from price snapshots Glassnode market report January 2026 and see Glassnode for analytics platforms
The coin market remains a multi trillion dollar ecosystem by common aggregator measures, but January 2026 on-chain signals show mixed accumulation and elevated volatility, suggesting active rotation rather than a uniform trend.
January 2026 on-chain readings showed mixed accumulation across major coins while volatility stayed elevated. That pattern is consistent with active rotation among traders rather than a uniform bull trend
Major macro and regulatory drivers that move the coins market
Regulatory developments and enforcement actions also change liquidity and exchange flows. Analysis has shown that some types of crypto crime moderated in recent years, but compliance and enforcement remain material for how money moves between wallets and exchanges Chainalysis 2024 crypto crime report. See the Finance Police crypto category for related coverage
A simple three source checklist to assess the coins market
The three source check is short and repeatable: 1) an aggregator snapshot for total market cap and top movers, 2) one on-chain indicator for flows or accumulation, and 3) a macro or regulatory headline that could change liquidity. Combining these reduces common blind spots when looking at near-term direction CoinMarketCap charts
Here is a five step workflow you can run in 5 to 10 minutes: 1. Open an aggregator and note total market cap and 24h volume. 2. Check the top 3 gainers and losers and whether volume increased. 3. Consult one on-chain metric, such as exchange inflows or an accumulation indicator. 4. Scan recent macro or regulatory headlines for any new announcements. 5. Decide whether the signal is clear enough to act, or if it needs more monitoring

When you run the workflow, keep notes on what confirmed and what contradicted the quick snapshot. Over time a short checklist helps you see which signals tend to be reliable for your purposes
How to monitor the market live without getting overwhelmed
Set a short daily routine that checks total market cap, 24h volume, and top movers once or twice a day. For most readers that is enough situational awareness without being glued to the screen CoinDesk market wrap
Use alerts for thresholds that matter to you, such as a large percentage move in a coin you hold or a sudden spike in exchange inflows. Filters and targeted alerts reduce noise. Before reacting to a headline, verify the numbers on an aggregator and an on-chain indicator
Short term outlook: what could move the coins market in the coming weeks
Three high impact items to watch are central bank policy statements, major regulatory rulings, and large on-chain flow events like sudden exchange inflows or outflows. Each can affect liquidity and price direction quickly Glassnode market report January 2026
a short on-chain and macro check to run before acting
run in under 10 minutes
If a central bank surprises markets it can tighten liquidity and reduce risk appetite, which often shows up first in correlated risk assets. Large exchange inflows can increase selling pressure and amplify volatility, while major regulatory news can change which venues or services are usable for traders
Common mistakes readers make when reading coin market data
One common error is treating short term noise as a trend. A single price spike or a headline-driven move can reverse quickly if volume is low or on-chain flows do not support it Glassnode market report January 2026
Another mistake is relying on a single source. Aggregators are fast for headlines but do not show wallet flows. On-chain providers show flows but require context. Using both plus a macro check reduces misreads
Scenarios: three realistic short term outcomes and what to watch next
Rotation and consolidation scenario – signals: aggregator shows small net market cap change with several top movers offsetting each other, on-chain shows mixed inflows and outflows, and macro headlines are quiet. Check: exchange flows and volume confirmation to see if moves are durable CoinMarketCap charts
Regulatory shock scenario – signals: a major ruling appears in headlines, aggregator shows sudden volume and dispersed moves across many coins, on-chain shows large outflows to exchanges. Check: official regulatory statements and exchange flow reports for confirmation Chainalysis 2024 crypto crime report
Macro driven risk on or off scenario – signals: central bank guidance shifts expectations, risk assets move in sync with crypto, and on-chain flows show either accumulation or distribution depending on liquidity. Check: central bank releases and cross asset correlations before assuming direction IMF Global Financial Stability Report
Practical example: reading a market wrap and an on chain chart step by step
Example 1: aggregator snapshot walkthrough. Step 1, note total market cap and compare to 24h volume. Step 2, open top movers and see if one coin is driving most gains. Step 3, look for volume confirmation – if large volume backs the move it is more credible. Conclude whether the move looks like rotation or a broad market move by checking dominance and dispersion CoinDesk market wrap and see a recent Bitcoin price analysis on Finance Police
Example 2: on chain indicator walkthrough. Step 1, pick an accumulation metric or exchange inflow chart. Step 2, see whether large addresses are moving coins to exchanges or to cold wallets. Step 3, combine that with volume and a macro headline to decide which scenario the pattern matches
A decision checklist for everyday observers and cautious participants
Observe: scan aggregator for cap and volume. Verify: run the on-chain check and scan for a macro or regulatory headline. Decide: if all three sources point the same way, you may consider action that fits your risk tolerance; otherwise monitor until signals align IMF Global Financial Stability Report
Use simple thresholds to trigger verification, for example unusually high volume or a regulatory headline. If you suspect a misread, pause and re-check the three sources before changing positions
How crime, compliance, and exchange flows affect market liquidity
Chainalysis found that some crypto crime measures moderated in 2024, but compliance and enforcement still shape how money moves and can affect liquidity when rules or enforcement change Chainalysis 2024 crypto crime report
Large exchange inflows can increase available supply for sale and reduce price resilience, while outflows to cold storage often tighten available liquidity. Watching exchange flow reports helps you see whether price moves are likely to be sustained or amplified Glassnode market report January 2026
Using market wraps and news coverage without overreacting
Market wraps are useful for situational awareness and for spotting top movers and breaking headlines. Treat them as a signal to run your three source check, not as a reason to act immediately CoinDesk market wrap
A quick verification habit works: check aggregator numbers, confirm with one on-chain metric, and look for a macro or regulatory mention. If those three do not align, wait for clearer confirmation
Summary and practical next steps for watching the coins market
Recap: use the three source checklist to reduce blind spots – aggregator for scale and movers, on-chain for flows and accumulation, macro or regulatory headlines for liquidity shifts. This combination is concise and helps you separate rotation from structural moves CoinMarketCap charts
3 next steps you can do in the next 24 to 72 hours: 1. Run the five step workflow on one aggregator and one on-chain chart. 2. Note any macro or regulatory headlines that could change liquidity. 3. Save a short note on what confirmed and what did not. Remember that uncertainty remains and verify details with primary sources before acting. Find more guides on Finance Police
Check total market cap, 24h trading volume, BTC or ETH dominance, and the top gainers and losers on an aggregator. Then verify with one on-chain metric and a macro or regulatory headline.
On-chain indicators show wallet flows and accumulation signals that can explain whether price moves are supported by real transfers, which helps distinguish short-term noise from sustained moves.
No. Use a market wrap to spot a signal, then verify numbers on an aggregator, check one on-chain indicator, and scan macro or regulatory news before deciding.
If you want ongoing situational awareness, set simple alerts for the thresholds that matter to you and revisit the checklist when a headline or large flow event appears.
References
- https://coinmarketcap.com/charts/
- https://www.coingecko.com/en/global_charts
- https://www.coindesk.com/markets/2026/01/28/crypto-market-wrap-january-28-2026/
- https://insights.glassnode.com/market-report-january-2026/
- https://www.imf.org/en/Publications/GFSR/Issues/2024/10/10/global-financial-stability-report-october-2024
- https://blog.chainalysis.com/reports/2024-crypto-crime-report/
- https://financepolice.com/advertise/
- https://glassnode.com/
- https://coinmarketcap.com/
- https://www.coinglass.com/
- https://financepolice.com/category/crypto/
- https://financepolice.com/bitcoin-price-analysis-btc-slips-below-90000-as-leveraged-liquidations-rock-market/
- https://financepolice.com/
0
0

 Manage all your crypto, NFT and DeFi from one place
Securely connect the portfolio you’re using to start.

0
0

0
0

0
0
