Analyzing Bitcoin: You may have been using the wrong metric all along
3y ago
bullish:
1
bearish:
0
Share

At the time of writing, Bitcoin was trading at $18,092, having recovered from a dip that took it below the crucial level. If BTC does close above $18,000, it will have done so for 2 days in a row, with it being 4 days since the price first crossed $18,000 since the heyday of the bull run.
In light of Bitcoin's performances, on-chain analysts are tracking metrics like the supply of Bitcoin to exchanges, spot exchange reserves, and the number of active addresses. However, while tracking the number of active addresses signals rising demand, it may or may not imply active participation from retail traders.
Even with a million active addresses, if the balance is lower than 0.1 Bitcoin, the data fed to the metric may be insufficient for predicting price movements. Ergo, the number of active addresses holding 1K+ coins is a better metric, relative to the former. While addresses holding 10k+ coins are labeled whales and are mostly mining pools, institutions, or exchange wallets, the 1k+ coins metric is reliable for predicting price movements.
The number of active addresses with a balance above 1k gives a clear picture of traders' sentiment and the direction in which the price may move next. Besides, on exchanges with relatively average volume, traders owning wallets with 1k+ Bitcoin are more active in determining the cryptocurrency's price.
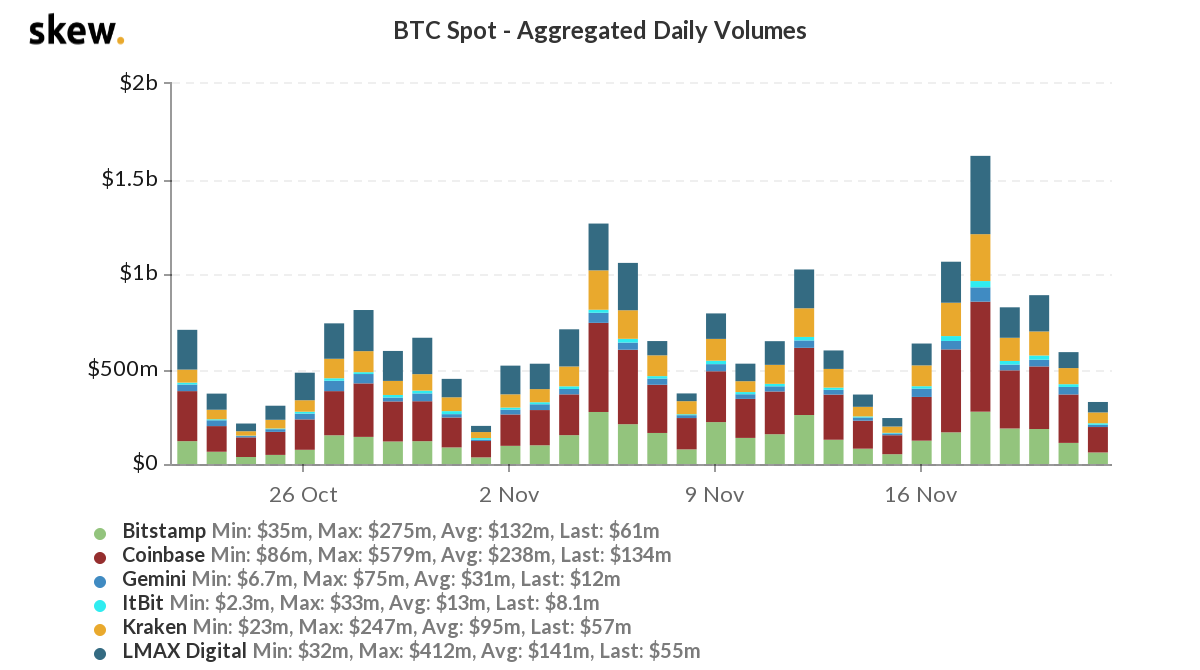
The spot exchange volume on top exchanges, based on data from Skew, is shown in the following chart,
BTC spot exchange volumes || Source: Skew
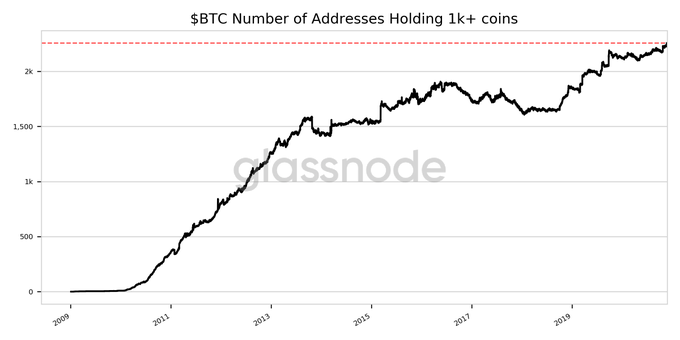
While exchange volumes have been below $500M since 20 November 2020, addresses holding 1k+ coins hit an ATH of 2257 just recently, a development that gives a clearer picture of accumulation on the charts.
BTC Addresses Holding 1k+ coins || Source: Glassnode
Most wallets with a balance above 1k BTC can possibly be miners, and miners are known to sell mined BTC to cover operations costs. However, of late, enough has been said about HODLing in the mining community. This metric indicates that the price of Bitcoin may continue to climb north in the short-run.
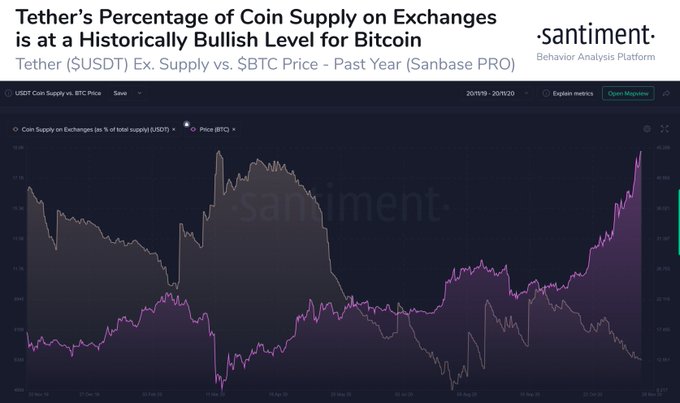
Another metric supporting this is Tether's supply on exchanges by Santiment. The last time the percentage of Tether's supply on exchanges rapidly climbed to the current level was back in July 2020. In the two weeks following the same, the price surged by 28%.
The price of $BTC is observed to be foreshadowed by USDT supply on exchanges and currently, the USDT supply is down by 13%. The 2020 high was 44.84% in mid-March, and a nearly 50% drop in Bitcoin’s price followed to become what we know today as Black Thursday.
Tether’s supply on exchanges || Source: Santiment
Simply put, this metric supports on-chain analysts’ predictions and the conclusion from the number of active addresses holding 1k+ Bitcoins. What is the prediction? Well, it is bullish for Bitcoin, at least in the short-term.
The post Analyzing Bitcoin: You may have been using the wrong metric all along appeared first on AMBCrypto.
3y ago
bullish:
1
bearish:
0
Share


 Manage all your crypto, NFT and DeFi from one place
Securely connect the portfolio you’re using to start.

bullish:
0
bearish:
0

bullish:
0
bearish:
0

bullish:
0
bearish:
0
