
Pepe Price Prediction 2026: Is PEPE Ready for Another Breakout?

0
0

A quiet chart can still hide a story. This one does.
PEPE spent most of 2026 stuck inside a falling channel, and a recent breakout above it has already started fading. The Pepe Price Prediction Today picture is less about a big move and more about whether that breakout holds.
And that's the part most headlines skip.
Why Is Pepe (PEPE) Price Moving Today?
Nothing dramatic happened. That's kind of the point.
PEPE trades near $0.0000034 as of September 13, 2026, near 14:55 UTC, down slightly across the day, per TradingView chart data. Twenty-four-hour volume dropped 53.58% against the prior session, per CoinMarketCap data.
There's no fresh catalyst driving this. It's cooling off after an earlier spike, not building toward one.
Pepe Market Snapshot
Market cap sits near $1.39 billion. Fully diluted valuation matches it almost exactly, since supply is already 100% circulating.
Circulating and max supply both read 413.77 trillion PEPE. Holder count stands at 587,300 addresses, with a profile score of 57%.
Volume-to-market-cap sits at 9.42%, and liquidity-to-market-cap reads 2.06%. Any honest PEPE crypto forecast has to note that thin liquidity ratio before calling this coin stable.
Pepe Technical Analysis: RSI Signals Neutral Momentum
Price broke above a long descending channel earlier this month, spiking to a high of $0.00000726 before sliding back. It now trades just above its 50-period EMA near $0.00000330.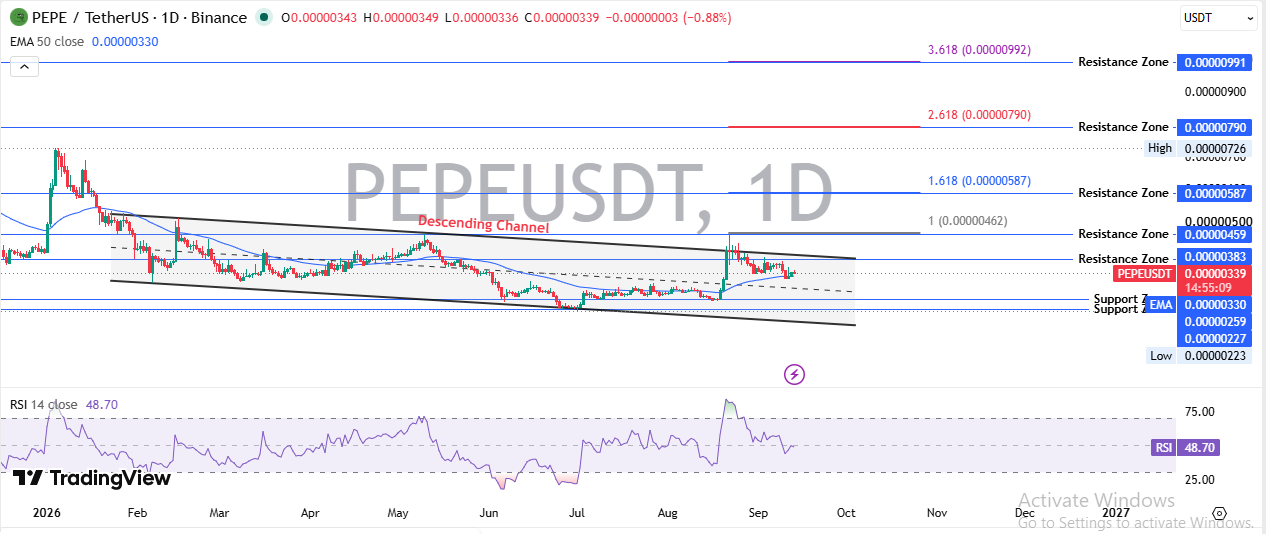
Not overbought. Not oversold either.
RSI sits at 48.70 on the daily chart, dead center of neutral. Here's the thing: a breakout that cools this fast, this close to its own average, hasn't proven much yet.
It looked like a trend change at first. It might just be a bounce.
Pepe Support and Resistance Levels
Support zones stack at $0.00000330, $0.00000259, and $0.00000227, with the recent low at $0.00000223. Lose the first level and the next two come into play fast.
Fibonacci extensions place resistance at $0.00000587, $0.00000790, and $0.00000992. Turns out, most Pepe Price Prediction 2026 setups hinge on reclaiming that first resistance band.
Fail there and the channel breakout stops mattering.
Pepe Circulating Supply and Holder Data
Supply here isn't the risk it is for some coins. All 413.77 trillion PEPE tokens are already circulating, so there's no future unlock hanging over price.
That removes one entire category of risk. But it doesn't remove concentration risk, and that one's real.
Whale and Exchange Wallet Concentration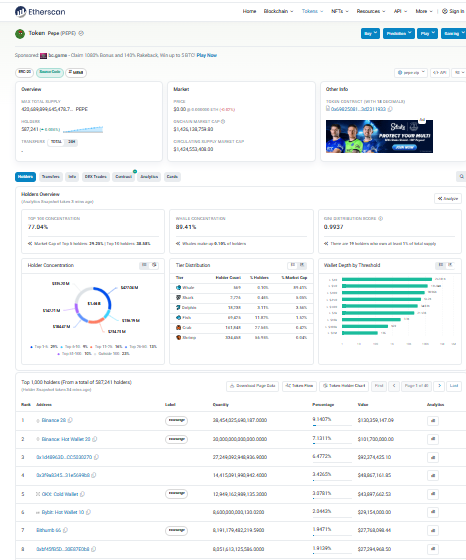
Etherscan data shows the top 10 wallets hold 77.04% of supply, and wallets classified as whales control 89.41%, per Etherscan holder tracking. The distribution score reads 0.9937, about as concentrated as it gets.
Binance's main wallet leads with roughly 9.14% of supply. The Uniswap V2 liquidity pool holds close to 7.13%, with OKX's cold wallet and a handful of unlabeled addresses rounding out the rest of the top ten.
Basically, exchanges and one DEX pool control most of the float that matters.
Pepe Liquidation Data: Breaking Numbers
Twenty-four-hour liquidations hit $63.87K.
Shorts took more damage. $41.60K was wiped out there against $22.27K on longs.
Twelve-hour liquidations read $53.66K. One-hour liquidations sit at just $13.47K, per Coinglass tracking.
Small numbers. Nothing here screams forced selling.
Exchange and Futures Volume Activity
MEXC and OKX lead futures volume at $69.84 million and $68.94 million. Bitget, LBank, and KuCoin trail well behind them.
And that heavy futures presence on just two exchanges means price can still swing fast if funding flips. Smaller venues like Gate and Bitunix add extra volatility risk on thin books.
Pepe Price Prediction 2026: Bull, Base and Bear Case
This PEPE Price Prediction table ties targets to the chart's own Fibonacci resistance and support levels.
Timeframe | Bear Case | Base Case | Bull Case |
7 Days | $0.0000023 | $0.0000030 to $0.0000040 | $0.0000059 |
30 Days | $0.0000020 | $0.0000028 to $0.0000045 | $0.0000079 |
Long Term | $0.0000015 | $0.0000035 to $0.0000070 | $0.0000099 |
Any serious Pepe Price Forecast 2026 has to treat that first resistance band as the real test, not the recent spike high.
Key Risks to Watch
Thin liquidity relative to market cap means moves can overshoot in either direction. Whale concentration near 90% adds a second layer of that same risk.
Volume fell over half in a day. That's not a healthy sign for a breakout trying to hold.
But RSI at 48.70 gives this some room to move before it gets stretched.
Market Sentiment and Outlook
Where does momentum go from a neutral RSI and fading volume?
Nowhere fast, most likely. This reads like consolidation, not confirmation, a pattern also flagged across recent Pepe coverage.
And a coin with a full supply already unlocked, heavy whale control, and cooling volume tends to drift until something forces a decision. Related setups get tracked in ongoing price prediction rounds too.
Disclaimer
This article is for informational purposes only and doesn't constitute financial, investment, or trading advice. Crypto markets are highly volatile, and prices can shift within minutes.
Independent research and advice from a licensed financial advisor is recommended before any decision. Data here was captured on September 13, 2026, near 14:55 UTC, and may no longer be current at the time of reading.
0
0

 从同一位置管理所有加密资产、NFT 和 DeFi 资产
安全地关联您正在使用的投资组合,以开始交易。


