
0
0

Key takeaways:
Polkadot (DOT) has shown impressive growth and resilience in a volatile cryptocurrency market, supported by its strong multichain protocol architecture and investor confidence. A major contributor to this success is the Sinai Upgrade on its Acala Network, enhancing functionality and security.
With over 32 million transactions validated in October 2024 by the Polkadot Relay Chain, the network demonstrates significant activity and utility. A notable increase in unique wallets further signals growing user adoption and engagement, strengthening Polkadot’s position as a leading blockchain platform.
Will DOT reach new heights soon? Let’s get into the Polkadot price prediction for 2025-2031.
| Cryptocurrency | Polkadot |
| Token | DOT |
| Price | $4.72 |
| Market Cap | $7.28B |
| Trading Volume | $536M |
| Circulating Supply | 1.54B DOT |
| All-time High | $55.00 Nov 4, 2021 |
| All-time Low | $2.69 Aug 19, 2020 |
| 24-hour High | $5.28 |
| 24-hour Low | $4.51 |
| Volatility | 9.48% |
| 50-Day SMA | $ 6.90 |
| 14-Day RSI | 34.91 |
| Sentiment | Bearish |
| Fear & Greed Index | 72 (Greed) |
| Green Days | 15/30 (50%) |
| 200-Day SMA | $5.89 |
Key takeaways
Polkadot price analysis on February 20th shows DOT is trading at $5.04, reflecting a 3.32% increase over the past 24 hours. Despite this recent uptick, DOT remains under pressure from its broader downtrend that began in early February. Polkadot’s market cap stands at $7.82B, with a notable surge in 24-hour trading volume to $202.74M—a 24.35% increase, highlighting renewed market participation. This resurgence in volume and social engagement suggests traders closely watch key support and resistance levels for potential breakouts or breakdowns.
Polkadot’s $3.74 support level has emerged as a crucial price zone. Historically, this level has attracted strong buying interest, often leading to sharp reversals. Traders are eyeing this area to determine if DOT can stage a recovery or continue its downward trajectory. On the upside, resistance zones are forming at $5.25 and $6.50, which, if breached, could pave the way for further gains. Open Interest for Polkadot has climbed by 1.68% to $316.51M, signaling that traders are positioning for a significant price move. Additionally, the long/short ratio of 50.95% indicates a slightly bullish bias, though caution remains due to lingering bearish pressure.
Polkadot is facing critical technical levels on a daily timeframe. The price is currently hovering below the 50-day SMA at $5.635 and the 100-day SMA at $5.999, both acting as strong resistance barriers. A daily close above $5.25 could confirm a short-term bullish reversal, opening the path toward the $6.50 resistance zone. However, failure to break above these moving averages may result in continued selling pressure. The 200-day SMA at $6.918 remains a key long-term resistance level that bulls need to reclaim for sustained upside momentum.

The Relative Strength Index (RSI) on the daily chart is at 43.98, indicating a recovery from oversold territory but still lacking strong bullish conviction. The RSI suggests there’s room for further upside, but buyers must show stronger momentum to overcome overhead resistance. If DOT fails to maintain its current levels, immediate support lies at $4.50, with the critical $3.74 support just below. A break beneath $3.74 could expose the price to further downside risk toward the $3.50 area.
On the 4-hour chart, Polkadot is attempting a recovery after bouncing from recent lows near $4.60. The MACD has formed a bullish crossover, with the MACD line rising above the signal line, reflecting growing short-term bullish momentum. The histogram bars have turned green, suggesting increasing buying pressure. Despite this positive momentum, the price faces strong resistance at $5.25. A successful breakout above this level could extend gains toward $5.50 and potentially $5.80.

Meanwhile, the RSI on the 4-hour timeframe stands at 59.84, approaching overbought conditions. This indicates that while momentum is bullish, there may be limited upside in the immediate term unless buyers push through resistance levels decisively. Failure to break above $5.25 could result in a pullback toward $4.85 and $4.60. These support zones will be critical for maintaining bullish momentum in the short term.
Polkadot is at a pivotal juncture as it navigates between key support and resistance levels. Holding above the $3.74 support is essential for any sustainable recovery, with upside targets at $5.25 and $6.50 if momentum strengthens. On the flip side, a break below $3.74 could accelerate losses toward $3.50. Traders should closely monitor price action around these critical zones, with rising Open Interest and social engagement suggesting increased volatility in the days ahead.
| Period | Value ($) | Action |
| SMA 3 | $ 5.76 | SELL |
| SMA 5 | $ 5.96 | SELL |
| SMA 10 | $ 6.16 | SELL |
| SMA 21 | $ 6.43 | SELL |
| SMA 50 | $ 6.90 | SELL |
| SMA 100 | $ 6.80 | SELL |
| SMA 200 | $ 5.89 | SELL |
| Period | Value ($) | Action |
| EMA 3 | $ 6.25 | SELL |
| EMA 5 | $ 6.42 | SELL |
| EMA 10 | $ 6.67 | SELL |
| EMA 21 | $ 6.99 | SELL |
| EMA 50 | $ 7.17 | SELL |
| EMA 100 | $ 6.74 | SELL |
| EMA 200 | $ 6.34 | SELL |
Investing in Polkadot offers advantages for those interested in advanced blockchain solutions. Its multi-chain framework enables interoperability and scalability through its innovative relay chain and parachain architecture, improving transaction efficiency. The platform’s para-chain slot auction system allows democratic participation, and holding DOT tokens grants governance rights, giving investors a voice in the network’s future. These features make Polkadot a strategic addition for investors looking to capitalize on cutting-edge blockchain technology and the potential for future digital transformation.
Polkadot (DOT) shows signs of recovery with a recent upward trend. If positive market conditions continue, Polkadot has the potential for further recovery.
Yes, according to the long-term predictions, Polkadot is projected to reach up to $10 by 2027.
Reaching $100 for Polkadot (DOT) is highly ambitious and unlikely in the near term.
Based on the recent upward movement of DOT, Polkadot has a promising long-term future.
Digital asset manager 21Shares submitted a filing with the U.S. Securities and Exchange Commission (SEC) last week for a Spot Polkadot ETF, sparking optimism among DOT investors who anticipate a potential influx of institutional capital.
Polkadot is set to join the Consensus HK conference in Hong Kong on February 19-20, where it will present its latest development plans. Created by Ethereum co-founder Dr. Gavin Wood, Polkadot is an open-source blockchain network designed to enhance security, scalability, and cross-chain connectivity.
Polkadot (DOT) is expected to exhibit a range of price movements in February 2025. The potential low is $3.94, while the average price might be around $4.36. On the higher end, DOT could reach up to $4.48.
| Month | Potential Low | Potential Average | Potential High |
| February | $3.94 | $4.36 | $4.48 |
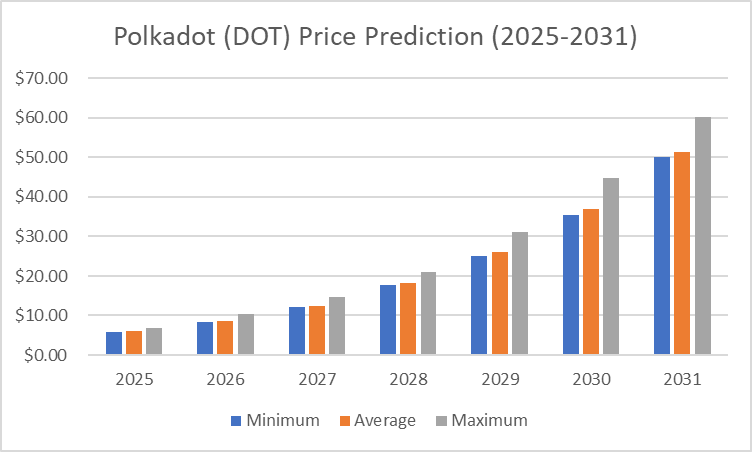
DOT price prediction in 2025 expects DOT to have a minimum value of $5.53 and a maximum value of $6.91. The coin’s average value could be around $5.74.
| Polkadot Price Prediction | Potential Low | Potential Average | Potential High |
| 2025 | $5.53 | $5.74 | $6.91 |
| Year | Minimum Price | Average Price | Maximum Price |
| 2026 | $7.66 | $7.94 | $9.51 |
| 2027 | $11.34 | $11.65 | $13.52 |
| 2028 | $17.54 | $18.12 | $19.71 |
| 2029 | $25.87 | $26.59 | $30.01 |
| 2030 | $36.19 | $37.52 | $44.20 |
| 2031 | $54.64 | $56.14 | $63.37 |
According to the Polkadot price forecast for 2026, DOT could reach a maximum price of $9.51, a minimum price of $7.66 in 2025, and an average forecast price of $7.94.
The price of Polkadot is predicted to reach a minimum value of $11.34 in 2027. Per expert analysis, DOT tokens could reach a maximum value of $13.52 and an average trading price of $11.65.
Per the DOT price prediction for 2028, Polkadot is predicted to reach a minimum price level of $17.54, a maximum price of $19.72, and an average trading price of $18.12.
The price of Polkadot is predicted to reach a minimum value of $25.87 in 2029. Traders can anticipate a maximum value of $30.01 and an average trading price of $26.59.
According to the Polkadot price prediction for 2030, DOT could reach a maximum price of $44.20, a minimum price of $36.19 in 2030, and an average forecast price of $37.52.
In 2031, the price of Polkadot is predicted to reach a minimum level of $54.64. Should positive market sentiment persist, DOT can attain a maximum price of $63.37 and an average trading price of $56.14.
| Firm Name | 2025 | 2026 |
| Gov.Capital | $8.20 | $11.56 |
| DigitalCoinPrice | $10.50 | $12.21 |
| Coincodex | $7.27 | $8.96 |
Per Cryptopolitan’s DOT price forecast, the coin’s price is projected to trend upward, reaching as high as $6.91 in 2025 and attempting to reclaim $63.37 by 2031.

Polkadot price history | Coinmarketcap
0
0
 Manage all your crypto, NFT and DeFi from one place
Securely connect the portfolio you’re using to start.

1
0

1
0

1
0


