
STABLE Price Rallies 20%, Here’s Why and Where It’s Going Next

0
0

STABLE (STABLE) rallied 14.6% on April 23 to trade at $0.02999, breaking weeks of tight consolidation with the strongest daily volatility reading since early February. The move coincided with a Relative Strength Index breakout on the daily chart.
The rally pushes the token toward the 0.382 Fibonacci retracement at $0.03059, a level that capped every bounce across March and April. A sustained close above that line would clear the path to the next resistance cluster.
Daily Chart Holds a Higher-Low Structure Above the 0.5 Fib
The daily chart frames a higher-timeframe structure that remains constructive. STABLE has printed a series of higher lows since its December bottom near $0.00914, along with three higher highs. The April 22 low at $0.02580 preserved that structure and sits directly on the 0.5 Fibonacci retracement at $0.02649.
Price now trades at $0.02999, just below the 0.382 Fibonacci level at $0.03059. That ceiling has rejected multiple rally attempts since March 7, making it the most important short-term resistance on the chart.
A daily close above $0.03059 would confirm continuation toward the 0.236 retracement at $0.03566 and the February 27 high near $0.0389.
Critical support sits at $0.02649. A break below that invalidates the current leg and exposes the 0.618 retracement at $0.02240. Other altcoins have stalled at equivalent retracement clusters this cycle, including ORDI at its own 0.382 level.
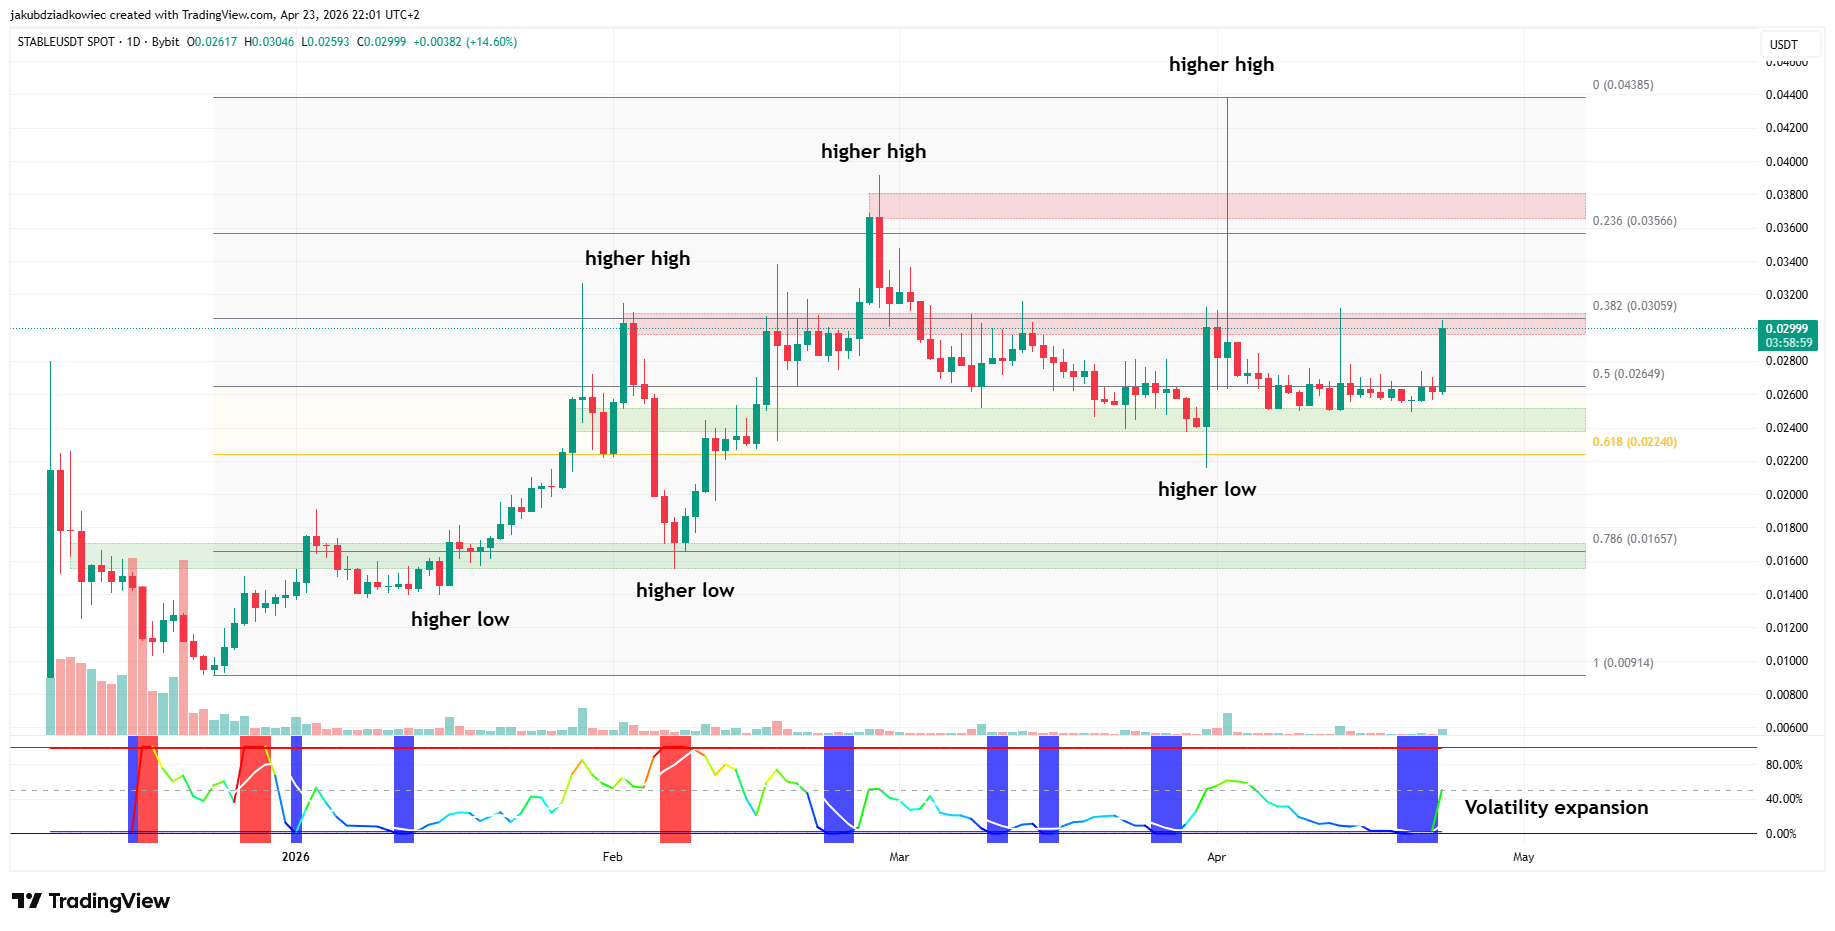 STABLE daily chart / Source: Tradingview
Daily RSI Breaks a Three-Month Resistance Line
The STABLE Relative Strength Index (RSI) finally pushed above a descending trendline that had capped every rally since late January. The indicator jumped from near 50 into the mid-60s on the April 23 candle. It was the first decisive move above 60 in more than 10 weeks.
The trendline originated at the RSI peak above 80 set in late January, just before STABLE printed its all-time high near $0.04385. Each subsequent rally stalled at progressively lower RSI readings, producing a steady sequence of lower highs that mirrored the price correction.
A clean break above this line often precedes a shift from distribution to accumulation. The reading still sits well below the overbought threshold at 70, leaving room for further upside before momentum exhausts itself. Similar momentum setups preceded the recent HBAR breakout attempt.
Momentum flips bearish only if RSI closes back below 50. That outcome would confirm a false breakout and hand control back to sellers.
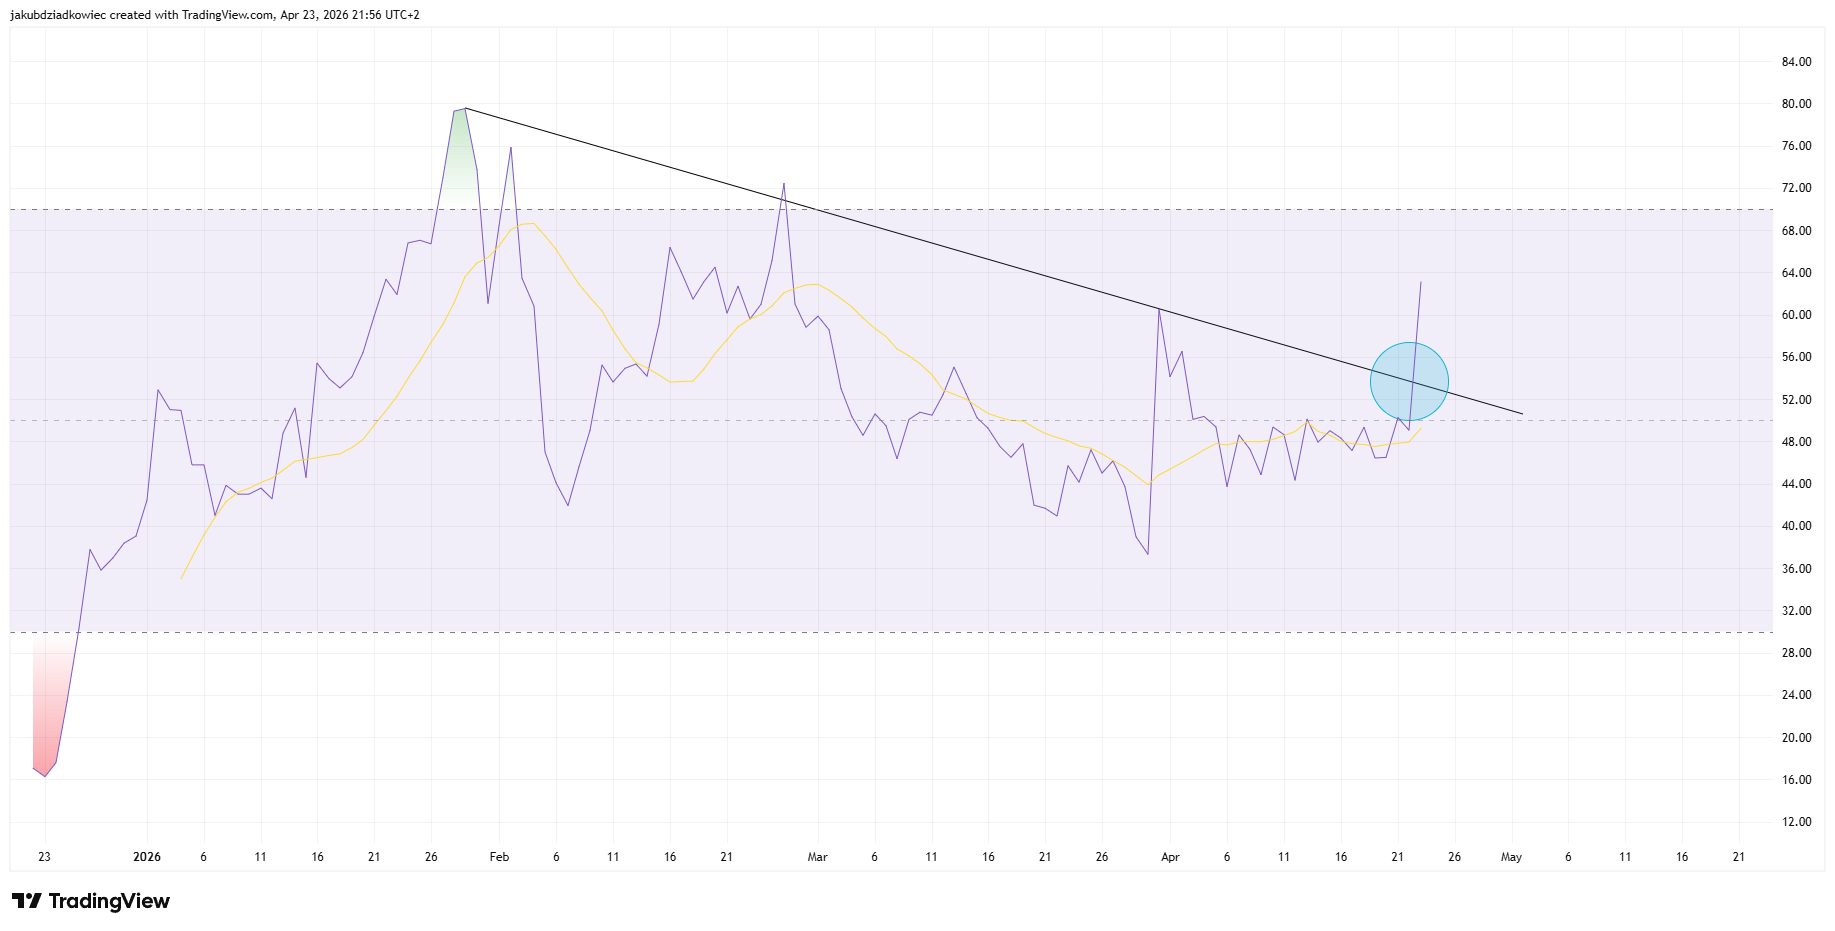 STABLE daily RSI chart / Source: Tradingview
STABLE Price Prediction Points to the $0.0367 W-Pattern Target
The 4-hour view delivers the clearest roadmap for the next move. STABLE carved out a rounded W pattern between April 2 and April 23, with the neckline near $0.03100. Price broke above the neckline on April 23 and stalled around $0.03003 by session close.
The measured move projects a $0.03673 target, roughly 22% above the April 22 low near $0.02580. That zone aligns with the 0.236 Fibonacci retracement at $0.03566, creating a dense resistance cluster between $0.03566 and $0.03673. Volume confirmed the breakout leg, printing the largest bullish candle in more than two weeks.
However, the token must first clear the 0.382 Fibonacci level at $0.03059 on the higher timeframe. A rejection from the $0.03059 to $0.03100 band would likely send STABLE back toward the 0.5 Fibonacci support at $0.02649. A recovery in broader Bitcoin strength would accelerate the upside.
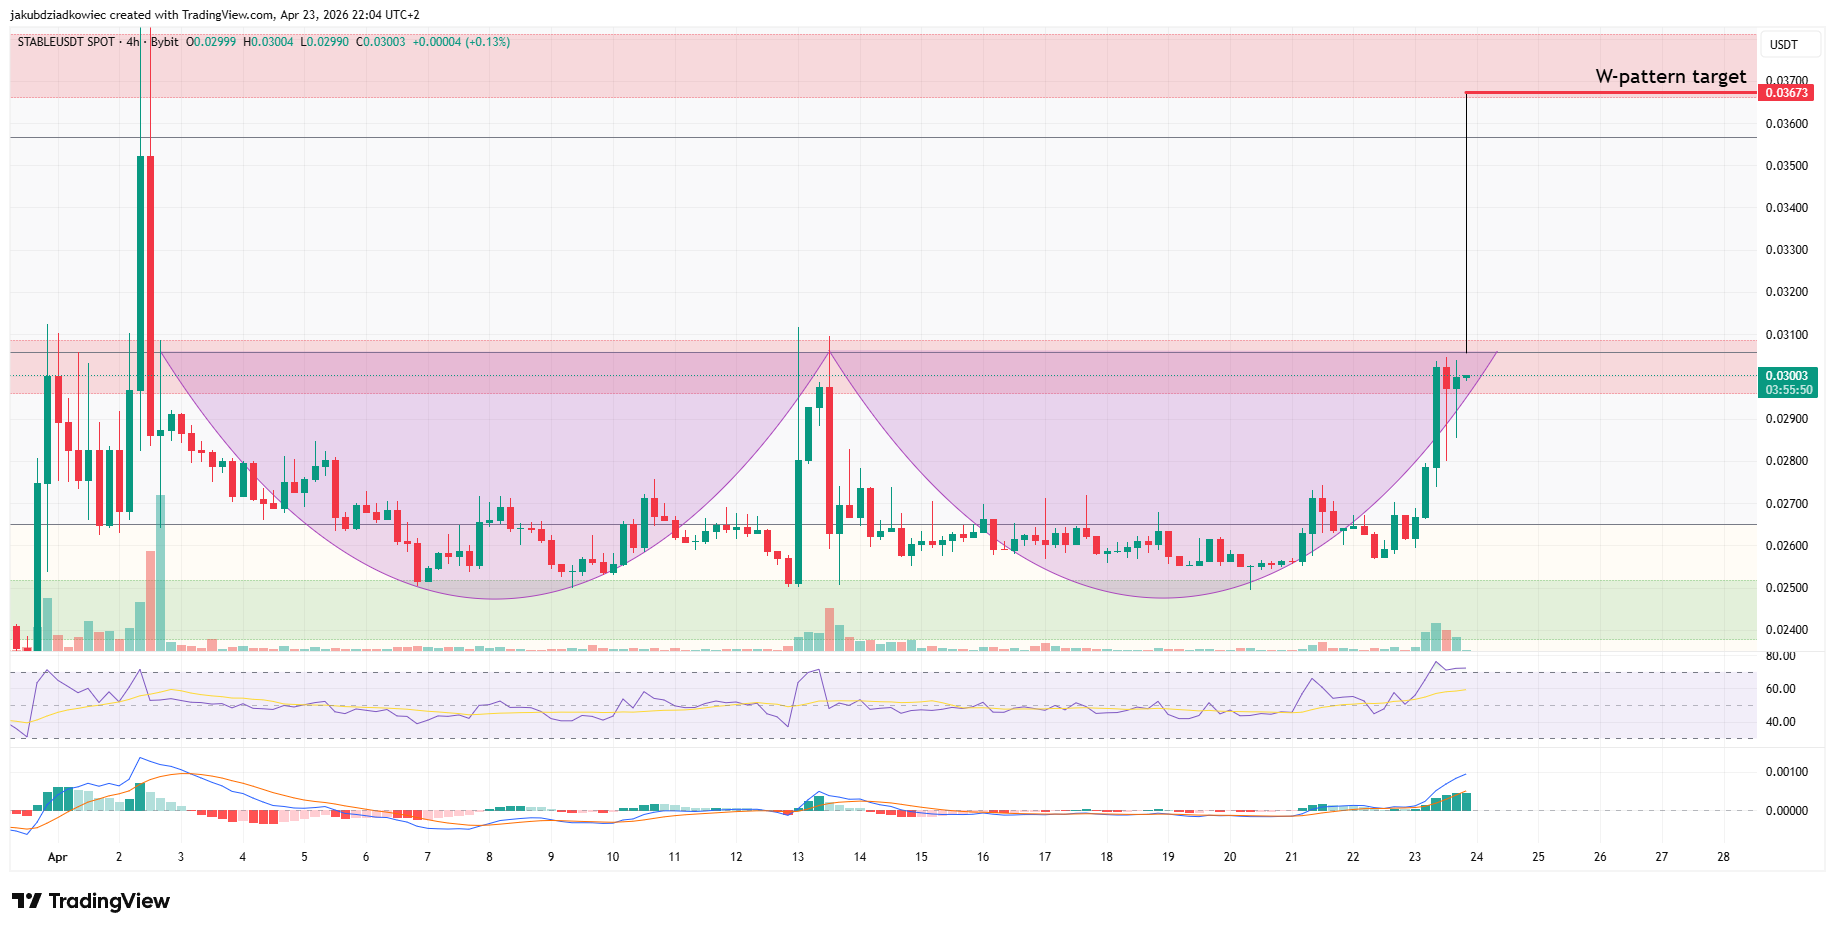 STABLE 4-hours chart / Source: Tradingview
The binary is clear. STABLE either clears $0.03059 and confirms a path to $0.03673, or fails and slides back into the mid-range.
0
0


 Manage all your crypto, NFT and DeFi from one place
Securely connect the portfolio you’re using to start.


