Bitcoin SV, NEM, Waves, Dogecoin Price Analysis: 13 April
3y ago
bullish:
16
bearish:
5
Share

Bitcoin SV could climb towards its local peak of $289, but additional volumes are needed for a break above this level. Both NEM and WAVES can be projected to move rangebound over the coming sessions, while DOGE could slip towards its $0.075-support before continuing its upwards trajectory.
Bitcoin SV [BSV]
Source: BSV/USD, TradingView
Bitcoin SV's bullish trend was more clear on the 1-hour timeframe as the price headed towards its $276.9-resistance. The Awesome Oscillator registered consecutive green bars and moved above the half-line. Backed by strong momentum, BSV was tipped to make the northbound ascension towards its local peak of $289.16.
The RSI formed higher highs and moved in tandem with the price. A reading of 63 showed a bullish strength at the said price level. The 24-hour trading volumes had also ticked up, at the time of writing, but more was needed to accumulate for a bigger price swing.
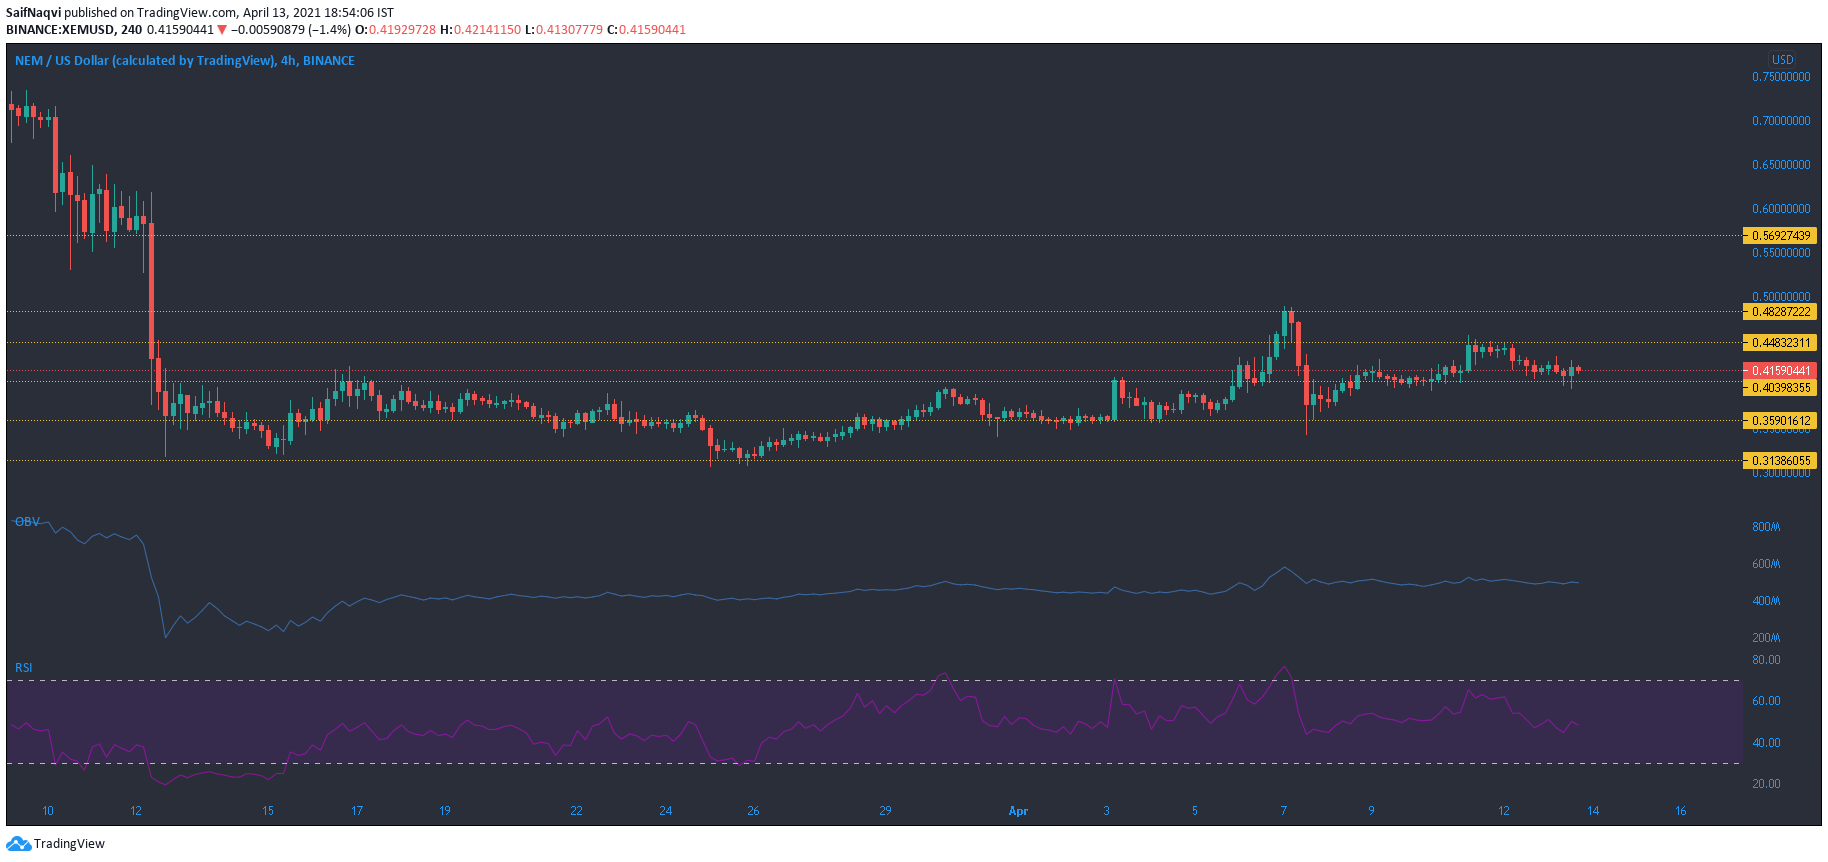
NEM [XEM]
Source: XEM/USD, TradingView
NEM's previous upswing was cut short at the $0.48-resistance and rangebound movement resumed on the 4-hour timeframe. This unearthed expectations of a recovery post an accumulation phase. An ADX reading of 13 showed a weak trend in the market, and the RSI remained neutral at 50.
However, the previous swing presented a target of $0.5 for the bulls. The long-term expectation was for a break above this level and a pickup in volumes could signal a switch away from the present channel of $0.448-$0.403.
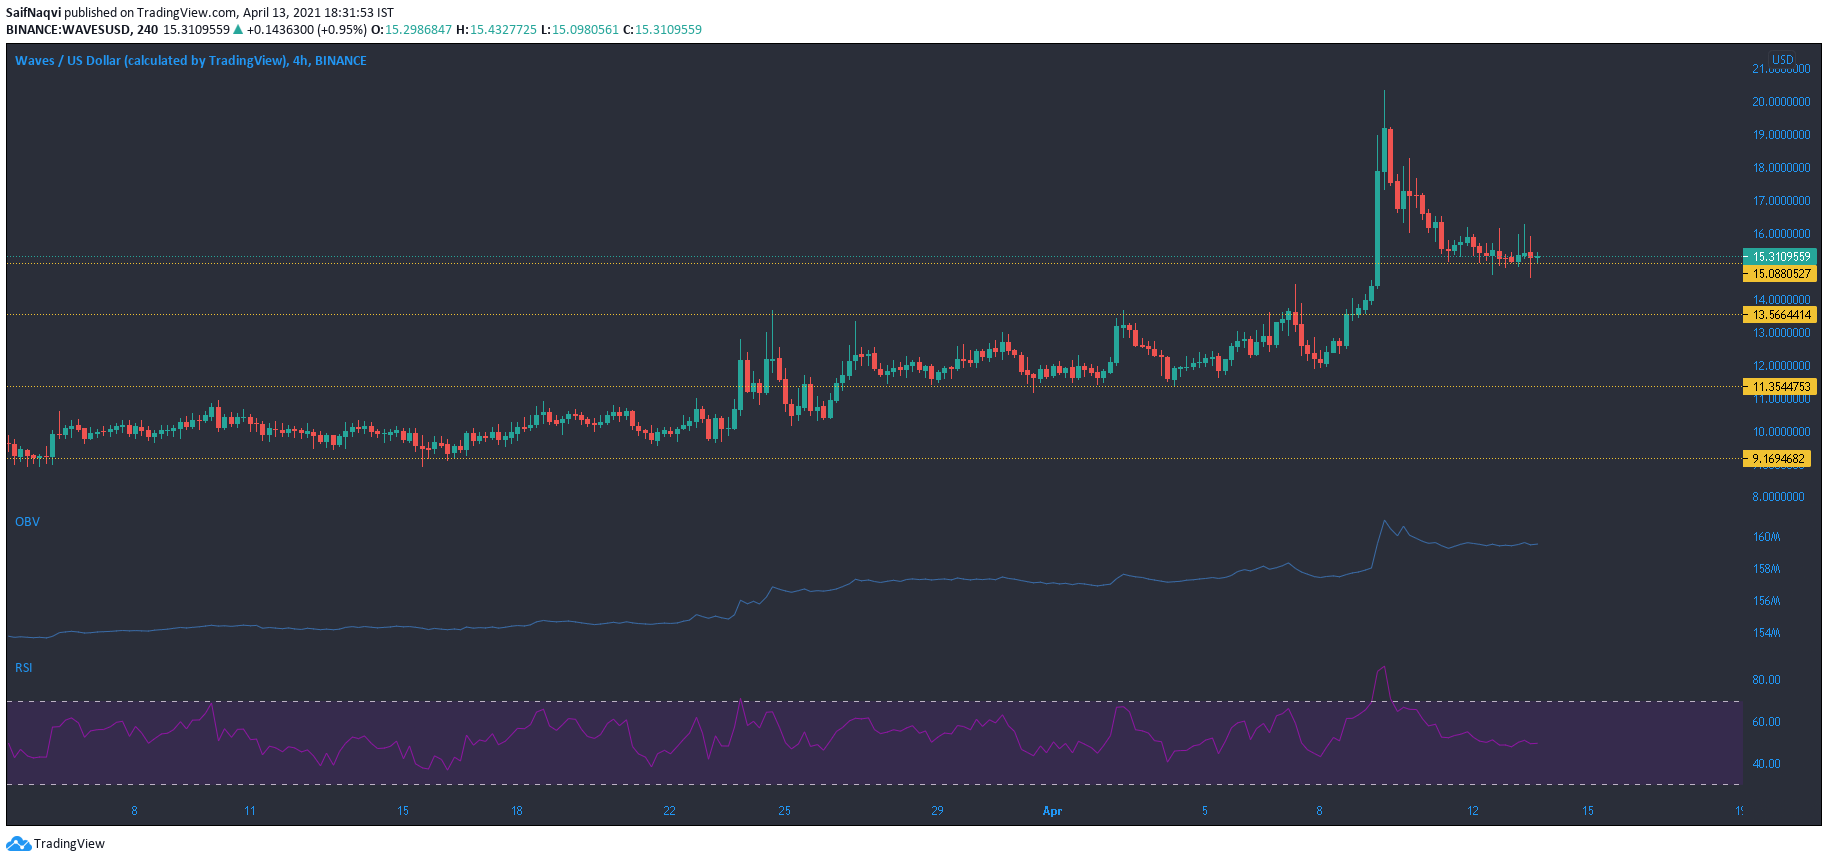
Waves [WAVES]
Source: WAVES/USD, TradingView
Waves pictured strong bullish movement on the 4-hour timeframe after the price broke north of the $13.5-resistance. Interestingly, a move above the aforementioned level up to the rally's peak represented gains of over 50%. Strong volumes were also seen during those days but since then, trading activity has been quiet across the market. As a result, the price moved south over the past few days and found support at a little above the $15-level.
The OBV held steady at higher levels and the threat of a further breakdown was low. The RSI reflected a neutral market after it settled at 50. Moving forward, some rangebound movement can be expected before the next upswing.
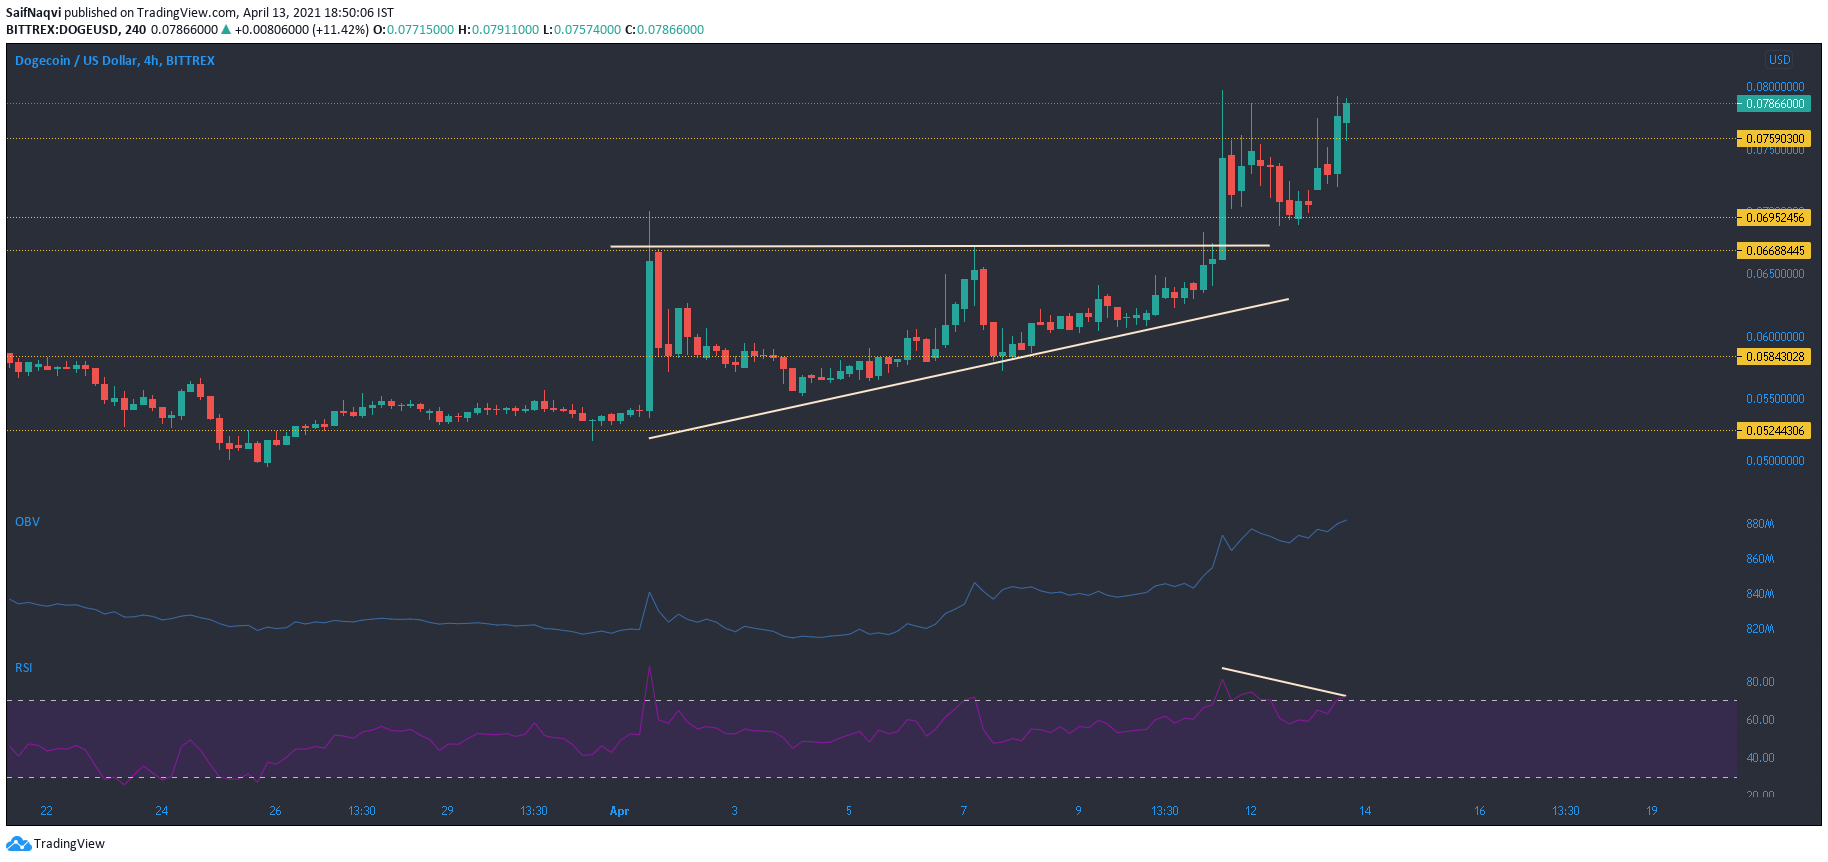
Dogecoin [DOGE]
Source: DOGE/USD, TradingView
A breakout from an ascending triangle allowed Dogecoin to finally break above the $0.066-level, but gains capped another barrier at $0.075. The OBV suggested that strong buying pressure pushed DOGE above this level, but it was unlikely that the bulls could sustain the price moving forward.
This was largely due to a bearish divergence spotted on the RSI. The index also reversed from the overbought region and DOGE could test the $0.069-support in case of a southbound move. However, with Bitcoin trading above $60K, the DOGE market still reflected a bullish mid-long term outlook and minor dips are expected to be easily negotiated by the buyers.
The post Bitcoin SV, NEM, Waves, Dogecoin Price Analysis: 13 April appeared first on AMBCrypto.
3y ago
bullish:
16
bearish:
5
Share


 Manage all your crypto, NFT and DeFi from one place
Securely connect the portfolio you’re using to start.

bullish:
0
bearish:
0

bullish:
0
bearish:
0

bullish:
0
bearish:
0
