
Stellar Price Prediction: Can XLM Rally 159% From CMP?

0
0
Stellar price prediction interest is climbing again as XLM sits at a pressure point traders have been tracking for months.
The coin has spent this year carving out a tightening chart pattern, the kind that usually resolves with a decisive move instead of another quiet drift.
A fresh liquidation update, a striking real-world-asset growth headline, and a chart structure nearing its apex all landed within the same day, giving this setup more weight than a routine daily check-in.
The view below is a short-term technical read based on the daily chart, not a multi-month or long-term forecast.
Stellar Price Prediction Today: Market Snapshot and Live Data
XLM is trading near $0.15459 on the Binance perpetual chart.
CoinGlass's live feed shows a close $0.15473 reading, down 2.23% over the past 24 hours, a small gap that reflects feed timing rather than a real divergence.
Futures volume over the last day sits at $93.22 million against spot volume of $22.70 million.
Open interest, the total value of outstanding derivative contracts still open on the exchange, stands at $177.10 million.
Market cap is $5.34 billion, and circulating supply is 34.54 billion XLM out of a 50 billion max supply.
Heavier futures activity relative to spot volume points to a market currently more sensitive to leveraged positioning than to organic spot demand.
Source: CoinGlass live market data, August 18, 2026.
Stellar Price Prediction Snapshot: Key Levels at a Glance
CMP (current market price, the live traded price at analysis time): $0.15459, Binance XLM/USDT Perpetual, 1D chart
Bullish trigger: daily close above $0.20025, the falling wedge breakout confirmation level
Bearish trigger: daily close below $0.13584
24-hour change: -2.23% (CoinGlass data feed)
Data captured: August 18, 2026, around 11:12 AM IST
Methodology and Data Sources for This XLM Technical Analysis
This forecast uses the daily Stellar/USDT Perpetual chart on Binance, viewed through TradingView.
The built-in momentum panel on this chart currently carries a Bear tag with a reading of 30.25, and that specific reading is referenced below rather than a calculated indicator.
Target levels are not arbitrary projections. They come directly from prior marked swing highs and swing lows on the same chart: $0.20025, $0.25144, $0.29802, and $0.40040 on the upside, and $0.13584 and $0.12244 on the downside.
The forecast horizon here is short-term and will be revisited if the price closes decisively beyond either trigger level.
Liquidation figures are sourced from CoinGlass, price and volume data from CoinGlass's live market snapshot, and ecosystem news from a public X post, each cited with its own date below.
XLM Liquidation Data: Long-Side and Short-Side Positions Explained
A liquidation is the forced closure of a leveraged position once losses exceed the trader's margin, and this typically happens on perpetual futures, contracts with no expiry date that traders use to hold leveraged positions.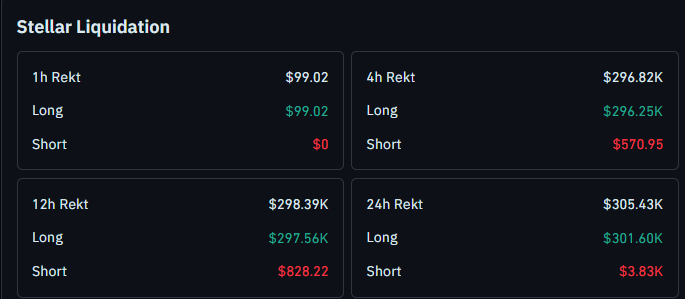
CoinGlass data shows a one-sided pattern here.
Over the last hour, $99.02 was liquidated, and all of it was long-side. The 4-hour window shows $296.82K in total liquidations, with $296.25K long-side and $570.95 short-side.
The 12-hour window shows $298.39K, again almost entirely long-side, and the 24-hour window shows $305.43K, with $301.60K long-side against $3.83K short-side.
This concentration of long-side liquidations across every timeframe indicates that leveraged buyers were repeatedly stopped out as price declined, consistent with the negative 24-hour close.
Short positions saw comparatively minimal liquidations.
That does not yet point to a short squeeze, but it does suggest the recent decline was driven more by forced long exits than by fresh short selling.
Source: CoinGlass liquidation data , August 18, 2026.
XLM ETF News and Ecosystem Update: Stellar's RWA Growth Data
No active XLM ETF filing news is available at this time, so there is nothing to report on that front today.
What is available is a notable real-world-asset growth update.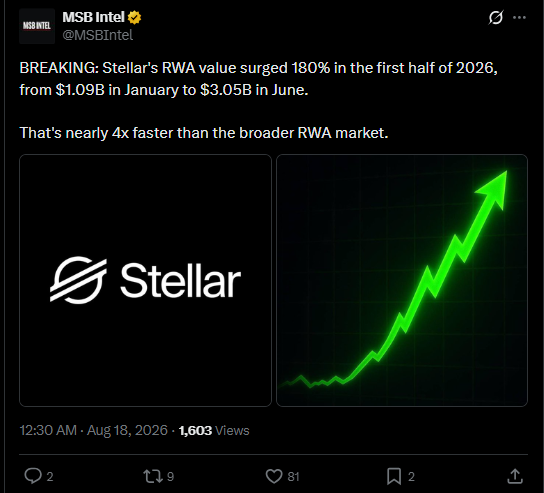
A post from MSB Intel (@MSBIntel) on X, shared August 18, 2026, at 12:30 AM, stated that Stellar's RWA value, meaning tokenized traditional assets such as bonds or credit held on its blockchain, rose 180% in the first half of 2026, from $1.09 billion in January to $3.05 billion in June.
The post described that growth as nearly four times faster than the broader RWA market.
In the short term, this kind of adoption data rarely moves price on its own since it is a structural, quarter-over-quarter metric rather than a live catalyst.
In the long term, it reinforces Stellar's positioning as an infrastructure chain.
for tokenized assets, a growth narrative that sits independently of any single day's chart move.
Source: X post by @MSBIntel, August 18, 2026, 12:30 AM.
XLM Technical Analysis: Structure and Breakout Levels Explained
A falling wedge is a converging chart pattern formed by two downward-sloping trendlines, and it is often watched for a potential upside reversal once price confirms a breakout close above the upper line.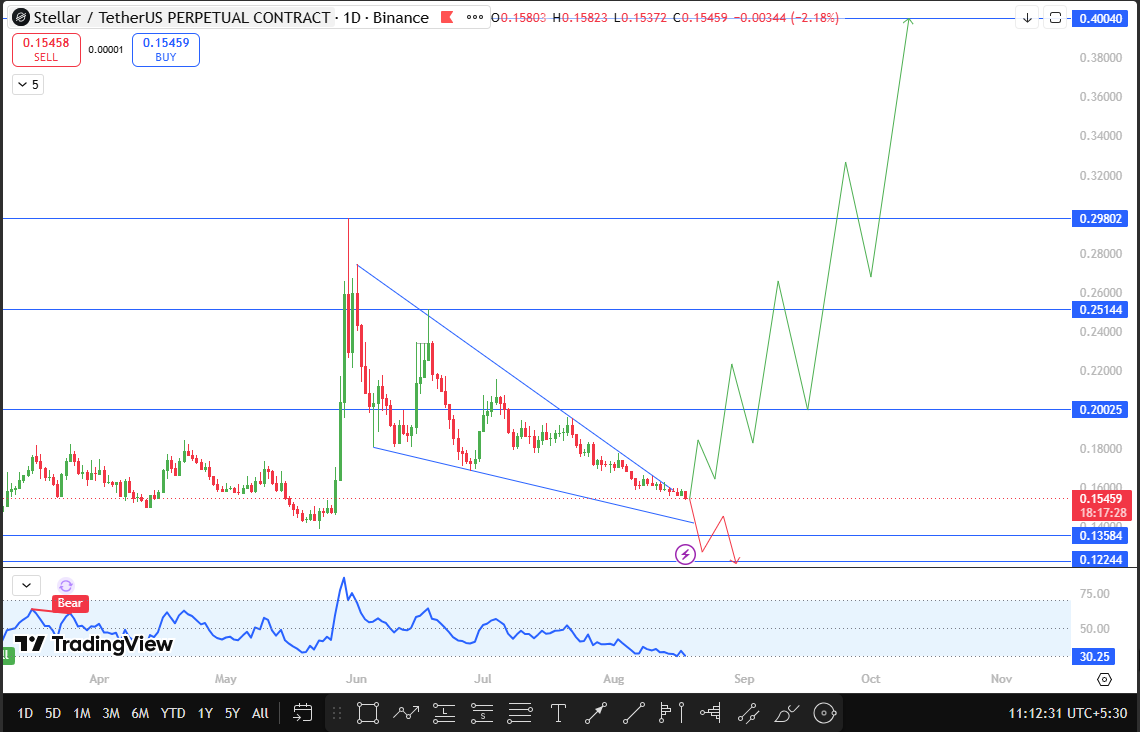
XLM is currently trading inside this structure on the daily chart.
The bear-tagged momentum reading of 30.25 reflects weak short-term momentum even as the price sits near the wedge's lower boundary, so the pattern is not confirmed yet in either direction.
If the price closes above the wedge's upper trendline, the setup points toward the marked resistance levels drawn from prior swing highs: $0.20025, then $0.25144, then $0.29802, and $0.40040 on an extended move.
A confirmed daily close below $0.13584 would invalidate the wedge structure and open room toward $0.12244, the next marked swing low.
XLM Support and Resistance Levels to Watch
Level Type | Price | % From CMP | Note |
Resistance 4 | $0.40040 | +159.0% | Old swing high, extended target |
Resistance 3 | $0.29802 | +92.8% | Old swing high |
Resistance 2 | $0.25144 | +62.6% | Old swing high |
Resistance 1 (trigger) | $0.20025 | +29.5% | Daily close above confirms wedge breakout. |
Current Price | $0.15459 | — | Live CMP, Binance perpetual |
Support 1 (trigger) | $0.13584 | -12.1% | Daily close below invalidates wedge |
Support 2 | $0.12244 | -20.8% | Old swing low, next support on breakdown |
Stellar Price Forecast: Bull Case, Base Case, and Bear Case
Bull Case: A daily close above $0.20025 confirms the wedge breakout and opens a path toward $0.25144, with $0.29802 and $0.40040 as extended targets on strong follow-through volume.
Base Case: XLM continues consolidating inside the falling wedge below $0.20025 while the market digests the recent long-side liquidation flush and the RWA growth data.
Bear Case: A confirmed daily close below $0.13584 invalidates the wedge structure and opens room toward $0.12244, particularly if long-side liquidations shift toward heavier short positioning.
CoinGabbar's XLM Technical Outlook
CoinGabbar's technical desk views this as a wait-for-confirmation setup rather than a settled breakout.
The falling wedge and the swing-based resistance levels give a clear structural map, but the Bear-tagged momentum reading and the heavy long-side liquidation flow show the market is still leveraged and reactive.
False breakouts, sudden liquidity grabs, and fast liquidation cascades remain a real risk in either direction, so the $0.20025 and $0.13584 triggers matter more than any single day's candle.
This Stellar price outlook will be revisited if XLM closes decisively beyond either trigger level or if new ETF or liquidation data changes the picture.
Glossary
CMP: Current Market Price, the live traded price at the time of analysis.
Open Interest: The total value of outstanding, not yet settled derivative contracts for an asset.
Liquidation: The forced closure of a leveraged trading position when losses exceed the margin held.
Perpetual Futures: A futures contract with no expiry date, commonly used for leveraged crypto trading.
Falling Wedge: A converging chart pattern formed by two downward-sloping trendlines, often watched for a breakout reversal.
RWA (Real-World Assets): Traditional financial assets such as bonds or credit that are tokenized and represented on a blockchain.
Disclaimer: This article is for informational purposes only and should not be treated as financial advice. Cryptocurrency markets are highly volatile, and readers should do their own research before making any investment decisions. CoinGabbar and the analyst do not hold a position in XLM at the time of publication.
0
0

 Manage all your crypto, NFT and DeFi from one place
Securely connect the portfolio you’re using to start.

0
0


0
0

0
0