3 Coins That Printed Fresh ATH Prices Recently - AVAX, DOT, & AAVE - Where Are They Heading Next?
8
4
Bitcoin entered into a period of consolidation this week after setting a new ATH at $42,000. The cryptocurrency headed lower from there as it rebounded from support around $32,500. Since bouncing, BTC is still yet to break back above $40,000.
Meanwhile, it seems that money might be flowing back into Altcoins as a number of cryptocurrencies created fresh ATH’s in the last 24 hours;
Today, we will take a look at AVAX, DOT, and AAVE and highlight some areas of resistance as it continues to make new ATH prices.
Avalanche (AVAX) Price Analysis
When Did It Hit ATH?
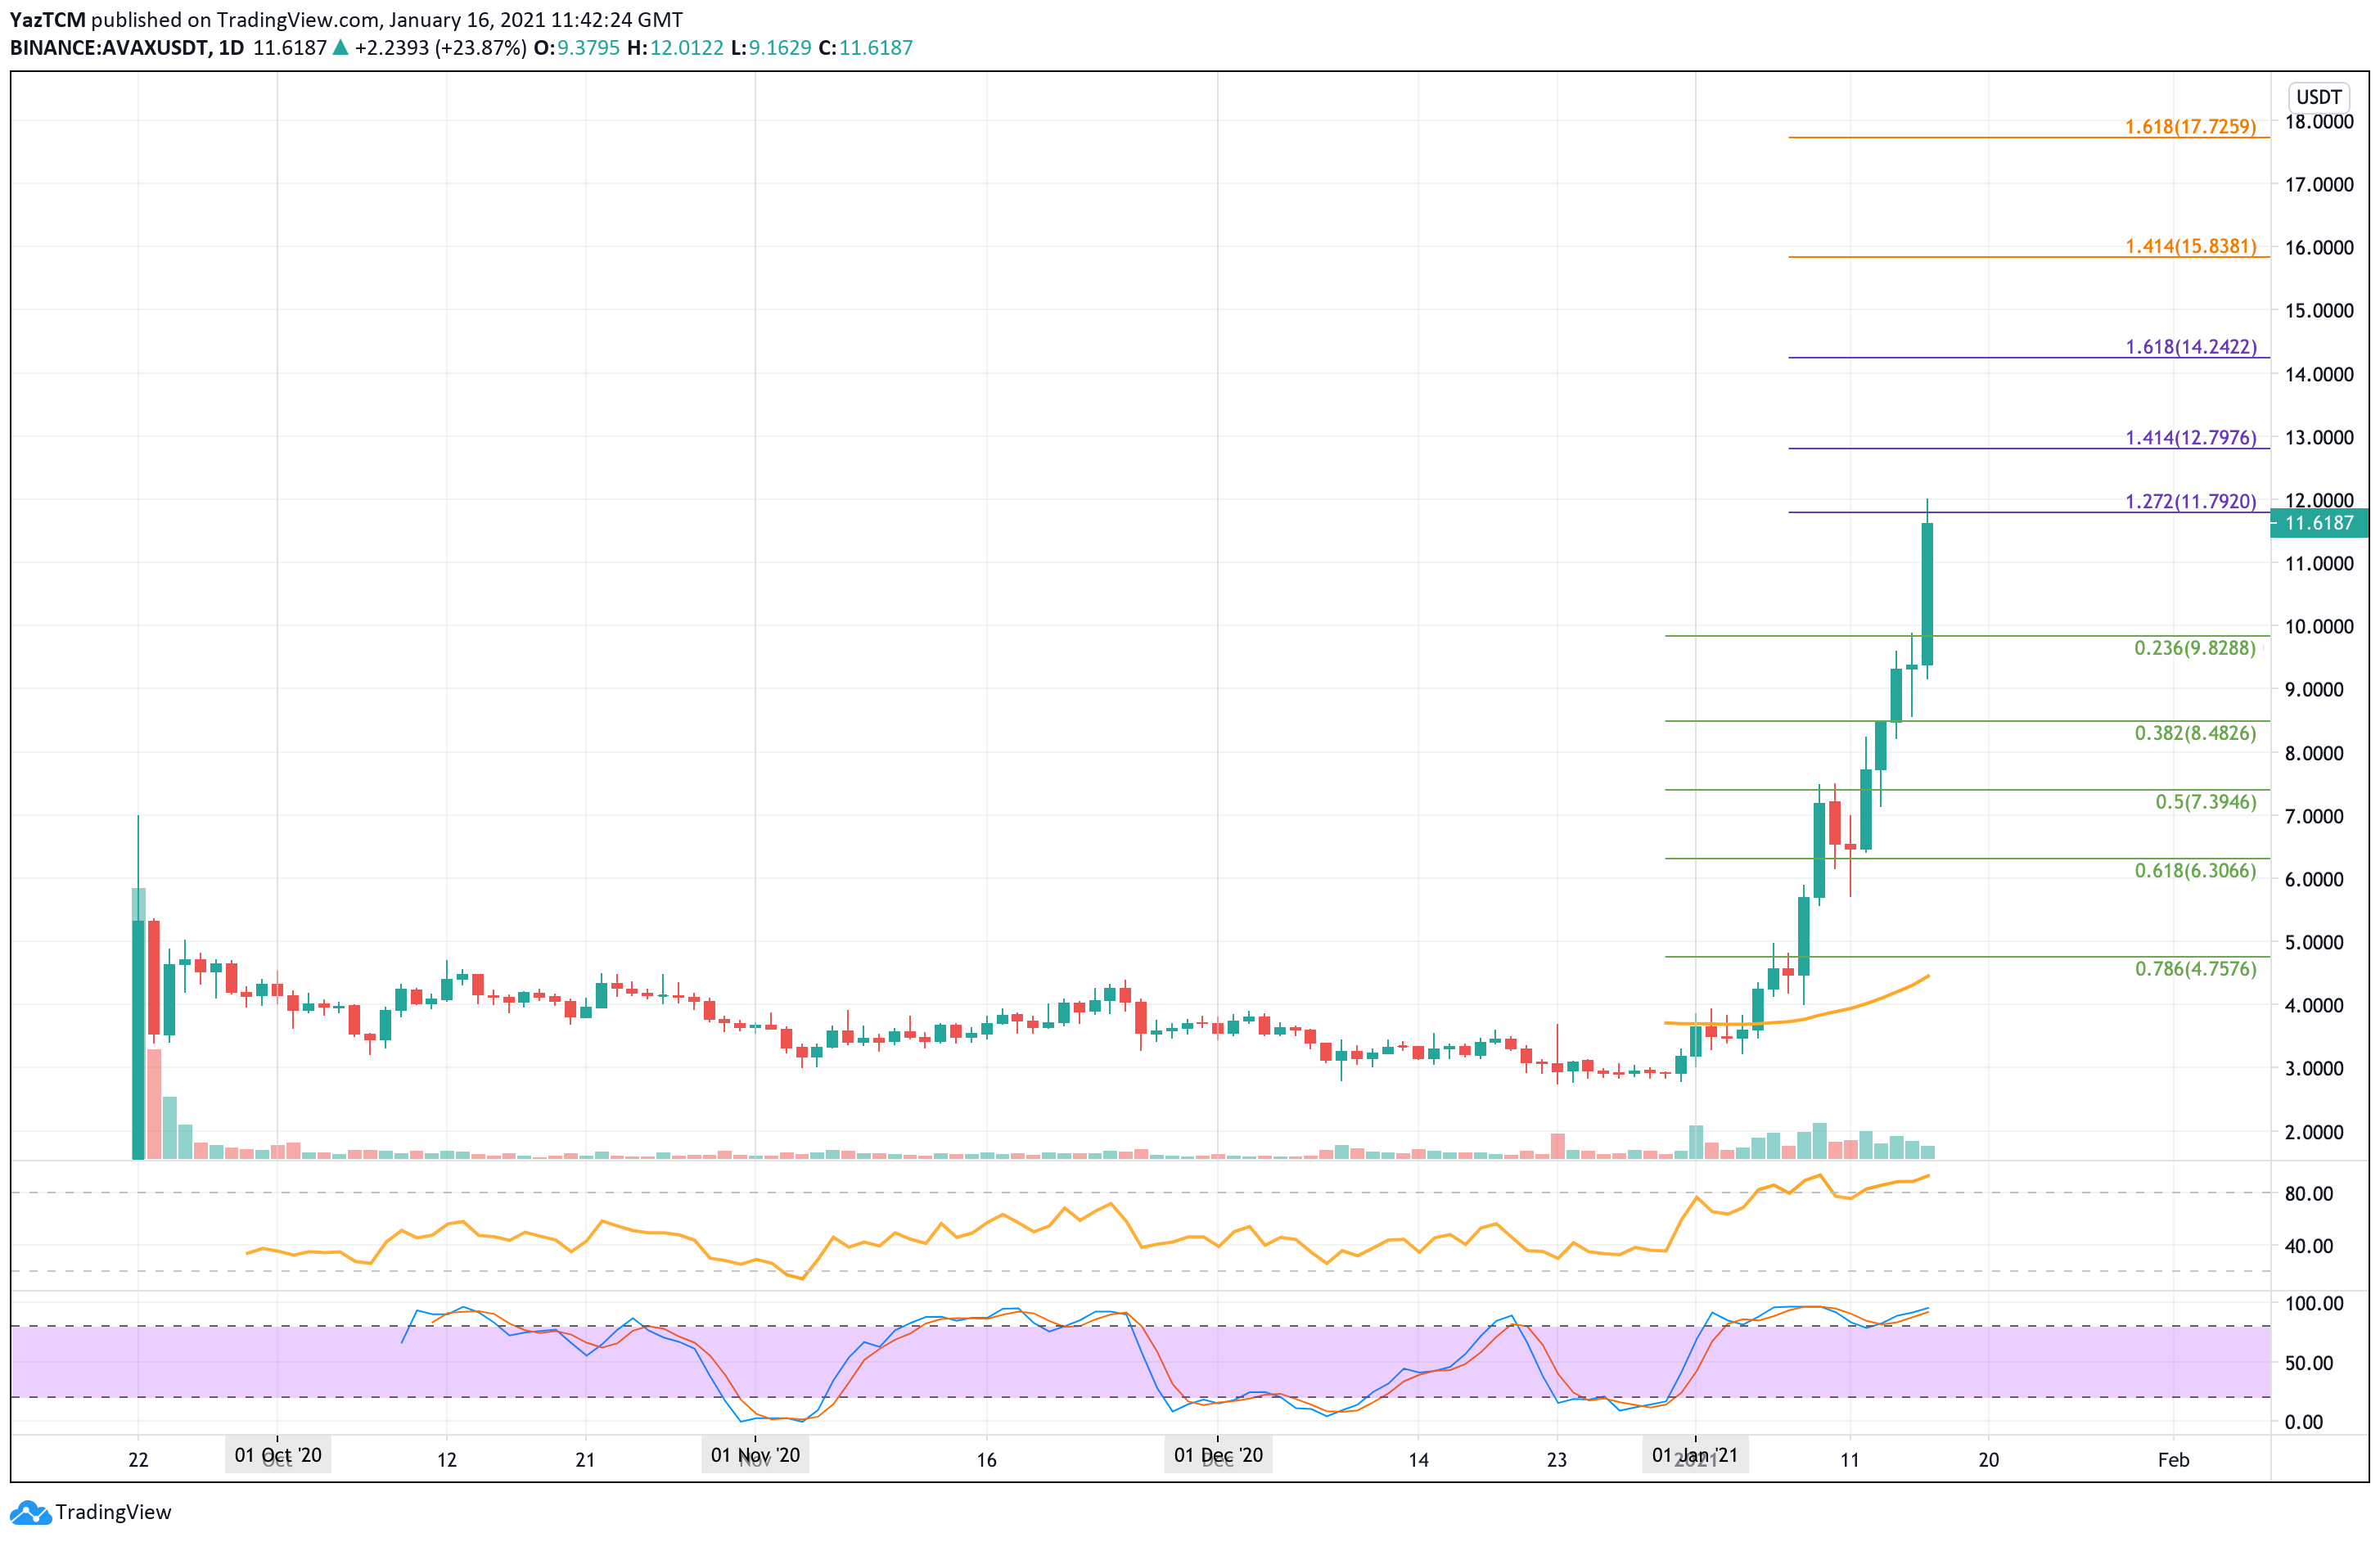
AVAX hit a new ATH today as it touched the $12 level. The cryptocurrency is now up by a total of 77% over the past week and up by a stronger 253% over the past month of trading. The cryptocurrency surge started for AVAX at the start of the month when it began to push above the $3.00 level.
It continued to drive higher over the past fortnight with little-to-no resistance along the way. Yesterday, AVAX was trading beneath the $10 level, but this was penetrated with the 20.65% price hike seen today. It broke past the $10 level and went on higher to reach the $12 resistance. It has since dropped slightly from this resistance as it trades around $11.60 at the time of writing.
AVAX price short term prediction: Bullish
AVAX is most certainly bullish right now. The coin would need to drop beneath support at $6.30 (.618 Fib Retracement) to turn neutral and would have to continue further beneath $4.00 to be in danger of turning bearish.
IF the sellers start to push lower, the first level of support lies at $11. This is followed by support at $10 (.236 Fib Retracement), $9.00, $8.42 (.382 Fib Retracement), and $8.00.
Beneath $8, additional support lies at $7.40 (.5 Fib Retracement), $6.30 (.618 Fib Retracement), and $5.00.
Where is the resistance toward the upside?
On the other side, the first level of resistance lies at $12. Above this, resistance lies at $12.80 (1.414 Fib Extension - purple), $13, $14, and $14.42 (1.618 Fib Extension - purple). If the bulls continue beyond $15, additional resistance lies at $15.83 (1.414 Fib Extension - orange), $16, $16.50, $17, and $17.72 (1.618 Fib Extension - orange).
Polkadot (DOT) Price Analysis
When did it hit ATH?
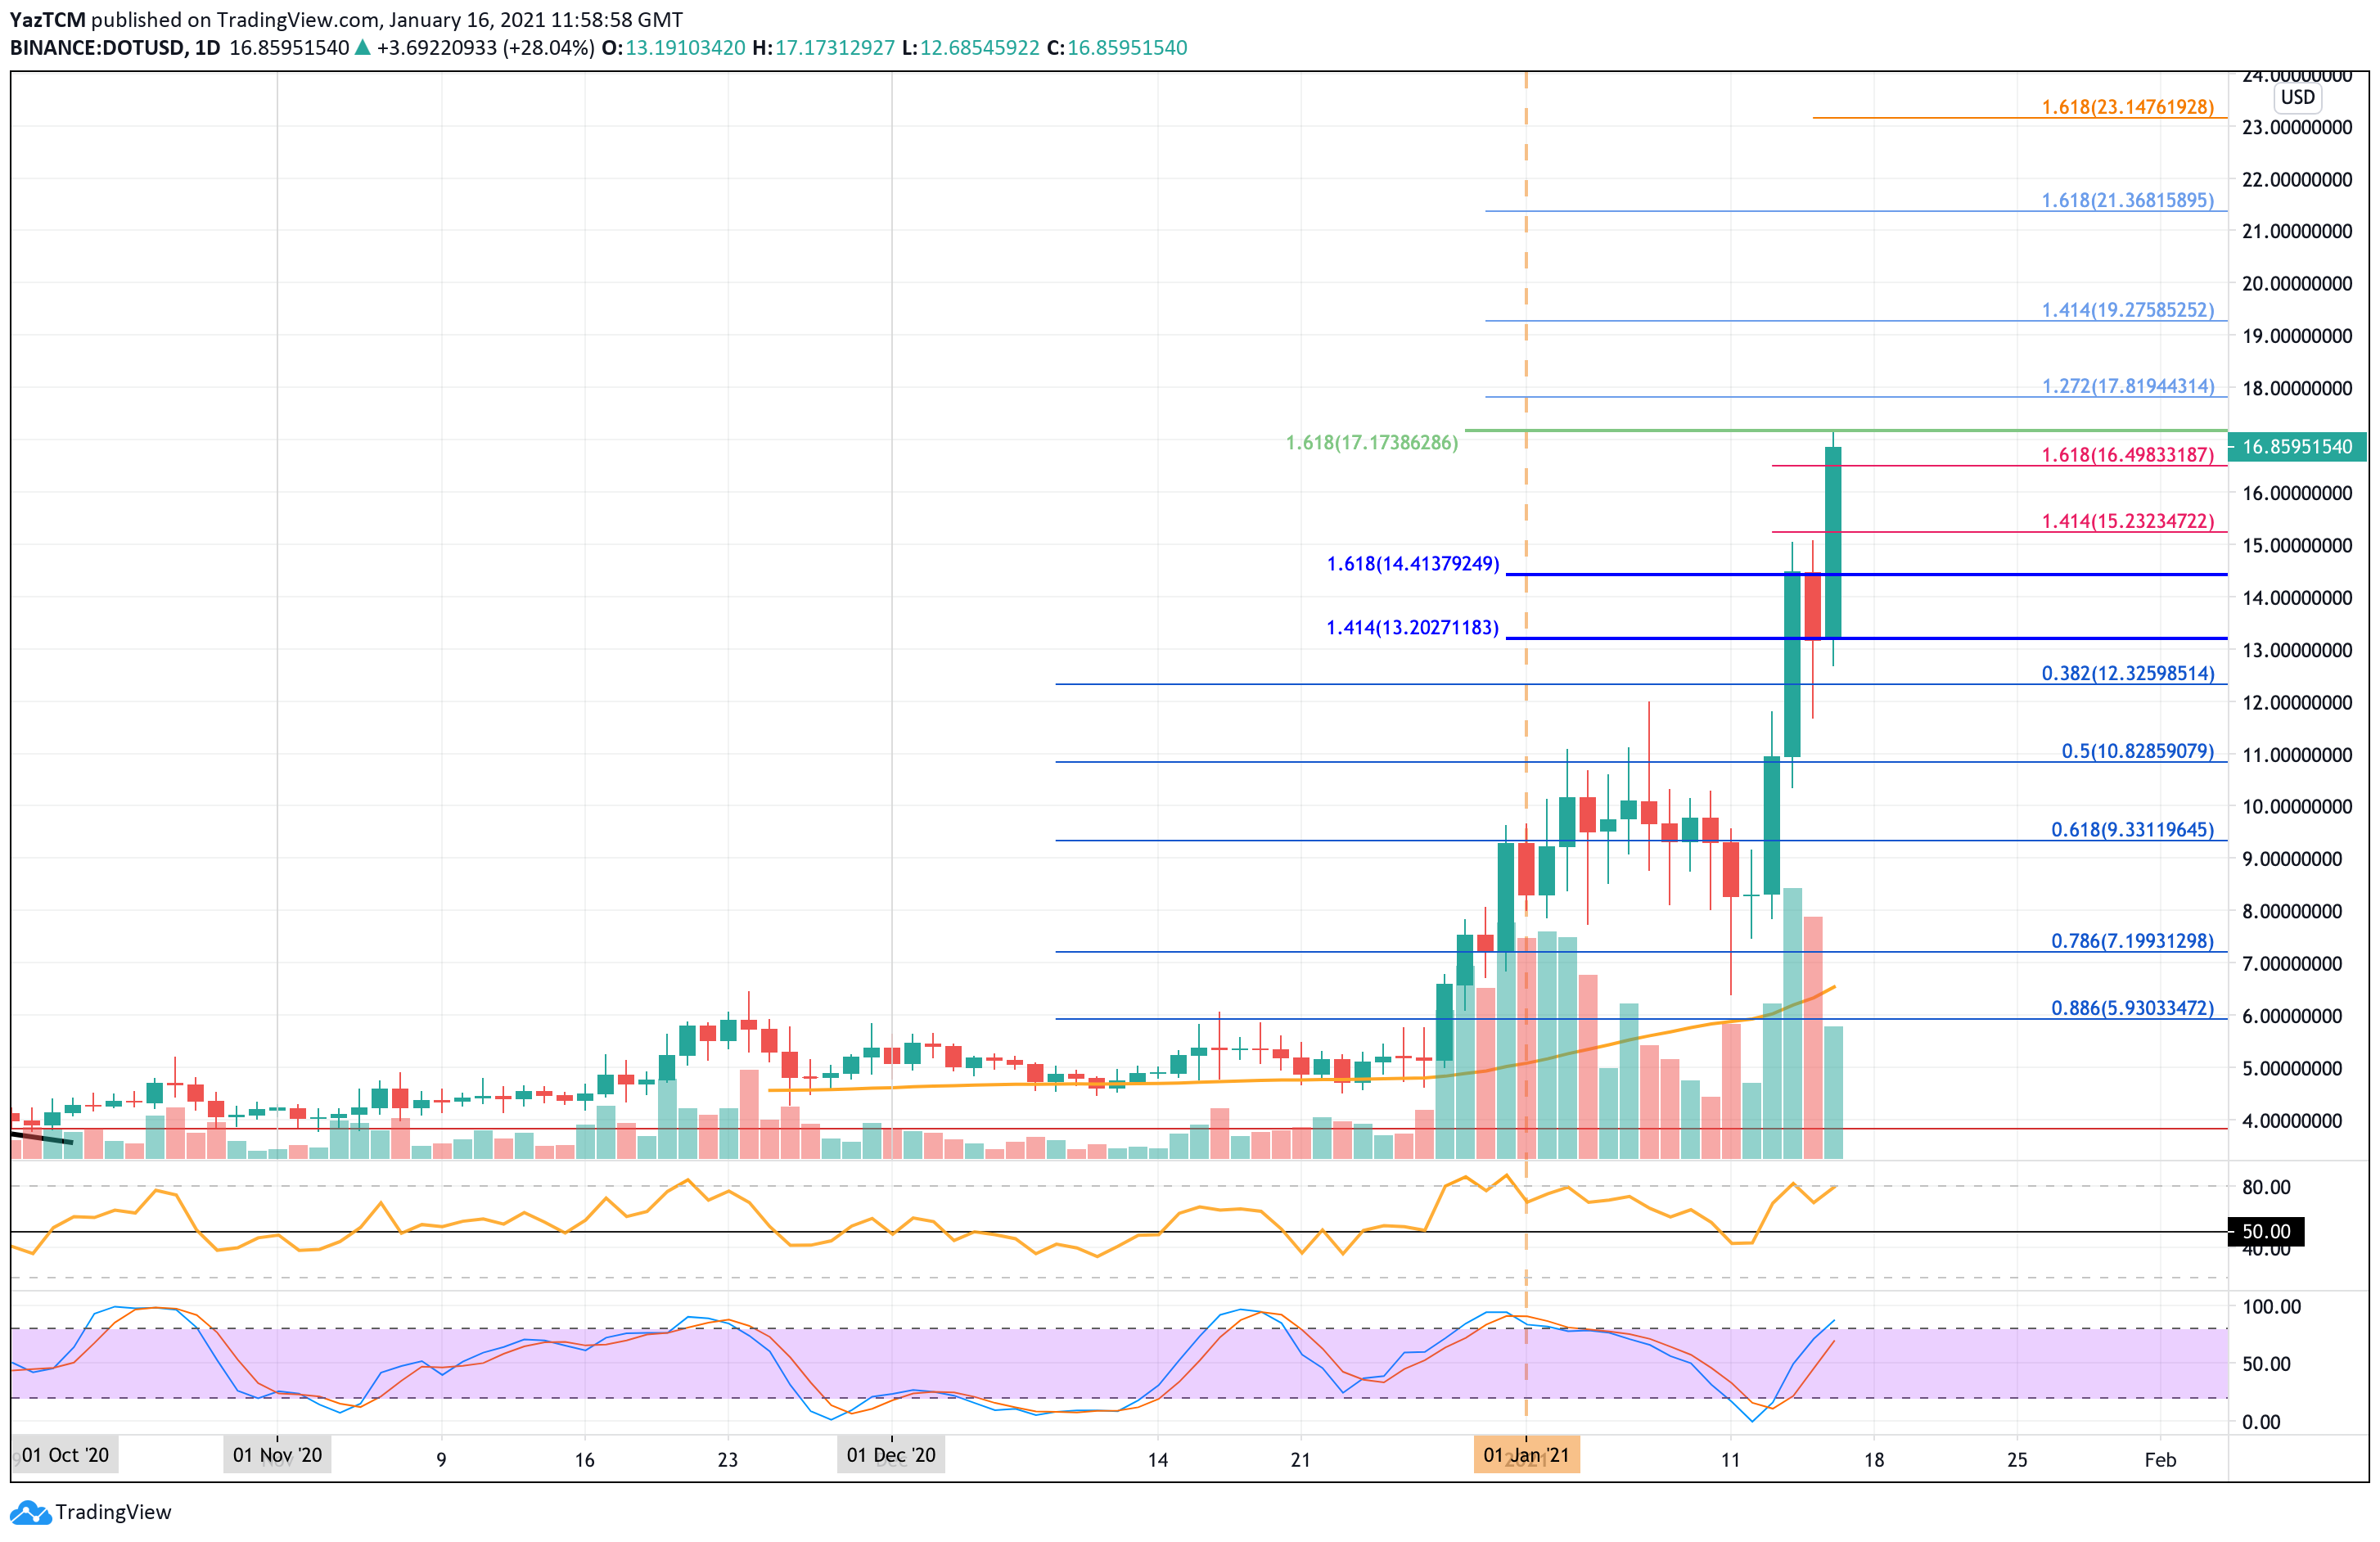
DOT also created a new ATH today as it climbed by 19.4% to reach the current ATH at $17.17. The cryptocurrency is now up by a total of 80% over the past week and 241% over the past month of trading.
DOT’s price surge started at the end of December 2020 when it rebounded from the 100-day EMA at $5.00 and started to push higher. By the start of 2021, DOT was already trading at $9.00. It pushed higher but struggled to break the $11 resistance last week.
At the start of this week, DOT headed lower when BTC dropped by 25%, but it managed to find strong support at $8. It rebounded from $8 during the course of this week and started to push higher.
It found resistance over the past couple of days at the $14.41 level, provided by a 1.618 Fib Extension level). Today, this resistance was finally penetrated when DOT surged from $13.20 to break above $15 and reach the new ATH price at $17.17.
DOT price short term prediction: Bullish
DOT is considered extremely bullish right now. The cryptocurrency would have to drop and fall back beneath the $10 support to be considered as neutral. It would need to continue further beneath the support at $6.00 before being in danger of turning bearish in the short term.
If the sellers do push lower, the first level of support lies at $16.50. This is followed by support at $15.32, $14.40, $14, and $13.20.
If the bears continue to drive DOT lower, added support lies at $12.32 (.382 Fib Retracement), $10.82 (.5 Fib Retracement), $10, and $9.31 (.618 Fib Retracement).
Where is the resistance toward the upside?
On the other side, the first level of resistance lies at $17.17. This is followed by resistance at $17.81 (1.272 Fib Extension), $19, $19.27 (1.414 Fib Extension), and $20. Beyond $20, additional resistance lies at $21.36 (1.618 Fib Extension), $22, and $23.14 (short term 1.618 Fib Extension).
AAVE (AAVE) Price Analysis
When did it hit ATH?
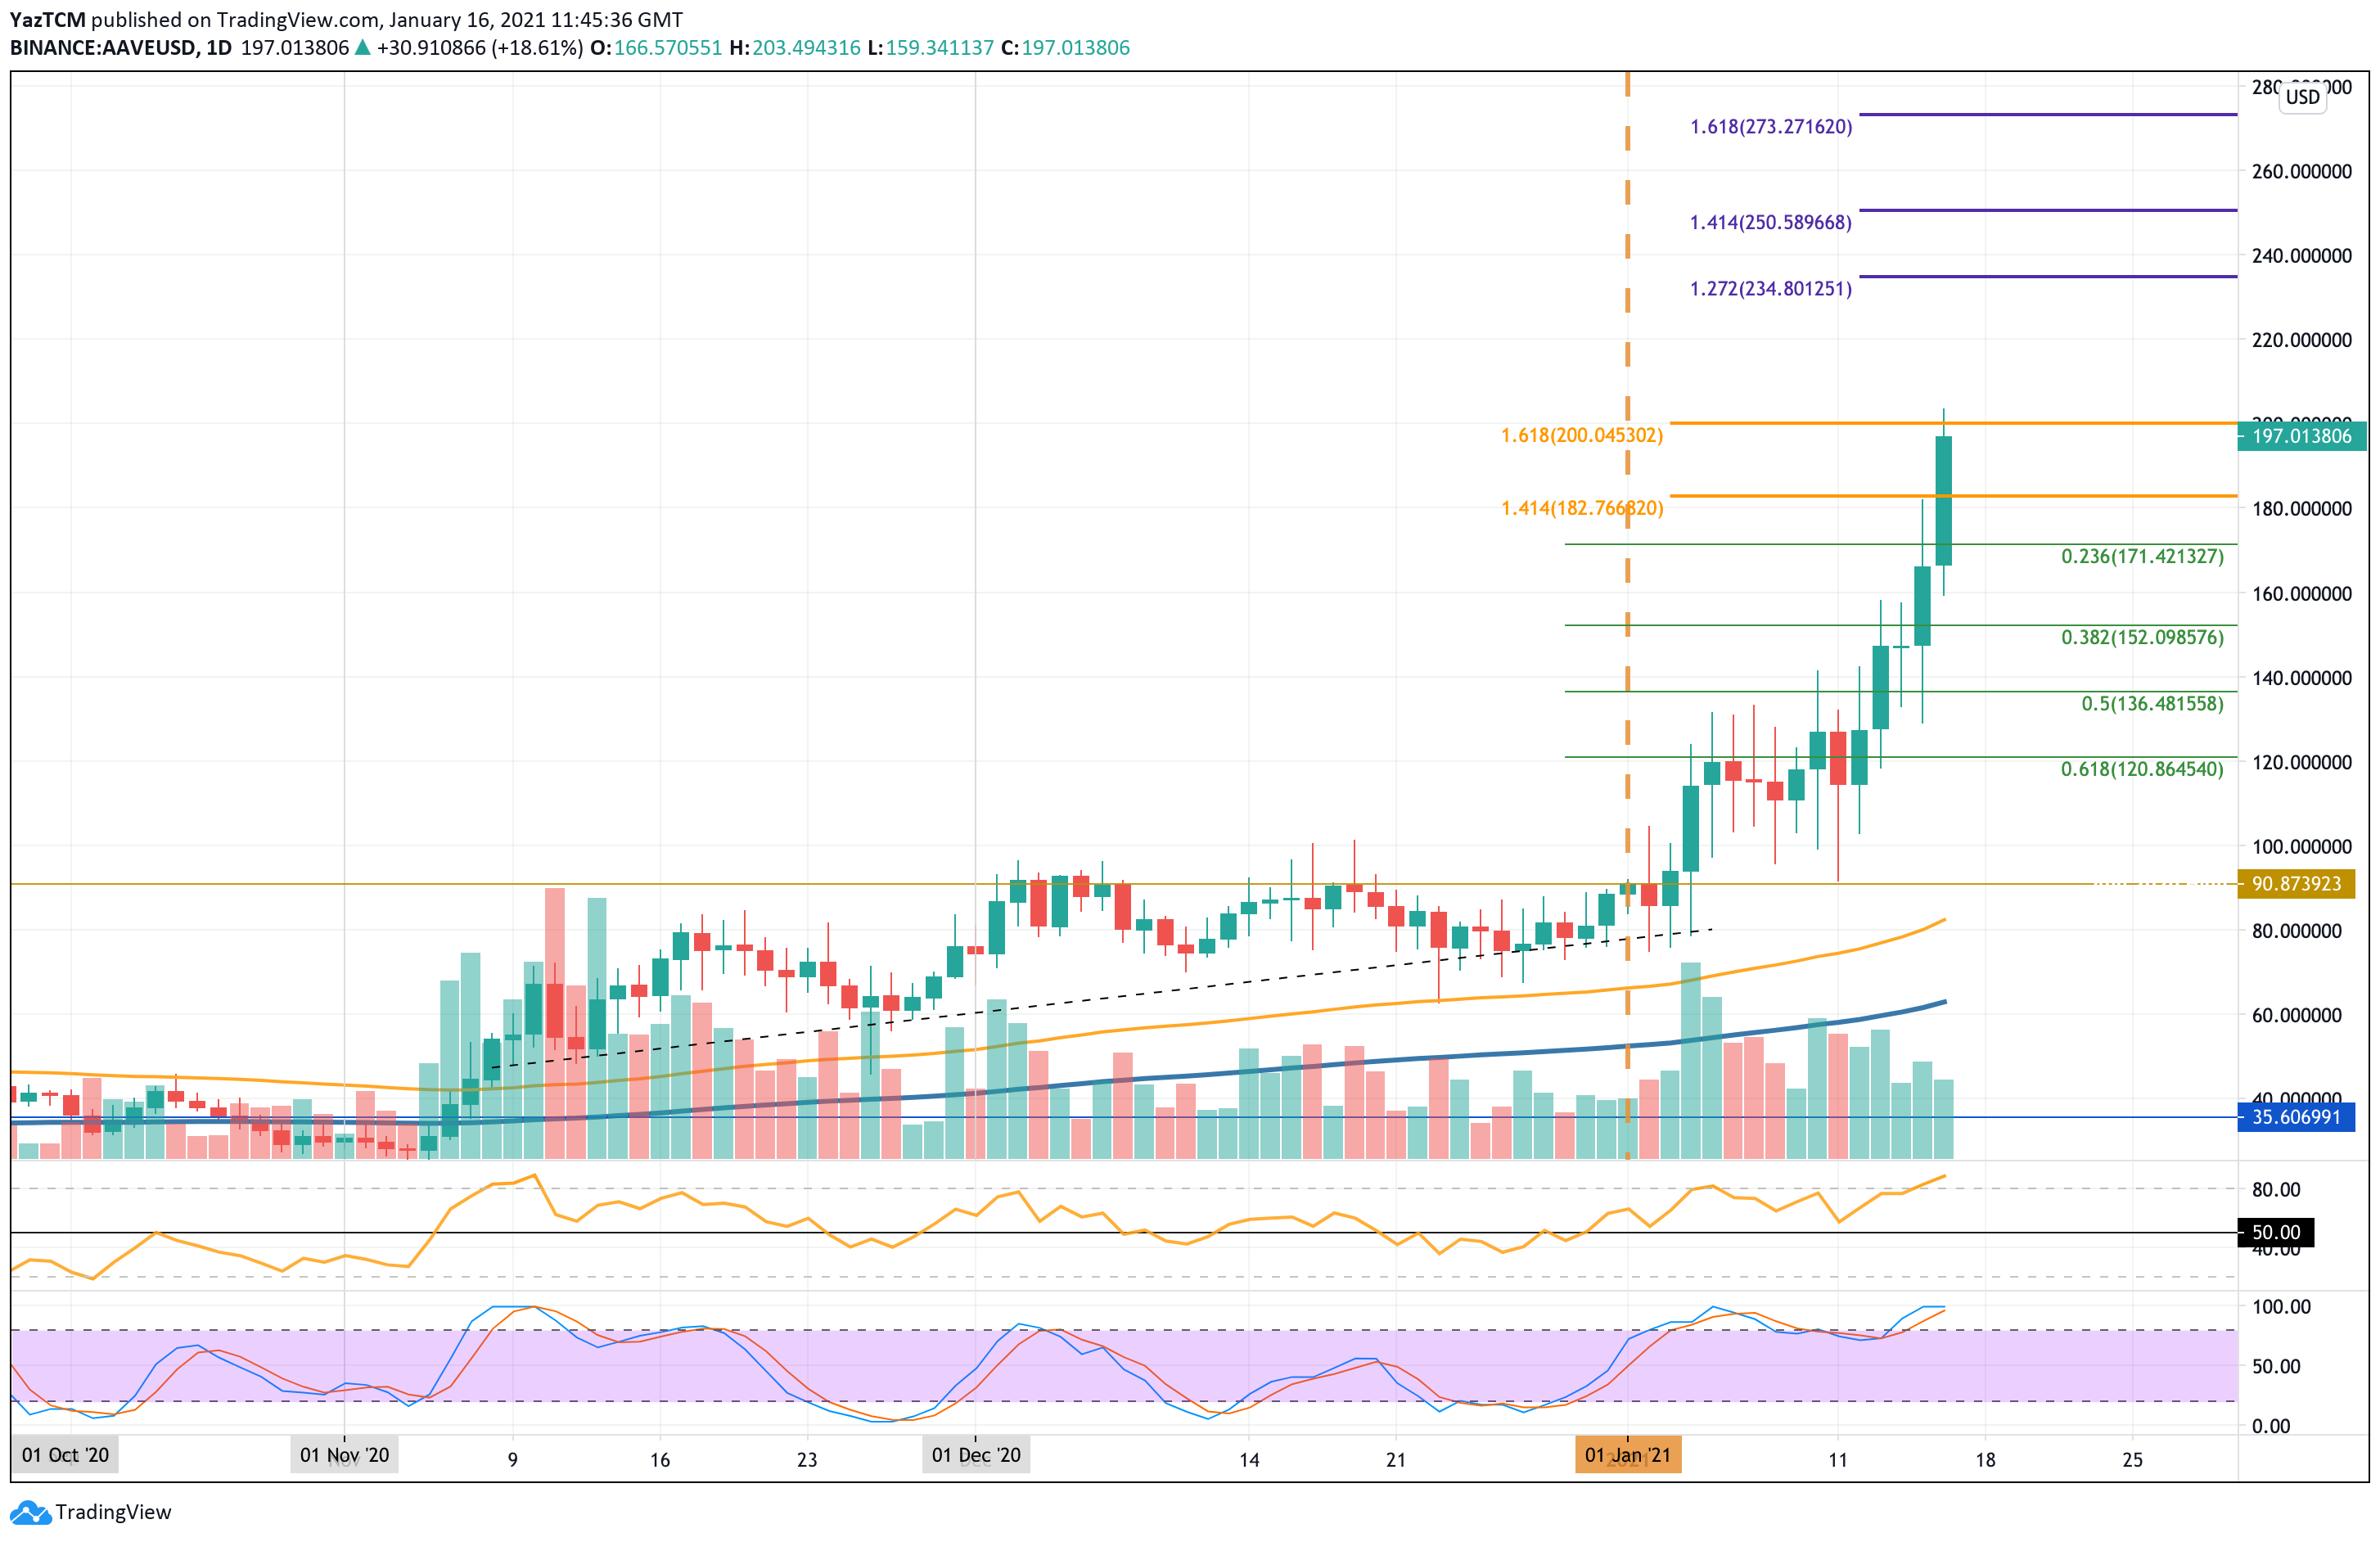
AAVE surged today by a total of 22.3% to create a new ATH at the $200 level. The cryptocurrency is now up by 72% over the past week and a total of 133% over the past month.
AAVE also started to surge higher this week when it bounced from support at $90 on Monday and started to climb. Each day this week, AAVE continued to make new ATHs until reaching the $200 level today.
AAVE price short term prediction: Bullish
AAVE is strongly bullish right now. The coin would need to drop beneath $120 to turn neutral and would have to continue beneath $90 to be in danger of turning bearish.
If the sellers push lower, the first level of support lies at $180. This is followed by support at $171 (.236 Fib Retracement), $160, $152 (.382 Fib Retracement), and $140.
Where is the resistance toward the upside?
On the other side, if the bulls can break beyond the $200 resistance, the first level of higher resistance lies at $220. This is followed by resistance at $234 (1.272 Fib Extension), $240, $250 (1.414 Fib Extension), and $260.
Additional resistance is then found at $273, $280, and $300.
8
4


 Manage all your crypto, NFT and DeFi from one place
Securely connect the portfolio you’re using to start.


0
0

