Assessing where Bitcoin stands from these key metrics
3y ago
bullish:
0
bearish:
0
Share

Bitcoin appears to be in some trouble as people are now becoming more and more cautious these days. The past week saw some major selling and a huge amount of money leaving the market. Not only did the money from the present leave, but money from the Futures left the market as well. So, where does Bitcoin stand? Find out here.
Bitcoin Futures in shtook
The derivatives market this week took a surprising hit. Even though volatility in the Futures market isn’t unheard of, these instances are significant to the price in the short term right now. Since its May ATH, trading volumes have been declining consistently. Approaching the end of the last week, Futures Open Interest came down to remain within $13 billion and $10.7 billion.
This denoted a 57% decline since the Futures volumes' ATH in April.
Bitcoin Futures Open Interest down by 57% | Source: Glassnode
Additionally, Futures volumes have been falling as well, reaching back close to the lowest levels the indicator fell to this year. At $45 billion of daily volumes, the metric seemed to be closer to February's $38k level. This placed the press time volumes at 62.5% and 49% lower than the first (May) and second (June) capitulations.
Bitcoin Futures Volume declining | Source: Glassnode
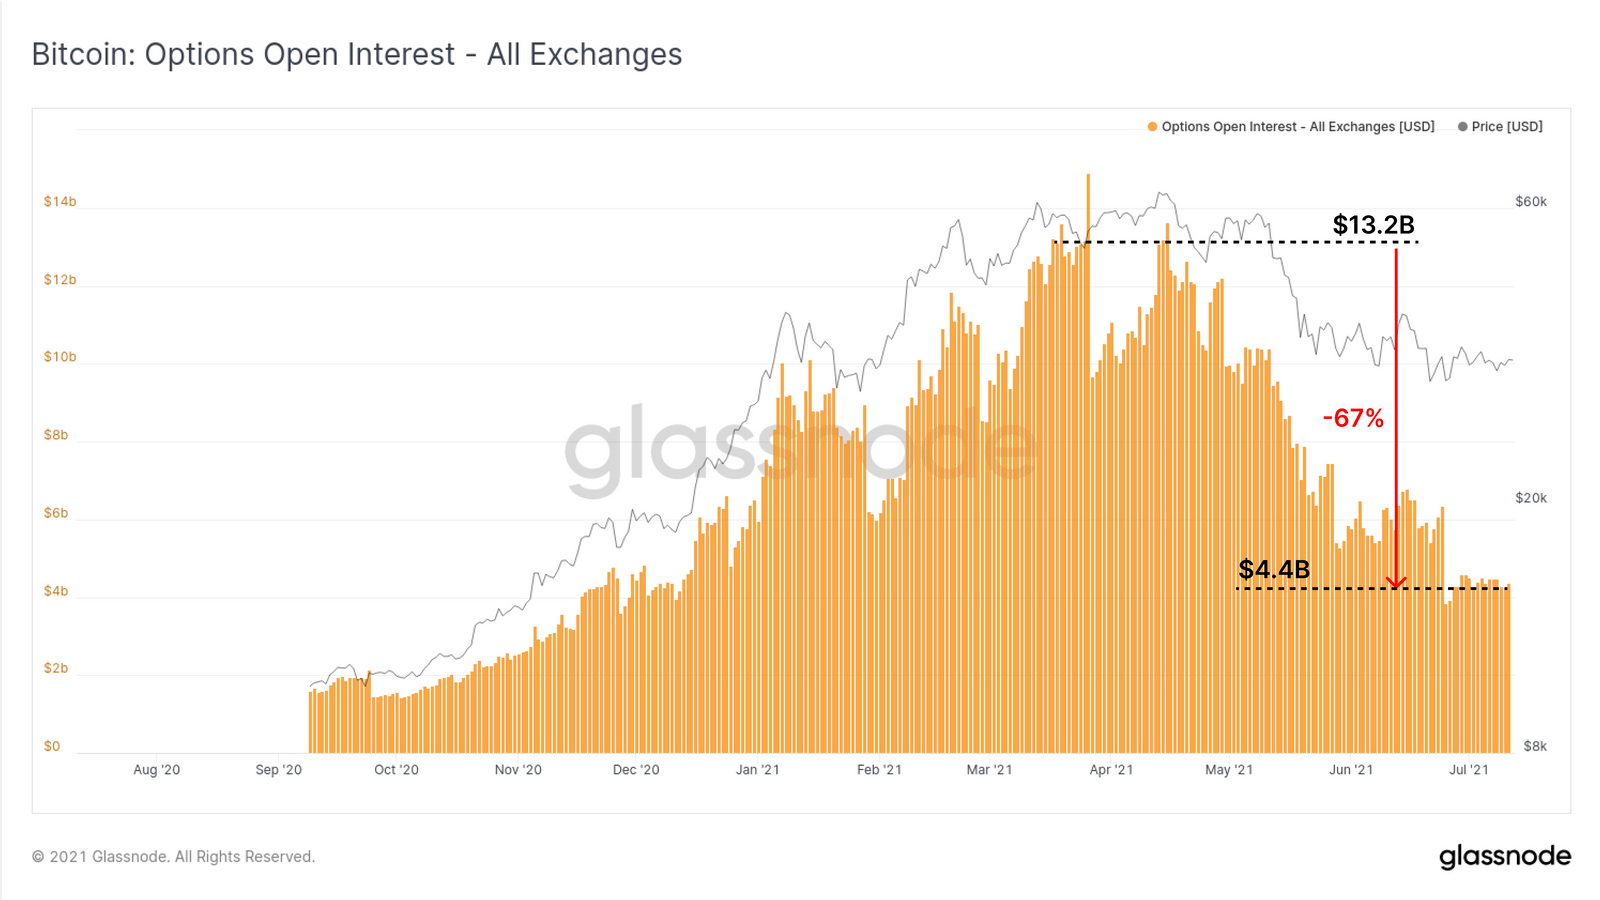
Finally, Options Open Interest in the derivatives market registered a 67% drop from its highs of $13.2 billion to $4.4 billion. Such a decline may be a sign of any upcoming volatility being driven by spot rather than leveraged liquidations.
Bitcoin Options Open Interest down by 67% | Source: Glassnode
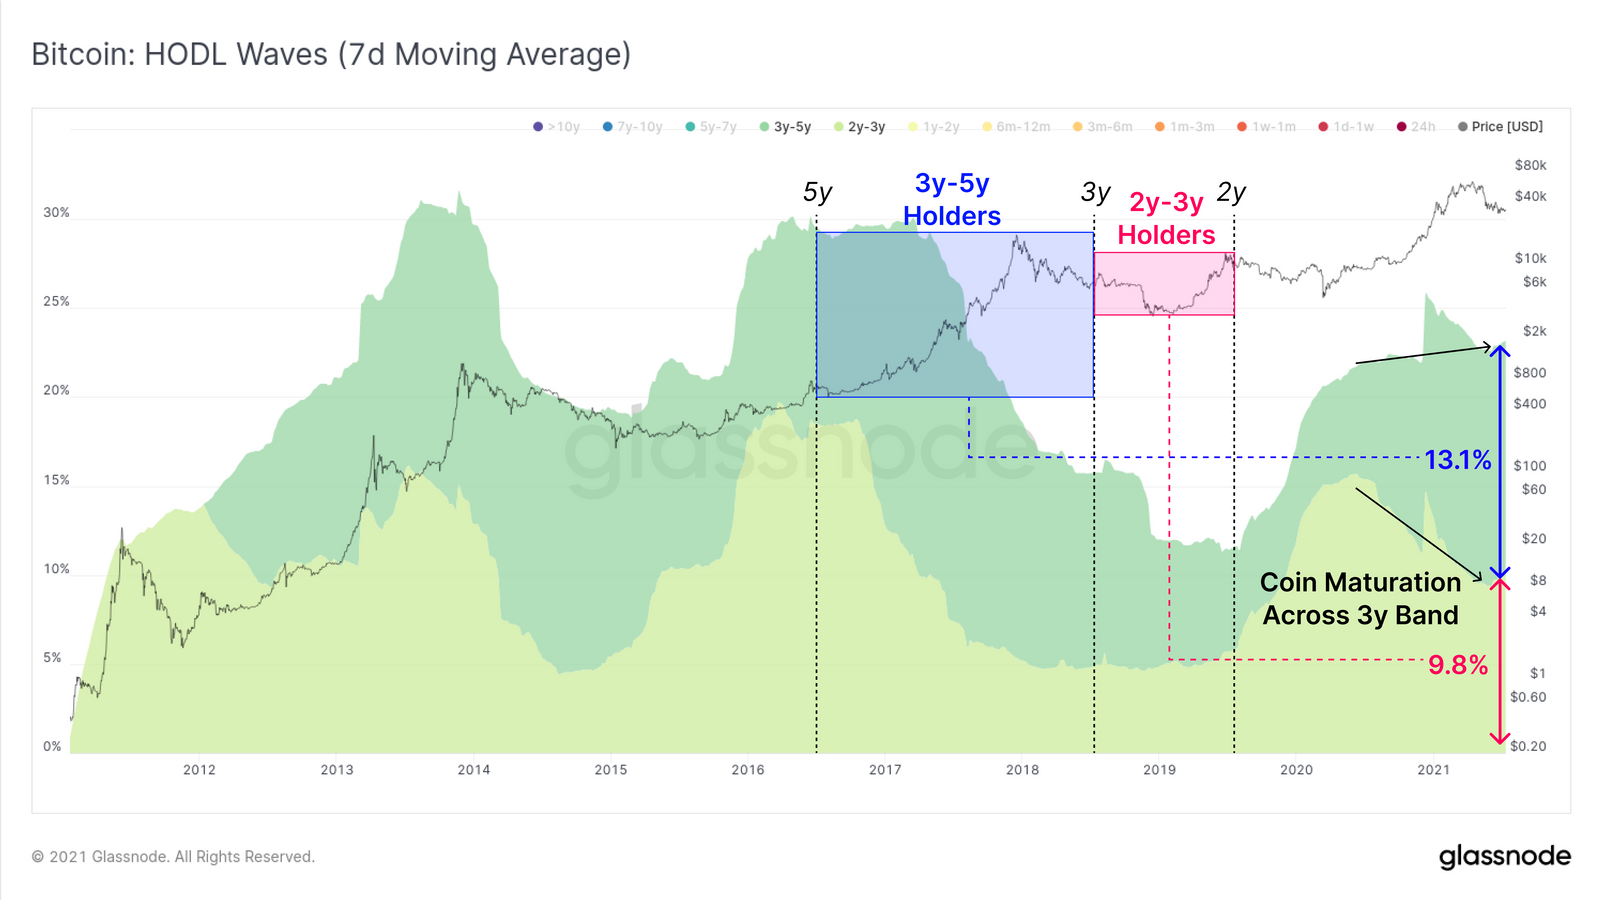
HODLers Selling?
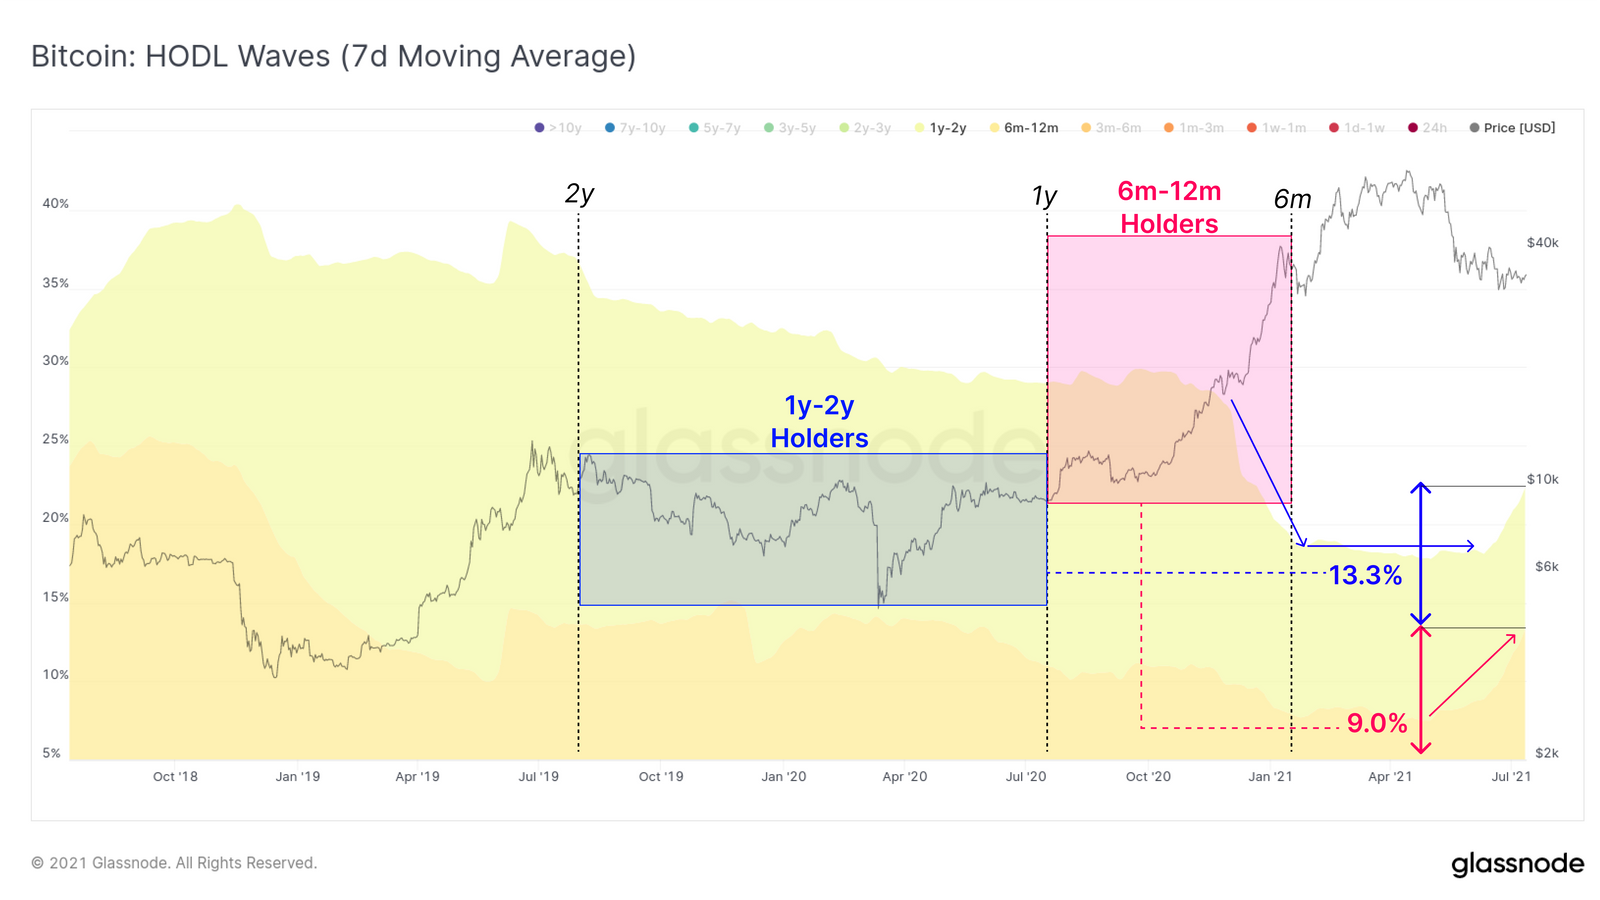
The charts provide an understanding of coins of various ages and their recent behavior. In simpler words, ASOL displays older coins gradually turning dominant. The 2 year-3 year holders currently hold 9.8% of this supply. Furthermore, the 3y-5y band represents 13.1% of the supply. The 1y-2y holders’ holdings have come down to 13.3% and the younger 6m-12m old coins ( buyers of this bull market) hold 9% of the coin supply.
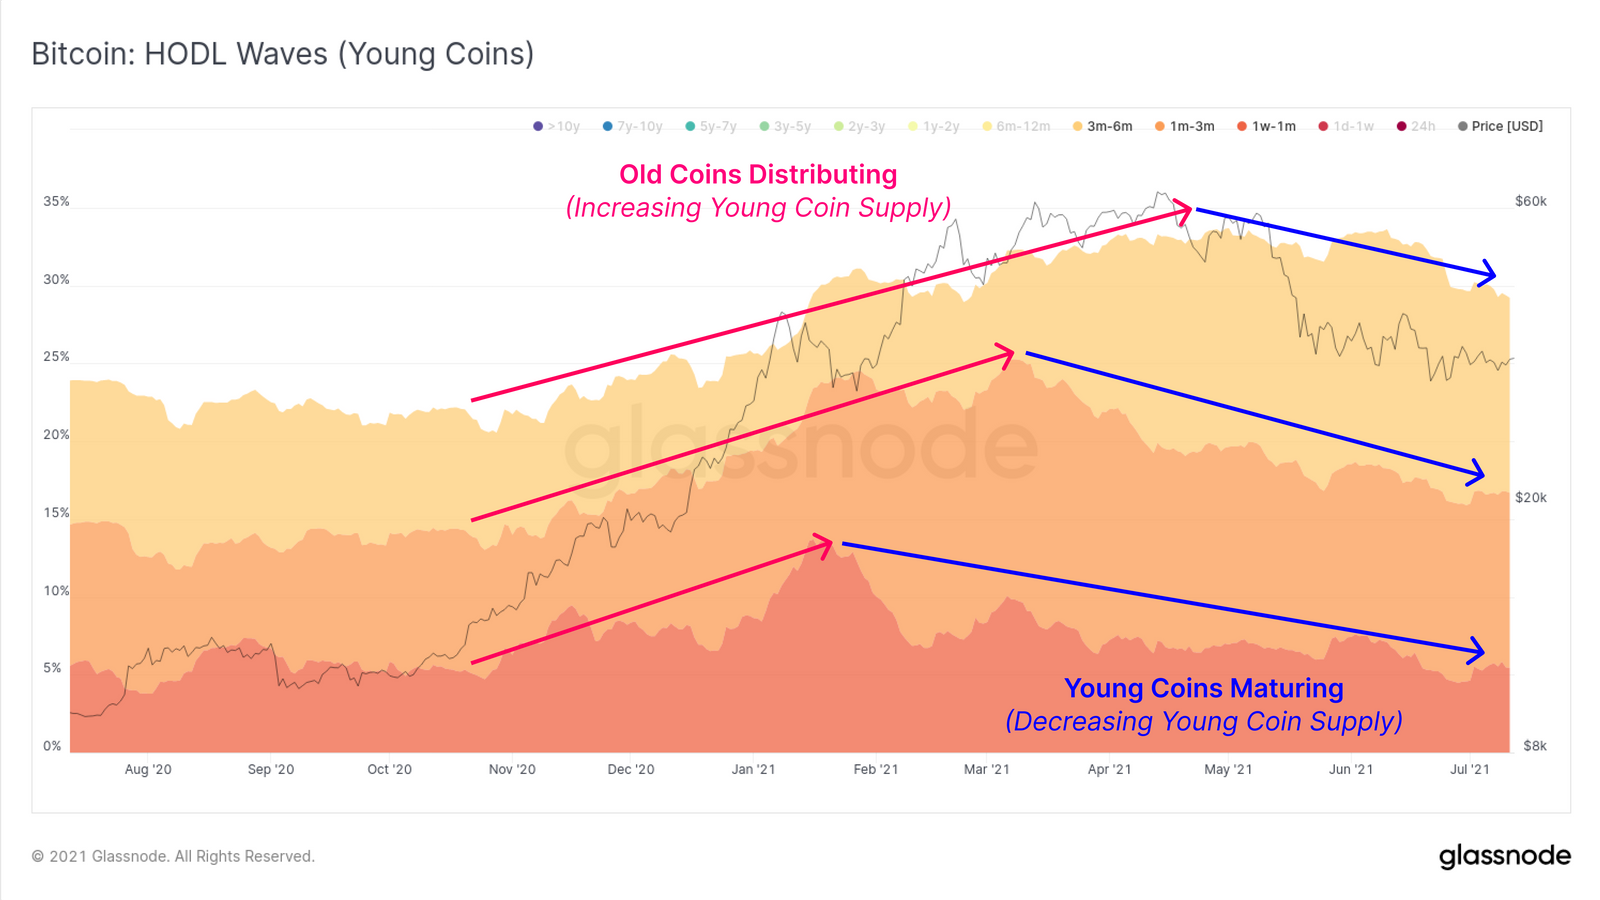
Finally, the youngest coins, aged between 1 and 6 months, increased from 22% to 32% around its May ATH. However, as maturity approaches, these coins are falling in supply as well.
Bitcoin HODL Waves - 2Y - 5Y coins | Source: Glassnode
Bitcoin HODL Waves - 6M - 2Y coins | Source: Glassnode
Bitcoin HODL Waves - 1W - 6M coins | Source: Glassnode
The post Assessing where Bitcoin stands from these key metrics appeared first on AMBCrypto.
3y ago
bullish:
0
bearish:
0
Share


 Manage all your crypto, NFT and DeFi from one place
Securely connect the portfolio you’re using to start.

bullish:
0
bearish:
0

bullish:
0
bearish:
0

bullish:
0
bearish:
0
