Hyperliquid vs. Solana: Which Layer-1 Will Dominate the May Derivatives Surge?
0
0


As derivatives volumes heat up heading into May, the battle between Hyperliquid and Solana is no longer a question of potential — it is a live, on-chain reckoning playing out in real time, and the charts are drawing very different pictures for each asset.
What the Charts Are Saying
Solana’s weekly chart generated on May 02, 2026 (10:02 UTC), tells a sobering story. Price is sitting at $83.97, down 3.43% on the week, in a structured multi-month downtrend from its $295 high.
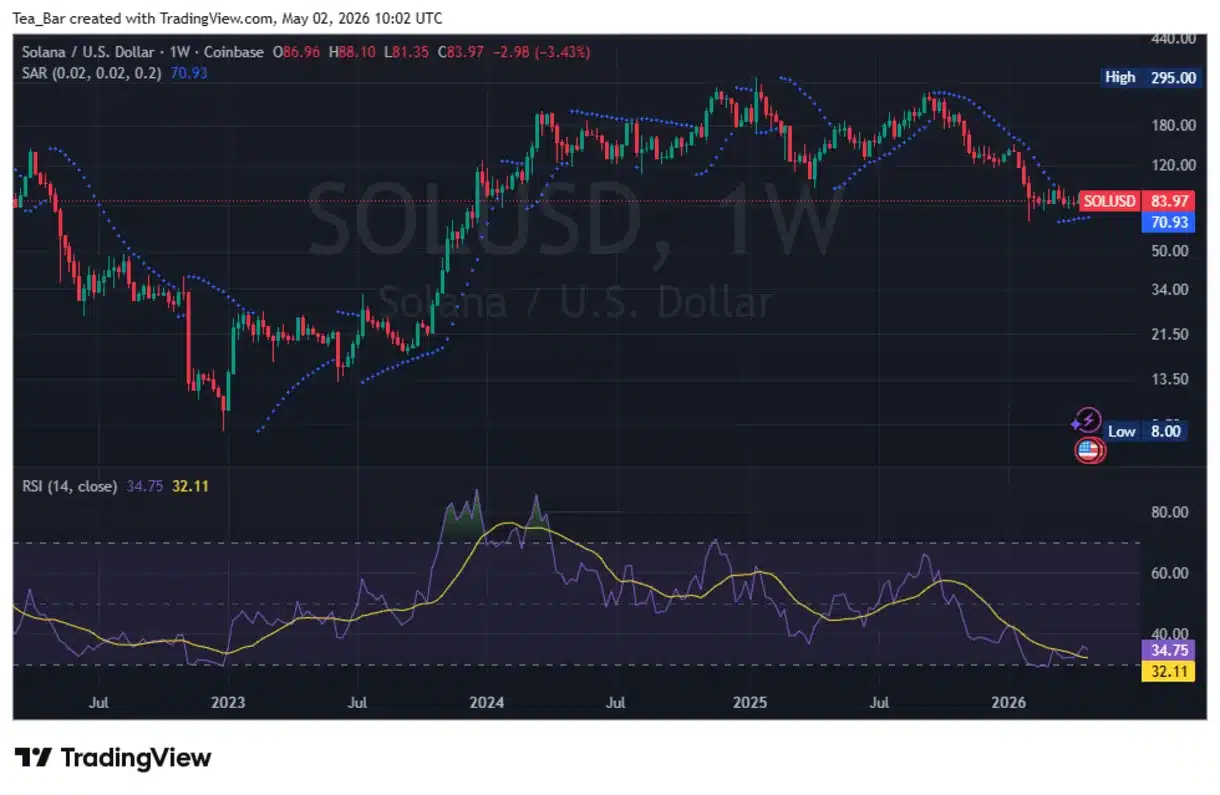
The Parabolic SAR at $70.93 remains below price — technically a bullish signal — but momentum has stalled.
Both RSI lines at 34.75 and 32.11 are converging just above the oversold threshold, a zone that has historically preceded either sharp bounces or accelerated breakdowns. There is no bullish crossover on the RSI yet.
The weekly candles lack conviction — small bodies with growing lower wicks suggest buyers are showing up, but not with enough force to reverse the structure.
A weekly close below $80 risks triggering the SAR into a bearish flip and opening the door toward the $65–$70 demand zone.
Hyperliquid is a completely different setup. HYPE is trading at $41.92, with the Parabolic SAR firmly anchored at $30.60 — well below price, confirming intact bullish trend structure.
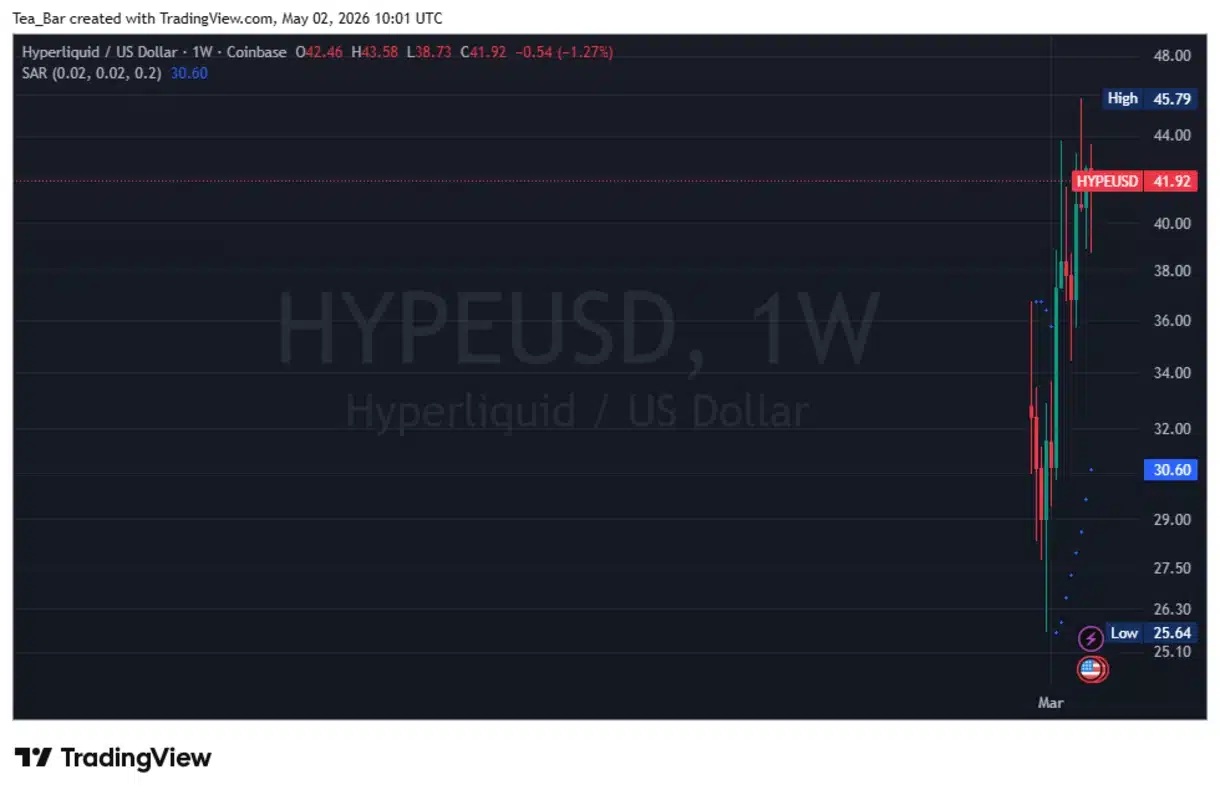
The weekly high of $45.79 is the immediate ceiling, and the base at $25.64 marked the launchpad of a near-vertical recovery.
Crucially, every pullback on HYPE has been shallow and short-lived, with price reclaiming levels quickly — a hallmark of strong underlying demand and limited sell-side pressure.
On-Chain: Where the Real Battle Is Won
The fundamentals tilt decisively toward Hyperliquid. As of late April 2026, Hyperliquid commands approximately 70% of all on-chain perpetual futures volume, with 30-day perp volume exceeding $180 billion — more than all other on-chain derivatives venues combined.Open interest stands at $5.15 billion, with 100,000 weekly active users and $492.7 billion in total Q1 2026 transaction volume.
Solana, meanwhile, is losing ground fast. Earlier in 2025, Solana generated over 50% of fees among major Layer-1s — that figure has since collapsed to just 9%, as Hyperliquid now accounts for over 40% of the total.
Solana’s broad ecosystem still commands loyalty, but the derivatives narrative belongs entirely to Hyperliquid — with ETF filings from Bitwise and 21Shares adding institutional credibility to an already dominant protocol.
With May volatility expected to spike and derivatives volumes likely to follow, the real question is: can Solana find a new demand catalyst fast enough to stop Hyperliquid from making this dominance permanent?
Disclaimer:
This article is for informational purposes only and does not constitute financial, investment, or trading advice. The views expressed are based on publicly available data, market observations, and the author’s interpretation at the time of writing. Cryptocurrency markets are highly volatile and unpredictable, and past performance or current technical setups do not guarantee future results. Readers should conduct their own research and consult with a qualified financial advisor before making any investment decisions. TechGaged does not accept liability for any losses incurred based on the information presented.
The post Hyperliquid vs. Solana: Which Layer-1 Will Dominate the May Derivatives Surge? appeared first on TechGaged.com.
0
0


 Manage all your crypto, NFT and DeFi from one place
Securely connect the portfolio you’re using to start.

0
0


0
0

0
0