Optimism Price Analysis: OPUSDT Ascending Scallop Pattern Signals Bullish Breakout
11M ago•

bullish:
0
bearish:
0
Share

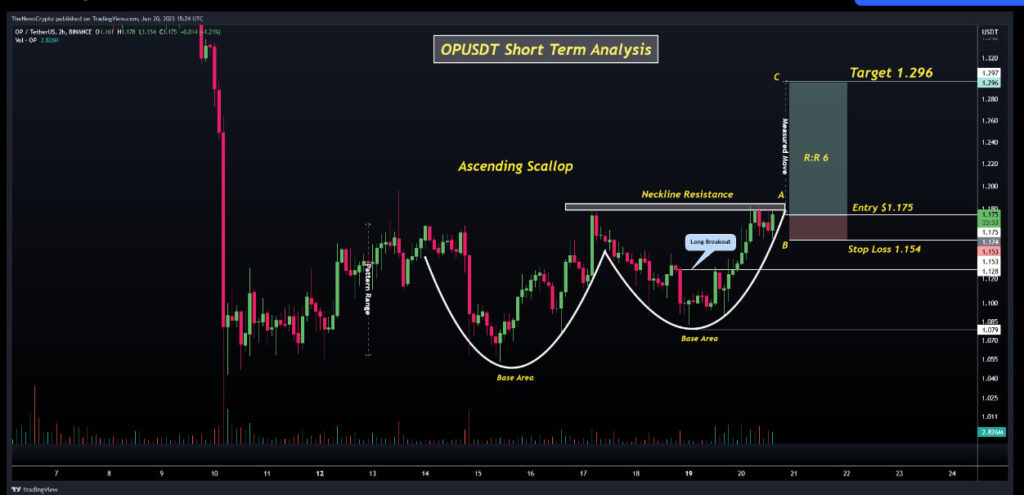
- OPUSDT is exhibiting an Ascending Scallop pattern.
- The target for OP trade setup is set at $1.296.
In the exciting world of cryptocurrency trading, market participants are constantly on the lookout for potential breakout opportunities that can offer significant profit potential. More so, one such intriguing prospect has emerged for Optimism, the trading pair of the OPUS token against Tether (USDT). Even more, a notable technical pattern known as the Ascending Scallop Pattern has been identified in the daily time frame.
In addition, the Ascending Scallop Pattern is a bullish continuation pattern characterized through a rounded bottom formation. With higher lows and a relatively flat top. Notably, this pattern suggests that OP has experienced a period of consolidation, with buyers consistently stepping in at higher levels, demonstrating their interest and potential bullish sentiment.
Optimism Price Analysis: Trade Setup
According to CoinMarketCap, the OP is trading at $1.22 with a 24-hour trading volume of $247,789,490, at the time of writing.
Entry: A long position has already initiated coz of some traders in anticipation of the breakout. In addition, for those who have not entered the trade yet. Moreover, it is advisable to consider entering once the breakout above the resistance area at $1.23 is confirmed. All-in-all, this confirmation could come in the form of a strong bullish candlestick close above the resistance level. This is indicating a shift in market sentiment.
Target: The target for this trade setup is set at $1.296. This level represents a favorable upside potential from the breakout level. It is important to note that targets should be adjusted based on individual risk appetite and market conditions. Furthermore, traders should closely monitor the price action and adjust their targets accordingly.
Stop Loss: To effectively manage risk, setting a protective stop loss is crucial. For this trade setup, a recommended stop loss level is at $1.154, positioned slightly below the breakout zone. More so, placing the stop loss in this manner helps mitigate potential downside risks and provides a buffer in case the breakout fails and the price retraces.
OP’s Ascending Scallop Pattern presents a compelling trade setup for traders. Even more, with an entry point above the resistance area at $1.175, traders can position themselves to benefit from a potential bullish breakout. Moreover, target of $1.296 offers a favorable upside potential, while a stop loss at $1.154 helps manage risk effectively. As always, it is important for traders to conduct their own analysis, monitor market conditions, and adjust their trading strategy accordingly.
11M ago•
bullish:
0
bearish:
0
Share


 Manage all your crypto, NFT and DeFi from one place
Securely connect the portfolio you’re using to start.

bullish:
0
bearish:
0

bullish:
0
bearish:
0

bullish:
0
bearish:
0

bullish:
0
bearish:
0