Algorand price prediction 2026-2032: Is a resurgence possible?

0
0
Key takeaways:
- Our Algorand price prediction indicates a high of $0.24 in 2026.
- In 2028, ALGO will range between $0.2559 and $0.3324, with an average price of $0.2942.
- In 2030, it will range between $0.2792 and $0.3856, with an average price of $0.3324.
Algorand’s capabilities make it an interesting prospect for investors and developers interested in smart contracts and blockchain interoperability.
Will ALGO go up? Can it reach $10? Where will ALGO be in 5 years? We explore these and more in our Cryptopolitan price prediction.
Overview
| Cryptocurrency | Algorand |
| Symbol | ALGO |
| Current Algorand price | $0.1075 |
| Market cap | $958.41M |
| Trading volume | 26.31M |
| Circulating supply | 8.91B |
| All-time high | $3.28 on Jun 21, 2019 |
| All-time low | $0.08 on Mar 30, 2026 |
| 24-hour high | $0.1110 |
| 24-hour low | $0.1065 |
Algorand price prediction: Technical analysis
| Indicator | Value |
| Volatility (30-day variation) | 6.94% (High) |
| 50-day SMA | $0.1107 |
| 200-day SMA | $0.1156 |
| Sentiment | Bearish |
| Green days | 12/30 (40%) |
| Fear and Greed Index | 28 (Fear) |
Algorand price analysis
On May 18, ALGO was red, falling 2.57% in 24 hours and 3.54% in 30 days. Its trading volume rose by 1.61% to $26 million, signaling conviction in the market trend.
Algorand 1-day chart analysis
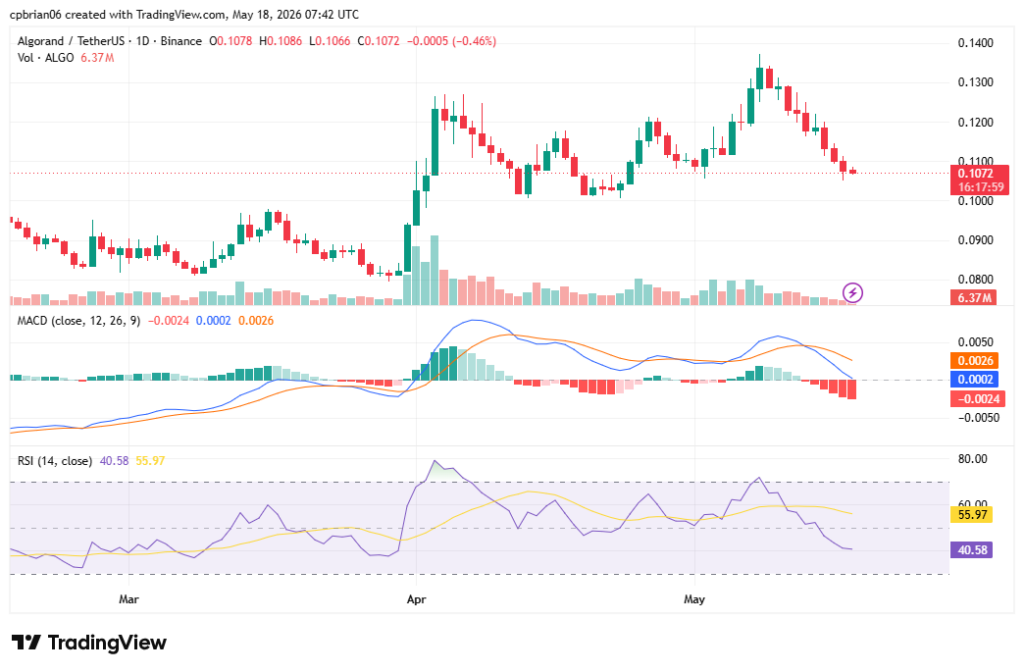
ALGO started recovering this year but later turned bearish after failing to break through the $0.1420 resistance level. In the first week of April, it made a big break, with an over 40% rise in value. The recovery was quickly followed by a reversal as it was heavily overbought. It is now back at its previous lows of $0.107.
The MACD histogram shows that its negative momentum rose over the last five days.
Algorand 4-hour chart analysis
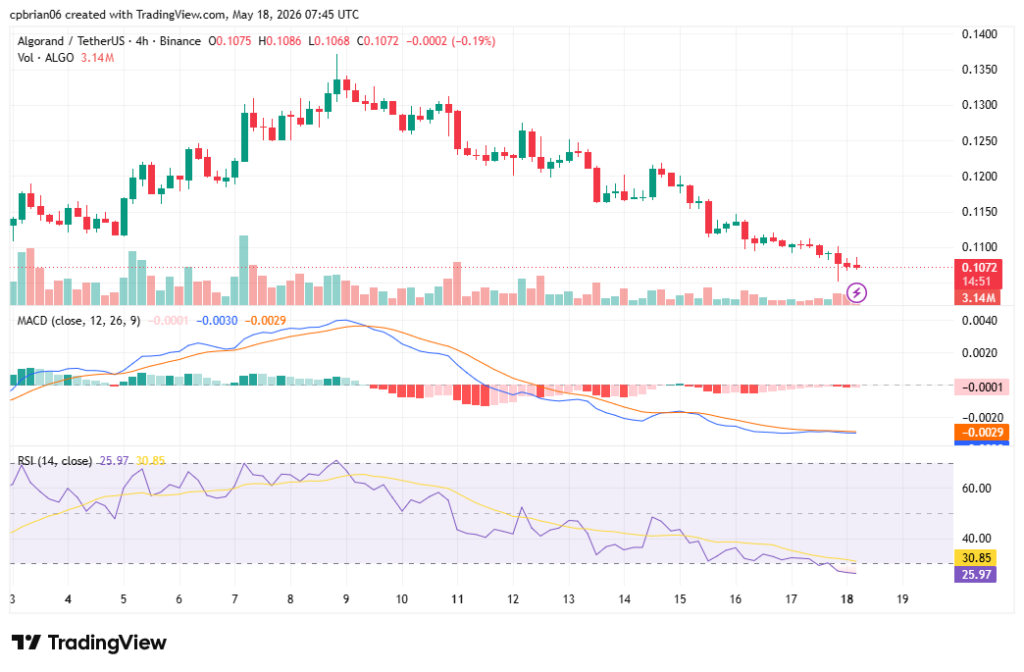
On the 4‑hour chart, ALGO’s rally to $0.1371 and reversal stand out. The reversal is pushing ALGO below all key moving averages. Short MACD histograms signal low momentum, while an oversold RSI suggests an imminent reversal.
Algorand technical indicators: Levels and action
Daily simple moving average (SMA)
| Period | Value ($) | Action |
| SMA 3 | 0.1092 | SELL |
| SMA 5 | 0.1124 | SELL |
| SMA 10 | 0.1194 | SELL |
| SMA 21 | 0.1164 | SELL |
| SMA 50 | 0.1107 | SELL |
| SMA 100 | 0.09853 | BUY |
| SMA 200 | 0.1156 | SELL |
Daily exponential moving average (EMA)
| Period | Value ($) | Action |
| EMA 3 | 0.1093 | SELL |
| EMA 5 | 0.1119 | SELL |
| EMA 10 | 0.1151 | SELL |
| EMA 21 | 0.1152 | SELL |
| EMA 50 | 0.1103 | SELL |
| EMA 100 | 0.1093 | SELL |
| EMA 200 | 0.1230 | SELL |
What to expect from the ALGO price prediction next?
ALGO is bearish and oversold on the shorter timeframes. Rising trading volumes are a sign of strong conviction in the market trend.
Why is ALGO down?
Algorand’s drop closely tracks a 1.54% decline in total crypto market cap. Bitcoin fell amid rising US Treasury yields, hot inflation data, and over $1 billion in weekly spot Bitcoin ETF outflows. As a higher-beta altcoin, ALGO amplified the market’s downward move.
Will ALGO reach $1?
Per our Algorand price forecast, ALGO will break above $1 by the end of 2032.
Can Algorand reach $10?
Per our Cryptopolitan price prediction, ALGO will not break above $10 by the end of 2032.
Can Algorand reach $20?
According to our Cryptopolitan price prediction, it remains improbable for ALGO to break above $20 by the end of 2032.
Can ALGO reach 100 dollars?
At $100, Algorand’s market capitalization must rise above $700 billion from its current $1.2 billion. In comparison, Ethereum’s market capitalization is at $380 billion. Per our price prediction, Algorand is highly unlikely to reach $100.
Is there a future for Algorand?
Like most mega-altcoins, Algorand is trading at its lowest level this year. A break below 30 on the RSI will be crucial to sending it back to previous highs. Looking ahead, ALGO will register new all-time highs in the coming years.
Is ALGO a good investment?
Analysis by Intotheblock shows that over 80% of holders are in the red at the current price. The figure will likely drop lower in the short term. However, as our Cryptopolitan price prediction shows, this will change over the long term.
Recent news
Algorand is among the Agent Payments Protocols supported by Google. This reinforced a narrative of institutional-grade reliability and AI potential.
ALGO price prediction May 2026
The Algorand network price forecast for May is a maximum price of $0.1310 and a minimum price of $0.0820. The average price for the month will be $0.1099.
| Month | Potential low ($) | Potential average ($) | Potential high ($) |
| May | 0.0820 | 0.1099 | 0.1310 |
Algorand price prediction 2026
For 2026, ALGO’s price will range between $0.0845 and $0.2365. The average price for the period will be $0.1896.
| Year | Potential low ($) | Potential average ($) | Potential high ($) |
| 2026 | 0.0845 | 0.1896 | 0.2365 |
Algorand price prediction 2027-2032
| Year | Minimum price | Average price | Maximum price |
| 2026 | 0.0845 | 0.1896 | 0.2765 |
| 2027 | 0.114 | 0.1325 | 0.1511 |
| 2028 | 0.2559 | 0.2942 | 0.3324 |
| 2029 | 0.5082 | 0.6325 | 0.7623 |
| 2030 | 0.2792 | 0.3324 | 0.3856 |
| 2031 | 0.3581 | 0.3979 | 0.4376 |
| 2032 | 0.5278 | 0.6067 | 0.6855 |
Algorand price prediction 2027
Algorand market price prediction climbs even higher into 2027. According to the prediction, Algo’s price will range from $0.1140 to $0.1511, with an average of $0.1325.
Algorand coin price prediction 2028
Our analysis indicates a further acceleration in Algo’s price. It will trade between $0.2559 and $0.3324 and an average price of $0.2942.
Algorand price prediction 2029
According to the 2029 Algorand forecast, the price of Algo will range from $0.5082 to $0.7623, with an average of $0.6325.
Algo price prediction 2030
The Algo price prediction for 2030 is $0.2792-$0.3856, with an average of $0.3324.
Algorand price prediction 2031
The Algorand price forecast for 2031 is a high of $0.4376. It will reach a minimum price of $0.3581 and an average price of $0.3979.
Algorand Algo price prediction 2032
The year 2032 will also be bullish. Our analysis estimates a price range of $0.5278 to $0.6855, with an average price of $0.6067.
Algorand market price prediction: Analyst’s ALGO price forecast
| Platform | 2026 | 2027 | 2028 |
| Coincodex | $0.1136 | $0.1156 | $0.08736 |
| Gate.com | $0.1282 | $0.1346 | $0.1535 |
Cryptopolitan Algorand price prediction
Our predictions indicate that ALGO will achieve a high of $0.24 in 2026. In 2028, it will range between $0.26 and $0.33, with an average of $0.29. In 2030, it will range from $0.28 to $ 0.39, with an average price of $0.33. Note that the predictions are not investment advice. Seek independent professional consultation or do your research.
Algorand price history
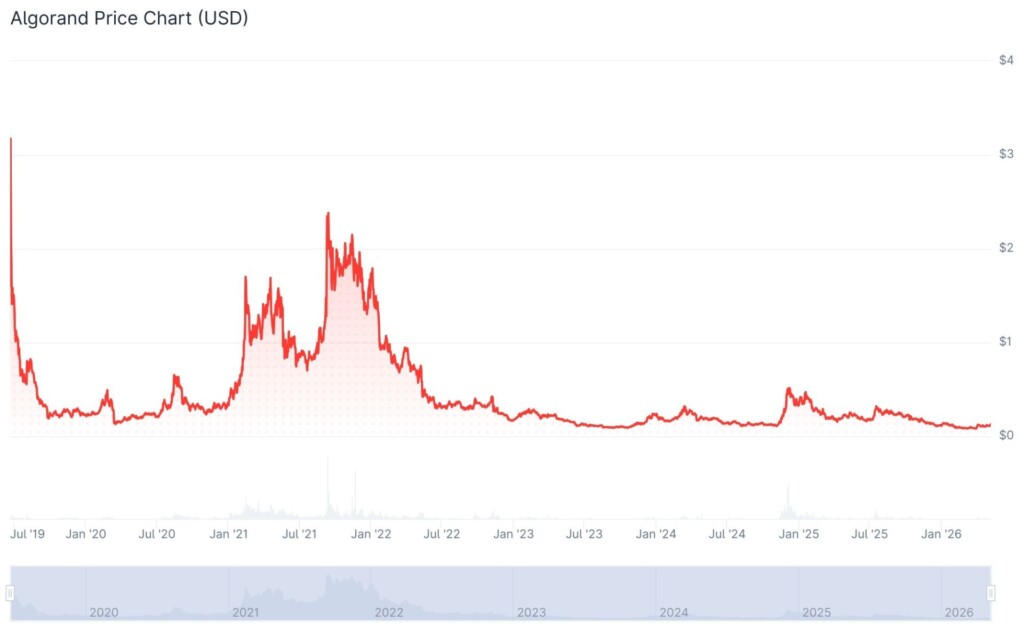
- Algorand conducted its token sale in June 2019 at $2.40 per token.
- Union Square Ventures, Lemniscap, and NGC Ventures, among others, held earlier funding rounds. The public sale raised $60.40 million, while funding rounds raised $66 million.
- Token sale participants who held their tokens since launch are down 90%.
- Binance listed ALGO on 21 June 2019. According to CoinMarketCap data, it pumped after its listing, reaching an all-time high (ATH) of $3.28.
- ALGO later crashed; four months later, it was down 90% from its ATH.
- In July 2021, Coinbase listed the ALGO token. As a result, it gradually recovered, peaking at $0.64 in August.
- In retrospect, 2021 was the golden year for the crypto market. The emergence of NFTs, DeFi growth, and institutional interest drove growth.
- In 2021, it rose from a low of $0.32 in January to $2.30 in October, a 200% gain.
- Nothing prepared crypto enthusiasts for the 2023 crypto winter, which worsened with the FTX crash. The year closed with ALGO trading at $0.23.
- The decline continued through 2023, registering an all-time low at $0.0876 in September.
- The market’s recovery began in October. By the end of the year, it had risen above $0.2.
- It began recovering in November from a low of $0.12, reaching $0.61 in December.
- It then corrected into 2025 below the $0.40 mark in January and $0.35 in February. It crossed into October, trading at $0.22.
- The coin nosedived to $0.14 by December and held that level through January 2026. Momentum then turned bearish, with prices sliding below $0.10 in March. By May, however, it staged a modest recovery to $0.13.
0
0

 Manage all your crypto, NFT and DeFi from one place
Securely connect the portfolio you’re using to start.

0
0

0
0

0
0

0
0